

Introduction
The crystal structure of YteR, a 42.9-kDa cytosolic protein of unknown function from Bacillus subtilis, has been determined at 1.60 Å by the multiwavelength anomalous dispersion (MAD) method. YteR represents a new protein fold, as at the time of deposition there were no homologous structures in the Protein Data Bank (PDB) according to BLAST1 and DALI2 searches. The 71 known members of YteR family are found in bacteria and fungi. B. subtilis YteR is so far the only member with known structure of the six-α-hairpin glycosyltransferases superfamily of the SCOP 1.65 database.3 Other members of this SCOP superfamily include glucoamylase, cellulase catalytic domain, N-acyl-D-glucosamine 2-epimerase, the central domain of Lactobacillus maltose phosphorylase, and the C-terminal domain of bacterial glucoamylase. The nearest genomic neighbors of YteR are hypothetical protein BH0485 from B. halodurans (50% identity) and hypothetical conserved protein (Q8EPL5, 50% sequence identity) from Oceanobacillus iheyensis HTE831.
Materials and Methods
Protein cloning expression and purification
The ORF of YteR was amplified by PCR from Escherichia coli genomic DNA (ATCC). The gene was cloned into the pMCSG7 expression vector. This construct provides for an N-terminal His6 tag separated from the gene by a TEV protease recognition site (ENLYFQ G). The fusion protein was overexpressed in E. coli BL21-Gold (DE3) (Stratagene) harboring an extra plasmid encoding three rare tRNAs (AGG and AGA for Arg, ATA for Ile). The cells were grown in LB media at 37°C to an OD600 of ~0.6 and protein expression induced with 0.4 mM IPTG. After induction, the cells were incubated overnight with shaking at 15°C. The harvested cells were resuspended in binding buffer (500 mM NaCl, 5% glycerol, 50 mM HEPES pH 7.5, 5 mM imidazole), flash-frozen in liquid N2 and stored at 77 K. The thawed cells were incubated for 30 min on ice with lysozyme (Sigma) at 1 mg/mL and protease inhibitors (Sigma, P8849) at 0.05 μL/1 g of cells and lysed by the sonication (6 × 30 s, on ice). The lysate was clarified by centrifugation (30 min at 27,000 × g, RC5C-Plus centrifuge, Sorval) for 20 min followed by filtration through 0.4 μm and 0.22 μm in-line filters (Gelman). The solution was then applied to a metal chelate affinity-column charged with Ni2+. The His6 tagged YteR construct was eluted from the column in elution buffer (500 mM NaCl, 5% glycerol, 50 mM HEPES pH 7.5, 500 mM imidazole) and the fusion tag removed by treatment with recombinant His-tagged TEV protease. The cleaved protein was then resolved from the cleaved His6 tag and the His-tagged protease by flowing the mixture through a second Ni2+-column.4
The protein was dialyzed in 10 mM HEPES pH 7.5, 500 mM NaCl, and concentrated using a BioMax concentrator (Millipore). Before crystallization, any particulate matter was removed from the sample by passing through a 0.2-μm Ultrafree-MC centrifugal filter (Millipore). Selenomethionine enriched protein was prepared using methionine biosynthesis inhibition method.5 The reducing reagent β-mercaptoethanol (5 mM) was added to all purification buffers.
Protein crystallization
The protein was crystallized by vapor diffusion in hanging drops by mixing 1 μL of the protein solution (30 mg/mL) with 1 μL of 1.3 M sodium citrate, 0.1 M Tris, pH 7.5, and equilibrated at 295 K over 500 μL of this solution. Crystals, which appeared after 24 h, were flash-frozen in liquid nitrogen with crystallization buffer plus 15% PEG400 as cryoprotectant prior to data collection. The crystals belong to the hexagonal space group P6122 with cell dimension of a = b = 91.86 Å, c = 179.41 Å, a = β = 90°, γ = 120°.
Data collection
Diffraction data were collected at ~100 K at the 19ID beamline of the Structural Biology Center at the Advanced Photon Source, Argonne National Laboratory. The three-wavelength inverse-beam MAD data up to 1.90 Å (peak: 12.6603 keV (0.9798 Å), inflection point: 12.6586 keV (0.9795 Å), high energy remote: 13.0000 keV (0.9466 Å) were collected from a SeMet labeled protein crystal. One crystal (0.2 × 0.2 × 0.2 mm) was used to collect at 100 K all MAD data sets with a 3-s exposure/0.5°/frame using a 150-mm crystal to detector distance. The total oscillation range was 100°, as predicted using strategy module within HKL2000 suite.6 All data were processed and scaled with HKL2000 (Table I) to an R-merge of 9.4, 11.1, and 8.2% for inflection point, peak, and high-energy remote, respectively. The high resolution data were collected at 0.9798 Å wavelength to 1.60 Å (R-merge of 10.2%) from a single native crystal (0.2 × 0.2 × 0.15 mm) and were used for phase extension and model refinement (Tables I and II).
TABLE I.
Summary of Crystal and MAD Data
| MAD data collection | ||||
|---|---|---|---|---|
| Unit cell | a = b = 91.86 Å, c = 179.41 Å, α = β = 90.00, γ = 120° | |||
| Space group | P 6122 | |||
| MW Da (residues) | 42,968 (373) | |||
| Mol (AU) | 1 | |||
| SeMet (AU) | 11 | |||
| Edge | Peak | Remote | High resolution | |
| Wavelength (Å) | 0.9795 | 0.9798 | 0.9466 | 0.9798 |
| Resolution range (Å) | 1.90 | 1.90 | 1.90 | 50–1.60 (1.66–1.60) |
| No. of unique reflections | 36,275 | 36,271 | 36,281 | 59,188 |
| Completeness (%) | 99.8 | 99.8 | 99.8 | 99.3 (98.3) |
| R merge (%) | 9.4 | 11.1 | 8.2 | 10.2 (0.56) |
TABLE II.
Crystallographic Statistics and Phasing
| Centric |
Acentric |
All |
|||||
|---|---|---|---|---|---|---|---|
| Resolution range (Å) | FOM | Phasing power | FOM | Phasing power | Number | FOM | Phasing power |
| 50.0–1.9 | 0.82 | 3.54 | 0.71 | 2.95 | 62,459 | 0.72 | 2.99 |
| Density modification | 0.79 | ||||||
| Refinement | |||||||
| Resolution range (Å) | 1.60 | ||||||
| No. of reflections | 106,074 | ||||||
| Cutoff | 0 | ||||||
| R-value (%) | 18.7 | ||||||
| Free R-value (%) | 21.4 | ||||||
| RMS deviations from ideal geometry | |||||||
| bond length (1–2) (Å) | 0.007 | ||||||
| angle (°) | 1.3 | ||||||
| Dihedral (°) | 20.3 | ||||||
| Improper (°) | 0.71 | ||||||
| No. of atoms | |||||||
| Protein | 2,961 | ||||||
| Water | 499 | ||||||
| Mean B-factor (Å2) | 20.0 | ||||||
| Ramachandran plot statistics (%) | |||||||
| Residues in most favored regions | 94.4% | ||||||
| Residues in additional allowed regions | 5.6% | ||||||
| Residues in disallowed region | 0.0% | ||||||
Structure determination and refinement
The structure was determined by MAD phasing using CNS7 and refined initially to 1.90 Å using CNS against the peak data. The initial model was autotraced using ARP/wARP8 and manual adjustment was completed using QUANTA.9 The model was further refined against high-resolution native data to 1.60 Å. The final R was 18.7% and the free R of 21.4% (Table II). Electron density calculated at 1.0 σ is well connected for most of the main chain except a region of residues 1–10, which are disordered in the crystal structure. The stereochemistry of the structure was checked with PROCHECK10 and the Ramachandran plot. The main chain torsion angles for all residues are in the allowed regions and additional allowed regions.
Accession numbers
Atomic coordinates of YteR have been deposited into the PDB as 1NC5. The SCOP identification for its hypothetical protein family is 89109, and the SCOP identification for the six-hairpin glycoside transferase superfamily is 48208.
Discussion
Overall structure of YteR
YteR exhibits an α/α double-toroid structure (Fig. 1) with its six α-hairpins arranged in a double α-helical barrel with diameter of 17 Å for inner and 30 Å for the outside barrel. Five true α-hairpins are complemented by the sixth α-hairpin-like structure formed by the N- and C-terminal α-helices. The first 10 residues are not visible in the electron density and are disordered. The inner and the outside circle α-helices are connected through loops and β-turns and are tilted ~50 and ~70°, respectively, in respect to the pseudo sixfold dyad of the toroid.
Fig. 1.
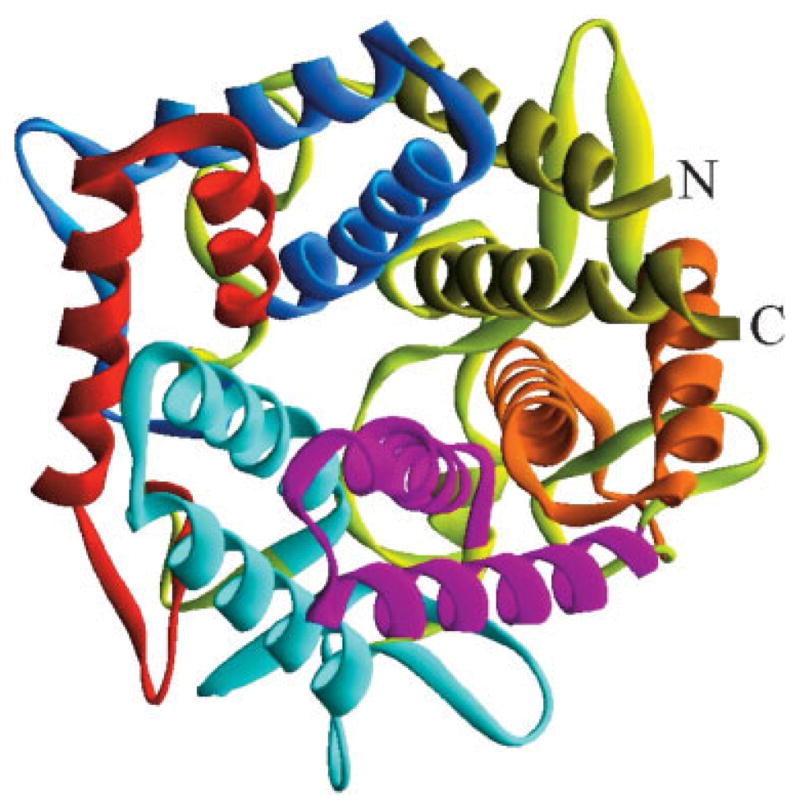
This ribbon drawing shows the closed circular array formed by the six-alpha hairpins of YteR, each indicated by a unique color. Counterclockwise from the N-terminus: HP1 is blue, HP2 is red, HP3 is light blue, HP4 is purple, HP5 is orange, and H6 is yellow-green. The picture was generated using DS ViewerPro.9
Five sequences in YteR match the characteristic hairpin motif 48,208 of the glycosyltransferases superfamily (Typ41 to Asp88, Ala92 to Lys133, Trp141 to Cys206, Arg270 to Lys289, Asp297 to Lys315) (Fig. 2).11 Five α-hairpins correspond to residues (HP1: Typ41 to Asp88; HP2: Ala92 to Lys133; HP3: Trp141 to Cys206; HP4: Ala212 to Cys251; HP5: Arg270 to Lys315). The N-terminus (Lys11–Thr27) and C-terminus (Leu351–Lys373) would form the sixth α-hairpin (H6) upon the addition of a short linker region (Fig. 1).
Fig. 2.
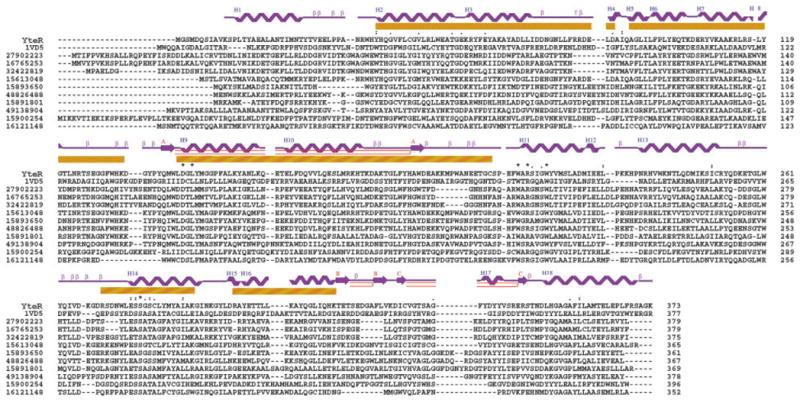
Multiple sequence alignment, superfamily motifs, and secondary structure analysis of YteR: the alignment of one-letter amino acid sequences of Yter and 11 homologous structures was performed by ClusterX.22 The numbers in the left column are NCBI gi accession codes, and the numbers in the right column indicate the residue numbers at the end of each row. The yellow bars designate residues in YteR that match the six-hairpin glycosyltransferases motif 48208 (Typ41 to Asp88, Ala92 to Lys133, Trp141 to Cys206, Arg270 to Lys289, Asp297 to Lys315).11 The secondary elements are indicated above the one-letter amino acid codes of YteR.
YteR has three small antiparallel sheets containing 2 β-strands each, 18 α-helices, 28 β-turns, 1 γ-turn, 1 β-bulge, 3 β-hairpins in its secondary structure.12 No internal matching motifs were found by InterPro.13 Three functionally significant nest binding sites were identified from Lys293 to Leu296, Asp321 to Ala323, and Thr184 to Leu186.11
In the middle of the toroid there is a large central pocket with a surface area of 411.1 Å2 and volume of 574.0 Å3. The associated residues of this pocket are Cys48, Leu51, Arg52, Glu55, Leu94, Ile95, Phe97, Pro98, Tyr146, Pro150, Lys154, Met220, Asp224, Met225, Glu227, Glu228, Tyr285, Lys289, and Leu359.14 At the bottom of this large pocket highly conserved Trp217 is located.
Active site and possible function of YteR
One face of toroid is covered by several loops, the other face is solvent accessible. Sequence and structure analyses show that among members of the family only six residues are fully conserved (Asp143, Leu145, Trp211, Arg213, Trp217, and Ser278) (Fig. 2). All are located very closely in the structure and form a solvent exposed putative active site [Fig. 3(a) and (b)]. The access to the site is partly blocked by two loops (residues Cys330 –Gly336 and His132–Tyr138). Similar residue conservation in the structure was observed for family of SurE protein.15
Fig. 3.
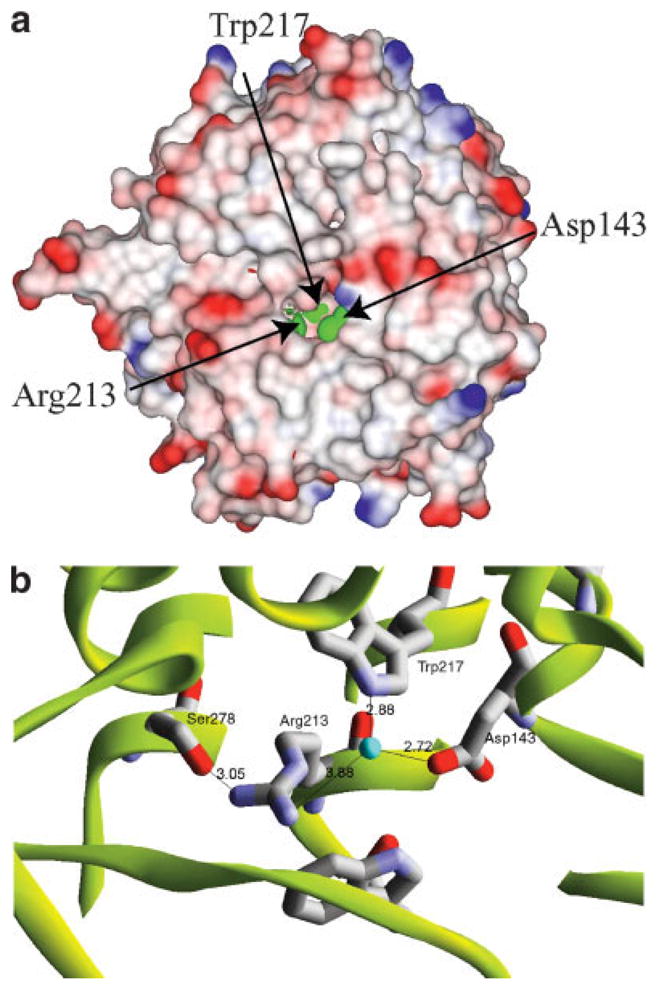
(a) Electrostatic surface potentials of YteR protein. The green represents solvent-exposed putative active site residues. The surface was calculated with 1.4 Å radius. Blue shading represents positive potential and red the negative potential. Labels indicate amino acid residues. This image was created by the program DS ViewerPro.9 (b) Close-up view of the putative active site. Arg213, Trp217, Asp143, and Ser278 are coordinated by ordered water molecule. These residues are located close enough for hydrogen bonds. Atomic distances in angstroms are labeled in black. This image was created by the program DS ViewerPro.9
Since the PDB deposition of YteR, Itoh et al.16 reported an homologous crystal structure (PDB ID 1VD5) of unsaturated glucuronyl hydrolase (UGL) from Bacillus sp. GL116 with 14% sequence identity and 31% sequence similarity. The UGL was shown to be responsible for the degradation of glycosaminoglycan16 and may be important in polysaccharide metabolism.
YteR Cα carbons can be superimposed with UGL with 1.69 Å RMSD, suggesting that the structures are very similar and both proteins share residues comprising the presumed active site. The UGL structure contains several ligands [four glycine molecules, two dithiothreitol molecules, and one 2-methyl-2,4-pentanediol (MPD)] near the presumed active site. The YteR active site is empty, and several secondary structure elements near the active site are shifted, suggesting that UGL structure may represent an “open” and YteR structure a “closed” conformation. In fact, in YteR only Asp143, Arg213 and Trp217 are solvent accessible [Fig. 3(b)].
It has been found that Erwinia chrysanthemi produces lyases for oligogalacturonate17 and Sphingomonas sp. A1 produces lyases that degrade oligoalginate.18 Interestingly, YteR shares conserved resides with E. chrysanthemi lyase as well as B. subtilis UGL (Fig. 2). Moreover, YteR shares the structure with UGL, suggesting that the YteR may possess glucoronyl hydrolase activity. It is possible that in B. subtilis YteR’s role is to hydrolyze a specific glycosidic bond in unsaturated saccharides that are produced by polysaccharide lyases reactions19 and assist with the ultimate conversion of the released saccharide to an alpha-keto acid.16
Sequence and structural comparisons
Sequence analysis using BLAST found 42 closely matching sequences in other proteins (Fig. 2).1 According to SSM analysis, there are two structural homologues in the PDB with over 60% matching secondary structure elements:11 both N-acyl-D-glucosamine 2-epimerase from porcine kidney (PDB ID 1FP3) and rab escort protein-1 in complex with rab geranylgeranyl transferase and isoprenoid (PDB ID 1LTX) were identified as 65% aligned with YteR. However, these structures show low overall homology, as shown by their Q-scores of 0.25 and 0.15, z-scores of 3.34 and 3.76, and RMSD of 3.34 Å and 3.76 Å, respectively.
Low protein surface similarities were found between YteR and patterns in the CASTp database.14 A GRATH comparison20 against the CATH database21 found only low homology to some structures in the PDB according to protein size, secondary structure alignment, and the number of residues in these matching secondary structures: N-terminally truncated C3D, G fragment of the complement system (PDB ID 1QQF), alginate lyase A1-III from Sphingomonas species A1 (PDB ID 1QAZ), cold-adapted family 8 xylanase (PDB ID 1H12), vesicular transport protein Sec17 (PDB ID 1QQE). Respective e-values from GRATH show low homology with scores of −2.918, −2.277, −1.269, and −0.507.
Acknowledgments
We wish to thank all members of the Structural Biology Center at Argonne National Laboratory for their help in conducting experiments, and Lindy Keller for help in preparation of this manuscript. This work was supported by National Institutes of Health Grant GM62414 and by the U.S. Department of Energy, Office of Biological and Environmental Research, under contract W-31-109-Eng-38.
Footnotes
The submitted manuscript has been created by the University of Chicago as Operator of Argonne National Laboratory (“Argonne”) under Contract No. W-31-109-ENG-38 with the U.S. Department of Energy. The U.S. Government retains for itself, and others acting on its behalf, a paid-up, nonexclusive, irrevocable worldwide licence in said article to reproduce, prepare derivative works, distribute copies to the public, and perform publicly and display publicly, by or on behalf of the Government.
References
- 1.Altschul SF, Madden TL, Schaffer AA, Zhang J, Zhang Z, Miller W, Lipman DJ. Gapped BLAST and PSI-BLAST: a new generation of protein database search programs. Nucleic Acids Res. 1997;25:3389–3402. doi: 10.1093/nar/25.17.3389. [DOI] [PMC free article] [PubMed] [Google Scholar]
- 2.Holm L, Sander C. Protein structure comparison by alignment of distance matrices. J Mol Biol. 1993;233:123–138. doi: 10.1006/jmbi.1993.1489. [DOI] [PubMed] [Google Scholar]
- 3.Murzin AG, Brenner SE, Hubbard T, Chothia C. SCOP: a structural classification of proteins database for the investigation of sequences and structures. J Mol Biol. 1995;247:536–540. doi: 10.1006/jmbi.1995.0159. [DOI] [PubMed] [Google Scholar]
- 4.Kim Y, Dementieva I, Zhou M, Wu R, Lezondra L, Quartey P, Joachimiak G, Korolev O, Li H, Joachimiak A. Automation of protein purification for structural genomics. J Struct Funct Genomics. 2004;5:111–118. doi: 10.1023/B:JSFG.0000029206.07778.fc. [DOI] [PMC free article] [PubMed] [Google Scholar]
- 5.Walsh MA, Dementieva I, Evans G, Sanishvili R, Joachimiak A. Taking MAD to the extreme: ultrafast protein structure determination. Acta Crystallogr D Biol Crystallogr. 1999;55:1168–1173. doi: 10.1107/s0907444999003698. [DOI] [PubMed] [Google Scholar]
- 6.Otwinowski Z, Minor W. Processing of x-ray diffraction data collected in oscillation mode. Methods Enzymol. 1997;276:307–326. doi: 10.1016/S0076-6879(97)76066-X. [DOI] [PubMed] [Google Scholar]
- 7.Brunger AT, Adams PD, Clore GM, DeLano WL, Gros P, Grosse-Kunstleve RW, Jiang JS, Kuszewski J, Nilges M, Pannu NS, Read RJ, Rice LM, Simonson T, Warren GL. Crystallography & NMR system: a new software suite for macromolecular structure determination. Acta Crystallogr D Biol Crystallogr. 1998;54:905–921. doi: 10.1107/s0907444998003254. [DOI] [PubMed] [Google Scholar]
- 8.Morris RJ, Perrakis A, Lamzin VS. ARP/wARP and automatic interpretation of protein electron density maps. Methods Enzymol. 2003;374:229–244. doi: 10.1016/S0076-6879(03)74011-7. [DOI] [PubMed] [Google Scholar]
- 9.Quanta/DS ViewerPro. Accelrys Inc; San Diego: 2003. [Google Scholar]
- 10.Laskowski RA, MacArthur MW, Moss DS, Thornton JM. PROCHECK: a program to check the stereochemical quality of protein structures. J Appl Crystallogr. 1993;26:283–291. [Google Scholar]
- 11.Laskowski RA, Watson JD, Thornton JM. From protein structure to biochemical function? J Struct Funct Genomics. 2003;4:167–177. doi: 10.1023/a:1026127927612. [DOI] [PubMed] [Google Scholar]
- 12.Laskowski RA, Hutchinson EG, Michie AD, Wallace AC, Jones ML, Thornton JM. PDBsum: a Web-based database of summaries and analyses of all PDB structures. Trends Biochem Sci. 1997;22:488–490. doi: 10.1016/s0968-0004(97)01140-7. [DOI] [PubMed] [Google Scholar]
- 13.Mulder NJ, Apweiler R, Attwood TK, Bairoch A, Barrell D, Bateman A, Binns D, Biswas M, Bradley P, Bork P, Bucher P, Copley RR, Courcelle E, Das U, Durbin R, Falquet L, Fleischmann W, Griffiths-Jones S, Haft D, Harte N, Hulo N, Kahn D, Kanapin A, Krestyaninova M, Lopez R, Letunic I, Lonsdale D, Silventoinen V, Orchard SE, Pagni M, Peyruc D, Ponting CP, Selengut JD, Servant F, Sigrist CJA, Vaughan R, Zdobnov EM. The InterPro Database, 2003 brings increased coverage and new features. Nucleic Acids Res. 2003;31:315–318. doi: 10.1093/nar/gkg046. [DOI] [PMC free article] [PubMed] [Google Scholar]
- 14.Binkowski TA, Naghibzadeh S, Liang J. CASTp: computed atlas of surface topography of proteins. Nucleic Acids Res. 2003;31:3352–3355. doi: 10.1093/nar/gkg512. [DOI] [PMC free article] [PubMed] [Google Scholar]
- 15.Zhang RG, Skarina T, Katz JE, Beasley S, Khachatryan A, Vyas S, Arrowsmith CH, Clarke S, Edwards A, Joachimiak A, Savchenko A. Structure of Thermotoga maritima stationary phase survival protein SurE: novel acid phosphatase. Structure (Camb) 2001;9:1095–1106. doi: 10.1016/s0969-2126(01)00675-x. [DOI] [PMC free article] [PubMed] [Google Scholar]
- 16.Itoh T, Akao S, Hashimoto W, Mikami B, Murata K. Crystal structure of unsaturated glucuronyl hydrolase, responsible for the degradation of glycosaminoglycan, from Bacillus sp. GL1 at 1.8 A resolution. J Biol Chem. 2004;279:31804–31812. doi: 10.1074/jbc.M403288200. [DOI] [PubMed] [Google Scholar]
- 17.Shevchik VE, Condemine G, Robert-Baudouy J, Hugouvieux-Cotte-Pattat N. The exopolygalacturonate lyase PelW and the oligogalacturonate lyase ogl, two cytoplasmic enzymes of pectin catabolism in Erwinia chrysanthemi 3937. J Bacteriol. 1999;181:3912–3919. doi: 10.1128/jb.181.13.3912-3919.1999. [DOI] [PMC free article] [PubMed] [Google Scholar]
- 18.Hashimoto W, Miyake O, Momma K, Kawai S, Murata K. Molecular Identification of oligoalginate lyase of Sphingomonas sp. strain A1 as one of the enzymes required for complete depolymerization of alginate. J Bacteriol. 2000;182:4572–4577. doi: 10.1128/jb.182.16.4572-4577.2000. [DOI] [PMC free article] [PubMed] [Google Scholar]
- 19.Herron SR, Benen JA, Scavetta RD, Visser J, Jurnak F. Structure and function of pectic enzymes: virulence factors of plant pathogens. Proc Natl Acad Sci USA. 2000;97:8762–8769. doi: 10.1073/pnas.97.16.8762. [DOI] [PMC free article] [PubMed] [Google Scholar]
- 20.Harrison A, Pearl F, Sillitoe I, Slide T, Mott R, Thornton J, Orengo C. Recognizing the fold of a protein structure. Bioinformatics. 2003;19:1748–1759. doi: 10.1093/bioinformatics/btg240. [DOI] [PubMed] [Google Scholar]
- 21.Pearl FMG, Lee D, Bray JE, Sillitoe I, Todd AE, Harrison AP, Thornton JM, Orengo CA. Assigning genomic sequences to CATH. Nucleic Acids Res. 2000;28:277–282. doi: 10.1093/nar/28.1.277. [DOI] [PMC free article] [PubMed] [Google Scholar]
- 22.Chenna R, Sugawara H, Koike T, Lopez R, Gibson TJ, Higgins DG, Thompson JD. Multiple sequence alignment with the Clustal series of programs. Nucleic Acids Res. 2003;31:3497–3500. doi: 10.1093/nar/gkg500. [DOI] [PMC free article] [PubMed] [Google Scholar]