

Summary
Ribose-5-phosphate isomerase A (RpiA; EC 5.3.1.6) interconverts ribose-5-phosphate and ribulose-5-phosphate. This enzyme plays essential roles in carbohydrate anabolism and catabolism; it is ubiquitous and highly conserved. The structure of RpiA from Escherichia coli was solved by multiwavelength anomalous diffraction (MAD) phasing, and refined to 1.5 Å resolution (R factor 22.4%, Rfree 23.7%). RpiA exhibits an α/β/(α/β)/β/α fold, some portions of which are similar to proteins of the alcohol dehydrogenase family. The two subunits of the dimer in the asymmetric unit have different conformations, representing the opening/closing of a cleft. Active site residues were identified in the cleft using sequence conservation, as well as the structure of a complex with the inhibitor arabinose-5-phosphate at 1.25 Å resolution. A mechanism for acid-base catalysis is proposed.
Keywords: ribose-5-phosphate isomerase, MAD, X-ray crystallography, pentose phosphate pathway, Calvin cycle, arabinose-5-phosphate
Introduction
Ribose-5-phosphate isomerase A (RpiA; EC 5.3.1.6, COG0120) catalyzes the interconversion of ribose-5-phosphate and ribulose-5-phosphate (Figure 1). This intracellular enzyme is essential in the pentose phosphate pathway and in the Calvin cycle of plants. It is ubiquitous and its sequence is highly conserved in species ranging from archaea and bacteria to plants and animals.
Figure 1. RpiA Reaction.
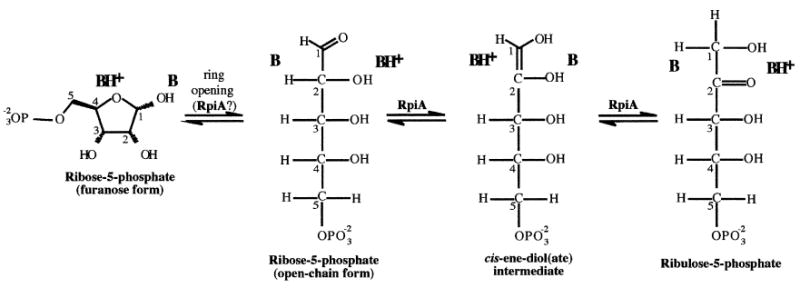
The expected catalytic acids and bases are placed with respect to the substrates, products, and intermediates. Carbon atoms of the sugars are numbered.
As is true for most isomerases, the reaction of RpiA is near equilibrium; the Keq of the spinach enzyme, for example, is 0.32 [1]. Indeed, whether RpiA is viewed as an anabolic or catabolic enzyme depends on the particular metabolic circumstances. When ribose-5-phosphate is abundant, the reaction runs in the “forward” direction as part of the nonoxidative branch of the pentose phosphate pathway. This ultimately converts the phosphosugar into intermediates for glycolysis, and so provides precursors for the synthesis of amino acids, vitamins, nucleotides, and cell wall constituents. In plants, ribulose-5-phosphate is phosphorylated to form ribulose-1,5-bisphosphate, the vital acceptor of CO2 in the first dark reaction of photosynthesis. Running “in reverse,” RpiA is the final step in converting glucose-6-phosphate into the ribose-5-phosphate required for synthesis of nucleotides and cofactors; the previous steps, which comprise the oxidative branch of the pentose phosphate pathway, are a major source of the NADPH needed for reductive biosynthesis. Despite its central role in metabolism, many details of RpiA's action have to date remained poorly understood, largely because of a lack of structural data.
The necessary catalytic components for the conversion of the aldose to the ketose (or vice versa) are shown in Figure 1. The isomerization requires the open chain form of the sugar, which is normally in equilibrium with the more common α- and β-furanose sugars; the three species interconvert freely via both acid- and base-catalyzed mechanisms in solution. There is kinetic evidence that RpiA must bind to one or more of the furanose forms, and it has been proposed that the ring is opened in situ, possibly with the enzyme providing catalytic assistance [2]. The isomerization itself is a 1,2 shift similar to that carried out by triose phosphate isomerase and phosphoglucose isomerase [3]. In the “forward” direction, a basic group of the enzyme must extract a proton from C2 of the aldose, generating a cis-1,2-enediol(ate) intermediate, and then release the same proton at C1. Simultaneously, a second protein group located on the opposite site of the active site transfers a proton from O2 to O1, to produce the ketose sugar. The “reverse” reaction is apparently just that, the same steps acting in the opposite sense. Ribulose-5-phosphate cannot close to form a ring, and so that portion of the catalytic problem need not be solved by the isomerase.
RpiA has been sequenced from at least 60 species and cloned from a number of organisms, including Escherichia coli [4] and spinach [2]; the amino acid sequences share ∼30% identity with each other and with the sequence of the human enzyme (http://www.ncbi.nlm.nih.gov). A second, unrelated enzyme has been characterized in E. coli [5]; RpiB is also of unknown structure, but its distribution and metabolic roles appear to be narrower.
RpiA was selected as a target in an ongoing structural proteomics project (http://www.mcsg.anl.gov; http://www.uhnres.utoronto.ca/proteomics) because it is a member of a large, highly conserved family of proteins central to metabolism in all three kingdoms of life, and because it did not have a known structural homolog. In this paper, we report the 1.5 Å resolution structure of RpiA from E. coli as well as the 1.25 Å structure of the same enzyme in complex with the inhibitor arabinose-5-phosphate. These structures allowed us to identify the residues of its active site, showed that conformational changes are likely to be an essential part of its function, and allowed us to propose a catalytic mechanism. Very recently, the structure of a hyperthermostable RpiA from Pyrococcus horikoshii was published [6], which both confirms our results and provides complementary information in the form of a complex with the inhibitor D-4-phosphoerythronic acid.
Results and Discussion
Preparation and Characterization of RpiA
E. coli RpiA was overexpressed as a His-tagged Se-Met-labeled protein, which was subsequently treated with TEV protease to remove the affinity tag. The kinetic properties of the final enzyme preparation were tested using a spectrophotometric assay that follows the conversion of ribose-5-phosphate to ribulose-5-phosphate. The results of a typical set of kinetic experiments are shown in Figure 2. Multiple series were used to determine a kcat of 2100 ± 300 s−1 and a Km of 3.1 ± 0.2 mM; the specificity constant, kcat/Km, is thus 6.8 × 10⁵. These values are in good agreement with previously published data for the natural form of RpiA purified from E. coli extracts [5, 7].
Figure 2. Enzymatic Characterization.
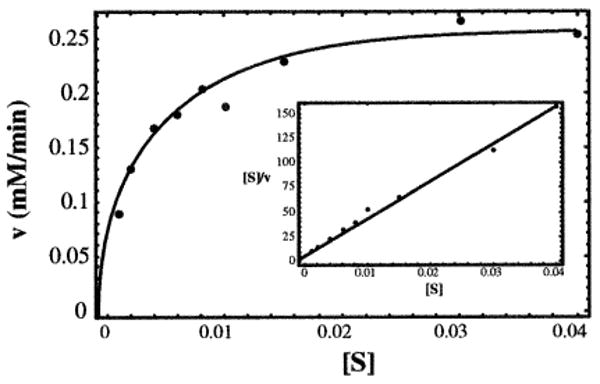
Data from a typical series of kinetic experiments are shown, together with the curve calculated from the Michaelis-Menten equation using the overall average kcat of 2100 s−1 and Km of 3.1 mM (enzyme concentration 2.2 nM). An insert presents the same data in a Hanes/Woolf plot; the line calculated with the average kinetic constants is also shown.
Overall Structure
The 1.5 Å structure of apo RpiA was determined using multiwavelength anomalous dispersion (MAD) data from a single crystal of Se-Met-substituted enzyme (Table 1). A representative sample of electron density in the original MAD map is shown in Figure 3. The apo structure was subsequently refined at the same resolution, as summarized in Table 2.
Table 1.
Crystal, Data Collection, and Phasing Statistics
| Apo peak | Apo inflection | Apo remote | Ara-5-P complex | |
|---|---|---|---|---|
| λ (Å) | 0.9795 | 0.9798 | 0.9465 | 0.934 |
| Resolution (Å) | 1.5 | 1.5 | 1.5 | 1.25 |
| Reflections (measured) | 226,333 | 230,065 | 323,503 | 392,371 |
| Reflections (unique) | 60,465 | 60,750 | 62,538 | 90,067 |
| Completeness (%, outer shell) | 93.8 | 94.3 | 97.1 | 40.1 |
| Rmergea (overall) | 0.093 | 0.090 | 0.078 | 0.086 |
| Average I/σ(I)b | 19.4 | 17.26 | 18.9 | 12.40 |
| Phasing powerb | 2.24 | 2.86 | 1.74 | - |
| FOMMADc | 0.4198 | 0.4593 | 0.3323 | - |
| FOMMAD (overall) | 0.7224 | - | ||
| FOM (sf)d | 0.8997 | - |
Both the apo and arabinose-5-phosphate complex forms represent the Se-Met enzyme, and crystallized in space group P1. The unit cell dimensions were a = 42.119 Å, b = 42.120 Å, c = 59.429 Å, α = 89.943°, β = 100.95°, γ = 98.729° for the apo form, and a = 42.049 A, b = 42.400 Å, c = 60.195 Å, α = 90.23°, β = 100.98°, γ = 98.98° for the inhibitor complex.
Rmerge = ΣΣ| Ii − Im |/ΣΣ Ii, where Ii is the intensity of the measured reflection and Im is the mean intensity of all symmetry-related reflections.
Phasing power = FH/ERMS. FP, FPH, and FH are the protein, derivative, and heavy atom structure factors, respectively, and ERMS is the residual lack of closure.
Figure of merit from MAD phasing.
Figure of merit after solvent flipping.
Figure 3. Representative Section of Electron Density in the Original MAD Map.

Contoured at 1 σ.
Table 2.
Structure Refinement Statistics
| Model | Apo | Ara-5-P complex |
|---|---|---|
| Resolution range (Å) | 34.35–1.5 | 40.0–1.25 |
| No. of reflections used | 119,003 | 86,708 |
| No. of reflections used for Rfree calculation | 5,874 | 4,498 |
| Completeness (%) | 93.8 | 81.8 |
| R value, Rfree value (%) | 22.4, 23.7 | 22.7, 24.5 |
| No. of nonhydrogen atoms | 3,850 | 3,101 |
| No. of solvent waters | 660 | 302 |
| Mean B factor, protein (Å2) | 13.3 | 9.5 |
| Average B factor, solvent atoms (Å2) | 28.6 | 25.0 |
| Average B factor, ligand atoms (Å2) | - | 16.7 |
| Ramachandran plot outliers (%)a | 0 | 0 |
| Rmsd bond length from ideal (Å) | 0.004 | 0.030 |
| Rmsd bond angle from ideal (°) | 1.3 | 1.5 |
Using a stringent boundary Ramachandran plot [25].
The fold includes three β sheets, onto which a total of six helices are packed (Figures 4A and 4B). Sheet A includes six parallel β strands; a seventh short strand (β15) lies antiparallel. The first four strands begin the classic pattern of a Rossmann fold, the sheet of which is completed by two strands later in the sequence (β7 and β14). Three helices (α1–α3) shield the concave face of this sheet from solvent. Sheet B acts as a central platform within the structure, and consists of four short strands arranged in a mixed sheet; helix α4 is inserted between sheets A and B. Sheet C comprises four antiparallel strands, with two helices (α5 and α6) protecting its external face.
Figure 4. Dimer of RpiA.
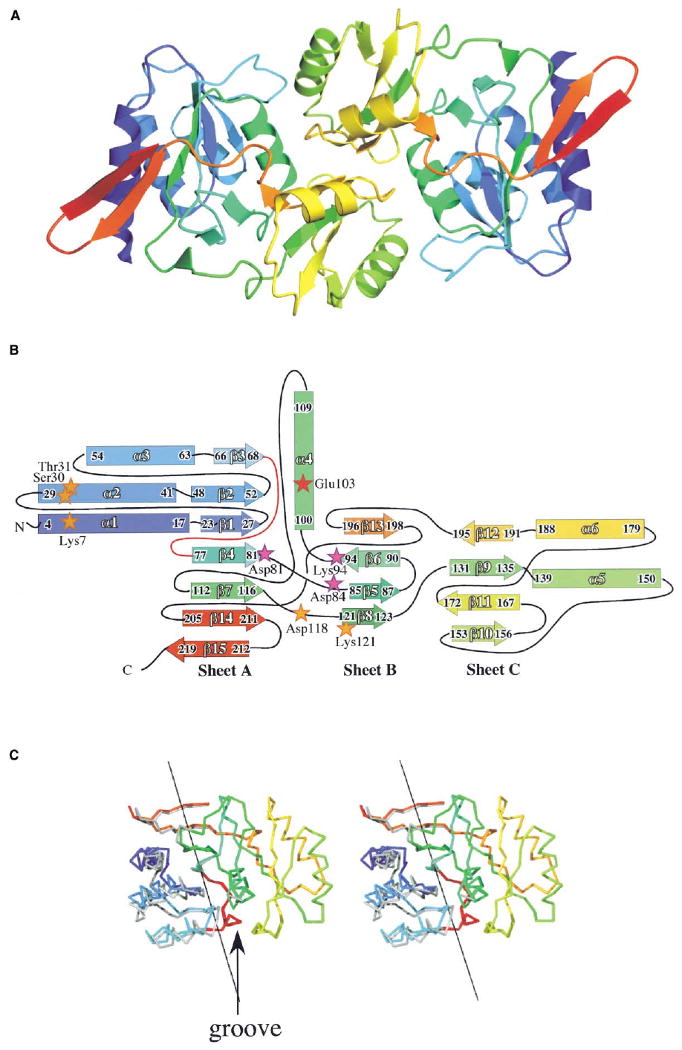
(A) The two subunits of RpiA are shown, each color coded, going through the rainbow from blue at the N terminus to red at the C terminus.
(B) Topology diagram of a subunit, colored in the same way. First and last residues of secondary structural elements are indicated, along with the naming convention. Three active site residues (Asp81, Asp84, and Lys94) identified by earlier studies [2] are shown as magenta stars, while a fourth catalytic residue (Glu103) is shown as a red star. Five other residues (Lys7, Ser30, Thr31, Asp118, and Lys121), which contribute to a phosphate binding site, are indicated with orange stars. The loop that acts as a hinge within the subunit is red.
(C) Comparison of the two subunits of the apo structure, illustrating the conformational differences observed. Residues 68–205 were superimposed, with the N-terminal domain of the A molecule in rainbow coloring and the B molecule in gray. The axis that describes the rotation of the N-terminal portion of the structure with respect to the rest is shown as a black line, and the putative hinge is marked in red. The groove in the enzyme surface that is affected by conformational differences is indicated.
RpiA appears in the crystal as a dimer with pseudo-2-fold symmetry (Figure 4A). The dimer interface includes contributions from six segments of each subunit: residues 70–74 (β3/β4 loop), 101–109 (α4), 136–145 (α5 and the loop preceding it), 163–166 (β10/β11 loop), 183–194 (α6 and β12), and 200-201 (β13/β14 loop). Each subunit buries 1140 Å2 of its surface in the dimer interface, near the average observed for homodimers of similar size and complexity [8]. The subunit surfaces are very complementary in shape; the interface is calculated to have a gap volume index of 2.2, also average for a homodimer [8]. Approximately 62% of the atoms providing contacts are nonpolar; there are relatively few hydrogen bonds, although two salt bridges are buried in the interface (linking Lys104 and Glu183 of the same subunits). This dimer is likely to be the functional unit in solution, in agreement with published data for both E. coli [5] and spinach [9] enzymes.
The two subunits in the dimer have different conformations, the result of motion of two largely rigid domains with respect to each other in the subunit (Figure 4C). The smaller of the two domains includes residues 1–67; only α1 does not align within a 0.7 Å cutoff when the N-terminal domains of the A and B molecules are superimposed. The larger domain comprises residues 68–219. In this C-terminal domain, 134 Cα atoms can be superimposed with an rmsd (root-mean-square difference) of 0.23 Å (only 98–100 and 117–119 do not fall within the 0.7 Å cutoff); this region of the two subunits is superimposed in Figure 4C. As the C-terminal domain includes all segments that form the dimer interface, that interaction provides a rather rigid core within the overall structure. In the dimer, 262 Cαs can be aligned with an rmsd of 0.31 Å. Figure 4 shows that the conformational difference represents a flexion in the middle of sheet A (the hinge is colored red in Figures 4B and 4C): α1–α3 and β1–β3 move as a unit with respect to the rest of the structure. The main consequence is to change the size of a groove on the surface of RpiA. This groove is narrower in the B molecule of the asymmetric unit, and so we will refer to the B molecule as being more closed. While it is possible that the conformers observed represent solution species trapped by the crystal packing, the differences certainly indicate points of flexibility in the subunit structure.
Comparison to Other Sequences and Structures
Conservation in the known amino acid sequences of the RpiA subfamily is illustrated by the alignment of eight representative members in Figure 5. The largest concentration of conserved residues on the surface of the protein lines the groove mentioned above in the context of conformational changes (Figure 6A). The dimer interface is only slightly more conserved than the rest of the protein surface.
Figure 5. Sequence Conservation in the RpiA Family.
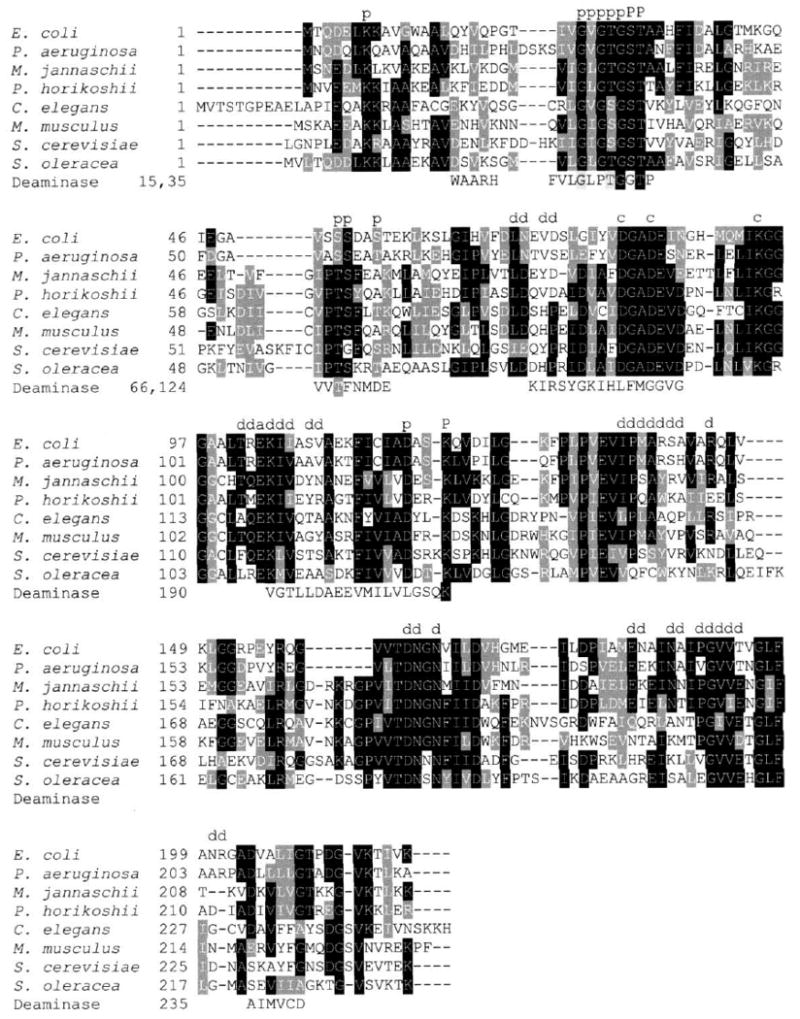
Eight representative sequences are aligned, and shaded according to the degree of conservation: E. coli (gi|1789270),Pseudomonas aeruginosa (gi|9946176), Methanococcus jannaschii (gi|2826437), Pyrococcus horikoshii (gi|21730744), Caenorhabditis elegans (gi|17551757), Mus musculus (gi|836673), Saccharomyces cerevisiae (gi|1262139), and Spinacia oleracea (gi|18654316). Residues previously implicated in catalysis by mutagenesis studies [2] are indicated by “c,” and an additional catalytic residue suggested by the present analysis by “a.” Residues of the phosphate binding site are marked by a capital “P” if they are directly involved in binding, and by a small “p” if their role is indirect. Residues in the dimer interface are also marked “d.” The segments of glucosamine-6-phosphate deaminase that match within a 3.8 Å cutoff in the structural alignment are shown, together with the starting residue number of each segment; three key conserved residues of the phosphate binding site of the deaminase are shaded black.
Figure 6. Complex with Inhibitor.

(A) Stereo diagram of the Cα backbone of the B subunit of E. coli RpiA, numbered every twentieth residue. The molecule is color coded according to sequence conservation in the RpiA family, based on the alignment in Figure 5: red is most conserved, and green is least conserved. The side chains of the residues of the active site are shown, together with the arabinose-5-phosphate inhibitor (cyan). Neighboring portions of the A subunit of the same dimer are gray.
(B) Fo – Fc map of the active site of the B subunit, in the last refinement cycle before inclusion of arabinose-5-phosphate in the phases; the position of the inhibitor in the last refinement cycle is shown for comparison. The C1 and C2 atoms of the inhibitor are marked with asterisks. Residues in the catalytic site are labeled gray. Residues of the phosphate binding site are lilac and labeled with black italics.
(C) Interactions between the inhibitor and the B subunit; those for the A molecule are the same.
The structure of a hyperthermostable RpiA from Pyrococcus horikoshii was published recently [6], an enzyme that shares ∼40% sequence identity with E. coli RpiA. The archaeal enzyme is a tetramer generated by the association of two dimers very similar to that described above. The apo structure of all four subunits is most like that of the B subunit of the E. coli enzyme (i.e., the more closed form). Using a cutoff of 1.0 Å, only 78 Cα atoms of the A molecule of the Pyrococcus enzyme match with an rmsd of 0.60 Å to the A subunit of E. coli (all matching residues in the large C-terminal domain). For the B subunit of the E. coli enzyme, 144 Cα atoms match with an rmsd of 0.56 Å, the most notable difference being a slight shift in helix α5. Of the five insertion/deletions in the archaeal sequence, only one has potential catalytic significance. An insertion in the β10/β11 loop brings it close to the active site of the other subunit in each dimer-like pair. Mutational evidence, however, suggests that this insertion does not have any consequences for the reaction [6].
The Protein Data Bank (PDB) [10] was searched for other similar structures using the DALI server [11]. The best match for the A molecule of RpiA was obtained for the B chain of glutaconate coenzyme A transferase (PDB ID code 1POI), with a Z-score of 7.0. An rmsd of 3.0 Å was calculated using 130 equivalent Cα atoms; these residues had 8% sequence identity. Alcohol dehydrogenase shows a similar Z-score of 6.0 for the A chain of RpiA (PDB ID code 1OHX; rmsd 2.9 Å for 109 equivalent Cα atoms, with 10% sequence identity). For the B molecule of RpiA, glutaconate coenzyme A transferase was again most similar, while the second highest score was for glucosamine-6-phosphate deaminase, with a Z-score of 5.9 (PDB ID code 1DEA; rmsd 3.5 Å for 123 equivalent Cα atoms, with 11% sequence identity). A number of other hits confirmed that the N-terminal regions of RpiA have structural similarity (although little sequence relationship) to portions of other enzymes. The similar region corresponds to sheets A and B of RpiA together with helices α1–α4. The connectivity between equivalent secondary structural elements is conserved, except for β15 of RpiA. These structural similarities had not been detected based on sequence alone.
The Active Site
The structure of E. coli RpiA in complex with the inhibitor arabinose-5-phosphate was solved by molecular replacement and refined at 1.25 Å resolution (Tables 1 and 2). The inhibitor (Ki 2.1 ± 0.9 mM) binds in the groove, surrounded by highly conserved residues (Figure 6A). Clear electron density in both subunits indicates that the sugar binds as the β-furanose most common for ribose-5-phosphate in solution (Figure 6B). The A molecule of the dimer has changed conformation, that is, the active sites of both subunits now represent the closed form seen for the B molecule in the apo structure. The interactions between the inhibitor and protein are the same in both subunits (summarized in Figure 6C). O1 in the β-anomer is within hydrogen-bonding distance of the side chains of Asp81 and Lys94, as well as the main chain carbonyl oxygen of Thr28. The α-anomer could possibly be bound as an alternative substrate via similar interactions with Glu103 and/or Thr28; however, this anomer was not observed in the electron density. The O2 hydroxyl group also interacts with Lys94, but makes additional interactions with the side chain of Glu103, and 95-N; residues 98 and 99 are somewhat disordered in both subunits, which may reflect nonoptimal interactions of their main chain atoms with O2 of the inhibitor. In the ribose substrate, C2 has the opposite configuration, which is expected to place the hydrogen to be extracted close to Glu103; this may also improve interactions with the β6/α4 loop. Both factors probably disfavor use of arabinose-5-phosphate as a substrate. O3 interacts with Asp84 and 96-N. Neither O4 nor O5 makes hydrogen bonds with the protein. The phosphate group interacts with Lys7, Ser30, Thr31, and Lys121; the two lysines are supported by the highly conserved Asp118. The main chain nitrogen atoms of residues 30 and 31 (at the N-terminal end of α2) also participate in direct binding to the phosphate group.
Site-directed mutations of spinach RpiA [2] had targeted four residues that are absolutely conserved within the family. Three, the equivalents of E. coli residues Asp81, Asp84, and Lys94, were directly implicated in catalysis. Of these, Asp81 was most important: kcat for an alanine mutant was decreased by 10,000-fold, with no measurable effect on Km. Activity of an alanine mutant at Asp84 was decreased by 250-fold, with little change in Km. An alanine mutant at Lys94 had a 1500-fold lower kcat than the wild-type, but Km was increased by a factor of seven, suggesting that some other aspects of the enzyme were compromised. These three residues are in direct contact with the inhibitor, and presumably, the substrate. Substantial activity remained when the equivalent of Glu85 was mutated. This residue lies outside the active site groove, and appears to have a role in the structure, rather than the function, of RpiA. The structure suggested that a different conserved residue, Glu103, is likely to be involved in acid-base catalysis. The involvement of this residue has been confirmed by studies with spinach RpiA (C.E.A. et al., unpublished data): mutation at this position generates an inactive enzyme. Nearby residues in the sequence, Gly82, Ala83, Gly95, and Gly97, are conserved for structural reasons.
Because the properties of the sugar substrate near C1 and C2 change considerably during the reaction, strong recognition of the phosphate is probably essential. That the phosphate is a significant factor in binding is demonstrated by comparison of the Kis of various inhibitors [2, 12]. D-erythrose binds weakly with a Ki > 10 mM, while D-erythrose-4-phosphate is a good inhibitor (Ki 0.67 mM). D-erythronic acid is a good inhibitor (Ki 0.32 mM), but D-4-phosphoerythronic acid is much better (Ki 0.004 mM). Phosphate itself does inhibit, although not strongly (Ki 8 mM). RpiA also acts on D-ribose-5-diphosphate and D-ribose-5-triphosphate as substrates, a property that can be explained simply by extending the sugar further at the phosphate end; there is sufficient room in the structure to allow a longer substrate. Lys7 is present in all but one of the known sequences in the RpiA family. A G(hydrophobic)G(T/S)G(S/T)T motif beginning at residue 25 of the E. coli sequence is also very highly conserved. This motif includes β1, the N-terminal end of α2, and the loop that connects them. Gly25 and Val26 are part of the hydrophobic core of the protein, while a side chain at the position of Gly27 would generate steric clashes with Asp81 and Glu103. Thr28 helps position the loop that follows, via a local hydrogen-bonding network with Ser52, Ser53, and Ser56, as well as the main chain carbonyl oxygen of residue 27. These serines are highly conserved, being replaced only by threonine or a smaller side chain in other sequences. Gly29 is absolutely conserved, both because of its conformation and because the presence of a side chain here would block the binding site. Ser30 and Thr31, which participate directly in binding the phosphate, are also extremely well conserved. Another conserved amino acid, Asp118, interacts with both lysines. Together, residues 7, 25–31,118, and 121 provide a signature for the phosphate binding site of the RpiA family.
There are two catalytic sites per dimer, each of which is composed of residues drawn from a single subunit. There is no suggestion of allosteric behavior of RpiA in either our own or previously published data, although the observed structural differences indicate that regulation of RpiA's activity could be achieved in this way. The dimer interface appears to be rather rigid, and there is no obvious means of communication between the active sites.
The structures of the archaeal RpiA alone and in complex with D-4-phosphoerythronic acid [6] provide complementary information to our E. coli structures. The complex of the archaeal enzyme crystallized in the same conformation and the same P212121 unit cell as its corresponding apo form, with an rmsd of 0.25 Å for 896 matching Cα atoms (out of 916, using a 0.7 Å cutoff). This complex is thus also a closed form, most similar to the B molecule of the E. coli apo enzyme. The similarities strongly suggest that these closed forms represent the most important ones for catalysis. It is not, however, possible to be as confident that the open form of the E. coli apo A molecule is that predominating in the absence of substrate: both this and the more closed version seen for the archaeal apo enzyme could be selected by crystal packing. The position of the phosphate group of D-4-phosphoerythronic acid is essentially identical to that seen in the arabinose-5-phosphate complex of the E. coli enzyme. The rest of the ligand has a different chemical structure and binds somewhat differently, although the resulting arrangement does place the carboxylate group at a position equivalent to C2/O2 in the E. coli structure. This suggests that this is indeed a good environment for stabilization of the negatively charged enediolate intermediate.
As for many α/β enzymes with a parallel sheet, the active site of RpiA lies at the C-terminal end of that sheet (A, in the present case). Substrate/coenzymes are bound in a roughly equivalent position in the coenzyme A transferases and dehydrogenases, although no other functional similarities are apparent. A comparison to glucosamine-6-phosphate deaminase is more informative. Using a 3.8 Å cutoff in the structural alignment, RpiA was found to have a core of 66 Cα atoms that match the complex of the deaminase and the substrate of its back reaction, fructose-6-phosphate (PDB ID code 1FQO; Figure 7), with an rmsd of 2.0 Å and 15% sequence identity. The catalytic residues of the deaminase (Asp72 and His143) are not conserved and are not located within the same secondary structural elements as their counterparts in RpiA; this end of the active site is very different. In contrast, the end of the site that binds the phosphate group of the substrate is highly reminiscent of that found in RpiA. The structural setting is the same, and several key residues, notably those equivalent to Gly29, Thr31, and Lys121, are conserved. Given that the phosphate site is related, it is reasonable that the other end of the active site must be redesigned to deal with the longer six-carbon sugar, as well as different catalytic needs.
Figure 7. Comparison with Glucosamine-6-Phosphate Deaminase.
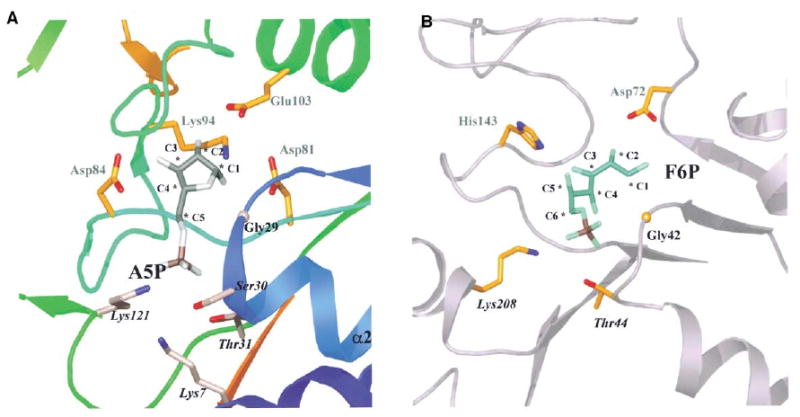
(A) Close-up of the RpiA active site. The protein structure is shown as a ribbon using the rainbow coloring introduced in Figure 4. The inhibitor is gray, with a plum-colored phosphate atom; carbon atoms are numbered. Catalytic residues suggested by site-directed mutations or by location within the structure have gold carbon atoms in a ball-and-stick representation, and are labeled with plain gray text. Carbon atoms of residues of the phosphate binding site (labeled in black italics) are lilac.
(B) Close-up of the active site of glucosamine-6-phosphate deaminase. The view of the enzyme is similar to that used for RpiA in (A). The bound ligand in this case (carbons are numbered) is fructose-6-phosphate, the substrate for the back reaction. The main catalytic residues, Asp72 and His143, are labeled in plain gray text, and residues of the phosphate binding site that have a similar function in RpiA are shown with black italics.
Catalytic Mechanism
It is reasonable to suggest that the substrate will first dock into an open form of RpiA, probably resembling the A subunit of the E. coli apo enzyme described here. This form allows good access of the substrate to the active site. Closing of the protein as observed in the B molecule (and both molecules of the complex structure) would effectively shield the substrate under the β6/α4 loop during the reaction. Allosteric transitions, that is, closing of some sort of lid, are a key element in the catalytic cycle of many other enzymes, including ones that are structurally related (such as glucosamine-6-phosphate deaminase) as well as ones with similar catalytic needs (such as triose phosphate isomerase).
Based on the available data, we propose the catalytic scenario shown in Figure 8. In theory, ribose-5-phosphate could bind as a linear aldose or as a five-membered ring (furanose) form. The open chain form is quite rare in solution (<0.5%), and there is previous kinetic evidence that the enzyme must bind to the furanose (summarized in [2]). Our structure with the very similar inhibitor, arabinose-5-phosphate, shows how RpiA recognizes the furanose sugar, and further suggests that Asp81 will assist in subsequent ring opening by accepting a proton from the hydroxyl group at O1. Such assistance has long been discussed for enzymes catalyzing similar chemistry [13], an idea that is supported by structures of glucosamine-6-phosphate deaminase, as well as other unrelated isomerases, such as phosphoglucose isomerase [14]. The most likely proton donor for this step is water; there is good access to solvent on the appropriate face of O4.
Figure 8. Proposed Mechanism for RpiA Catalysis.

The two main stages of the catalytic reaction, ring opening and isomerization, are shown together with the groups of the enzyme believed to be important, as described in the text.
Once the ring is opened, the phosphate is likely to remain in the same position, and the hydroxyl group then found at O4 will find a good opportunity for hydrogen bonding with the main chain carbonyl oxygen of residue 28. The portions of the substrates near O1 and O2, however, must rearrange only slightly to accommodate the chemical changes. Mutagenesis results and location suggest that Glu103 will be the essential catalytic base, and that Asp81 will return its proton to the substrate in the next step of catalysis. The separation of the critical atoms of these two residues is very similar (∼3.5 Å) to that between, for example, the catalytic glutamate and histidine atoms in triose phosphate isomerase (e.g., PDB ID code 3TIM) [15]. Lys94 is well situated to help stabilize the enediol(ate) intermediate, as proposed for a lysine residue of TIM. This conclusion is further supported by the structure of the archaeal enzyme with D-4-phosphoerythronic acid, as the carboxylate group of the inhibitor lies in the expected position near Lys94. At present, the catalytic role of Asp84 is not clear, although it may lie in assisting correct orientation in the transition state.
Biological Implications
Together, ribose-5-phosphate isomerases, ribokinase, and transketolase provide the only means of securing ribose-5-phosphate for nucleotide and cofactor synthesis. RpiA is also an essential part of the Calvin cycle of plants. Equivalent and highly conserved enzymes have been identified in all species inspected to date, consistent with their vital roles in central metabolism. The structures of ribokinase [16] and transketolase [17] were reported previously. Our present results show that the catalytic regions of RpiA are derived from an ancestral fold that diverged early to serve different biochemical functions, such as deamination. High sequence conservation among members of the RpiA subfamily implies that later there was strong evolutionary pressure to preserve this particular structure.
The E. coli RpiA structures have given us a much deeper understanding of its function, identifying active site residues and suggesting how conformational changes may be important in its mechanism. Such studies will allow us to pursue the design of specific inhibitors, which can be useful for slowing down cell growth and division when demands on the ribose supply are high, such as in the cancer cell.
RpiA also provides an interesting comparison with ribokinase and the ribose binding protein, two other proteins that act on ribose sugars. Each uses a particular form, as dictated by its own functional needs. The ribose binding protein binds to the most common form in solution, the six-membered pyranose ring, an obvious advantage if the sugar is to be gathered efficiently from the surroundings. Ribokinase selects another common species, the five-membered furanose ring, as O5 is in that case available for phosphorylation. In contrast, the chemistry to be performed by RpiA at C1 and C2 requires the open chain form, which is much less abundant. Therefore, the enzyme binds first to the furanose, which is then opened prior to the isomerization reaction.
Experimental Procedures
Sample Preparation
The ORF of RpiA was amplified by PCR from E. coli DH5α genomic DNA. The gene was cloned into the NdeI and BamHI sites of a modified form of pET15b (Novagen), in which a TEV protease cleavage site replaced the thrombin cleavage site, and a double stop codon was introduced downstream from the BamHI site. This construct provides for an N-terminal His6 tag separated from the protein by a TEV protease recognition site (ENLYFQ↓G). The fusion protein was overexpressed in E. coli BL21-Gold(DE3) (Stratagene), which harbors an extra plasmid encoding three rare tRNAs (AGG and AGA for Arg, ATA for Ile). The cells were grown in LB at 37°C to an OD600 ∼0.6 and expression was induced with 0.4 mM IPTG. Growth was continued at 15°C overnight, after which the cells were harvested, resuspended in binding buffer (500 mM NaCl, 5% glycerol, 50 mM HEPES [pH 7.5], 5 mM imidazole), flash-frozen in liquid N2, and stored at −70°C. The thawed cells were broken by sonication after the addition of 0.5% NP-40 and 1 mM each of PMSF and benzamidine. The lysate was clarified by centrifugation (30 min at 17,000 rpm; Beckman Coulter Avanti J-25 centrifuge) and passed through a DE52 column preequilibrated in binding buffer. The flow-through fraction was then applied to a metal chelate affinity column charged with Ni2+ (QIAGEN). After the column was washed, the protein was eluted from the column in elution buffer (binding buffer with 500 mM imidazole) and dialyzed into binding buffer, and the tag was cleaved from the protein by treatment with recombinant His-tagged TEV protease. The cleaved protein was then resolved from the cleaved His tag and the His-tagged protease by passing the mixture through a second Ni2+ column. The RpiA protein was dialyzed against 10 mM HEPES (pH 7.5), 500 mM NaCl and then concentrated using a BioMax concentrator (Millipore).
For the preparation of the seleno-methionine (Se-Met)-enriched protein, RpiA was expressed in the methionine auxotroph strain E. coli B834(DE3) (Novagen) in supplemented M9 media at 150 rpm. The sample was prepared under the same conditions as the native protein except for the addition of 5 mM β-mercaptoethanol to the purification buffers.
Assays
The ketose, ribulose-5-phosphate, absorbs UV light at 290 nm, which provides the basis for a direct spectrophotometric assay [18]. Reaction mixtures typically contained 2.2 or 4.4 nM enzyme in a buffer of 50 mM Tris-HCl (pH 7.5). After addition of enzyme to initiate the reaction, the increase in absorbance was measured at 37°C. Ribose-5-phosphate (Fluka) concentrations covered the range from one-tenth to ten times the Km. Arabinose-5-phosphate (Sigma) was tested at various substrate concentrations, at concentrations up to 3 mM. All kinetic parameters were calculated from Hanes-Woolf plots (i.e., [S]/v versus [S]).
Crystallization, Data Collection, and Processing
Any particulate matter was removed from the samples by passage through a 0.2 μm Nanosep MF centrifugal filtration device (Pall-Gelman). The apo protein was crystallized by vapor diffusion in hanging drops: 2 μl protein (15 mg/ml by Bradford assay; BioRad) were mixed with 2 μl of a reservoir solution containing 0.2 M magnesium chloride, 0.1 M Tris-HCl (pH 8.5), 30% PEG 4000; crystals were obtained in 2–5 days at 21°C. For the inhibitor complex, 2 μl of a solution containing 7 mg/ml protein and 20 mM arabinose-5-phosphate were mixed with 2 μl of a reservoir solution including 0.2 M magnesium chloride, 0.1 M Tris-HCl (pH 8.4), 30%–35% PEG 4000. The drops were left to equilibrate for 2 days and then streak-seeded using an acupuncture needle. For diffraction studies, the crystals were flash-frozen with the crystallization buffer plus 20% ethylene glycol (and 10 mM arabinose-5-phosphate, for the inhibitor structure).
Diffraction data for the apo form were collected at 100K at the 19BM beamline of the Structural Biology Center at the Advanced Photon Source, Argonne National Laboratory. The absorption edge was determined by fluorescent scan of the crystal as described previously [19]. The three-wavelength MAD data (peak, 0.9777 Å; inflection point, 0.9779 Å; high remote, 0.95374 Å) were collected from a Se-Met-substituted protein crystal using an inverse-beam strategy. One crystal was used to collect all MAD data sets up to 1.5 Å resolution, with 2 s exposure/frame, 100 mm crystal-to-detector distance, and 1° oscillation up to 170° using a modified HKL2000 data collection strategy [20]. Data were processed and scaled using HKL2000; statistics are summarized in Table 1. Diffraction data for the inhibitor complex were collected at 100K at beamline ID14-EH1, ESRF, Grenoble, France. A total of 360° of data was collected with an oscillation of 0.5°/frame. These data were processed with MOSFLM and SCALA (as implemented in the CCP4 program suite) [21]; statistics are summarized in Table 1.
Structure Determination and Refinement
For the apo form, all crystallographic procedures including Patterson searches, MAD phasing, density modification, initial map calculation, and structure refinement were carried out using the CNS suite [22]. Electron density maps of the Se-Met-labeled enzyme (phased using six Se-Met/molecule, two molecules/AU) at 1.5 Å resolution were of high quality (Figure 3) and allowed autotracing of the amino acid chain using the program wARP [23]. This procedure provided an initial model containing 205 out of 219 amino acid residues. The structure was then refined to the same resolution against the remote data (redundancy 5.2), using the experimental (MAD) phases as restraints throughout (refinement target: mlhl). Subsequent manual adjustment was carried out using QUANTA (Accelrys). A total of 660 water molecules were added using the program Waterpick in the CNS suite. The final R factor was 22.6% and the Rfree was 23.9% with all the data included (Table 2). Well-defined electron density was observed for all residues from 2 to 219 of both molecules in the asymmetric unit. The stereochemistry of the structure was assessed with PROCHECK [24]; a stringent boundary Ramachandran plot [25] shows no residues outside the allowed regions.
The complex structure was solved with the molecular replacement program MOLREP [26], using molecule A of the apo form as the search model. After checking that the top two solutions did indeed correspond to the correct dimer, rigid body refinement was carried out in REFMAC5 [27]. The calculated phases were then used together with the observed structure factor amplitudes in autotracing with ARP/wARP [23]. After the initial cycles, 316 residues out of 436 had been autobuilt (connectivity index 0.90); the automatic process eventually converged after tracing 339 residues out of 436 (connectivity index 0.94). Side chains were also docked automatically, although one segment in molecule A required manual correction. One of the subunits (corresponding to molecule B in the apo structure, i.e., the more closed one) showed substantially better electron density in the initial maps. Arabinose-5-phosphate (as the β-furanose) could be built into very clear electron density in the active site B (Figure 6). Many segments of molecule A were not well defined in the early density. Although this active site obviously contained ligand, it was not at this stage as convincing as that in molecule B, so waters were initially placed as rough markers of position only. As the models/phases improved, the electron density in this site eventually became as good as that in site B, and so allowed ligand to be placed there with confidence. Water molecules were picked automatically using ARP/wARP, and refinement of TLS parameters was performed during the later cycles. At the conclusion of refinement, all residues of molecule B were clear with the exception of 1, 18–21, 98, and 219. The model of molecule A excluded residues 1–22, 32–46, 56–67, 98, and 219; although density was present for these segments, they could not be modeled as a single conformation. All three of the larger segments lie together on the protein surface at a major crystal-packing interface. The explanation for the poorer density here thus almost certainly lies in the conflicting demands made in closing the protein around the ligand while maintaining crystal contacts. However, the active site regions were very clearly defined in both molecules.
Analysis of the Final Structures
Surface accessibility calculations were carried out using the algorithm of Lee and Richards [28], using a probe radius of 1.4 Å. The dimer contact surface was analyzed using a web-based server available at http://www.biochem.ucl.ac.uk/bsm/PP/server/index.html [8]. Structures were compared using the brute and imp options of the program LSQMAN [29, 30], and with the graphics program O [31]. Similar structures were sought using the DALI server [11], TOP [32], DEJAVU, and hidden Markov models [33]. Figures were prepared with O and OPLOT [34], Molray [35], LIGPLOT [36], and Canvas (Deneba Systems).
Acknowledgments
We wish to thank all members of the Structural Biology Center at Argonne National Laboratory for their help in conducting experiments, Dr. Roman Laskowski for help with CATH analysis, and Lindy Keller for help in preparation of this manuscript. This work was supported by National Institutes of Health grant GM62414-01, the Ontario Research and Development Challenge Fund, and the U.S. Department of Energy, Office of Biological and Environmental Research under contract W-31-109-Eng-38. C.H.A. and A.M.E. are CIHR Scientists. S.L.M. and C.E.A. were supported by the Swedish Natural Science Research Council and by Uppsala University. The submitted manuscript has been created by the University of Chicago as Operator of Argonne National Laboratory (“Argonne”) under contract W-31-109-ENG-38 with the U.S. Department of Energy. The U.S. government retains for itself, and others acting on its behalf, a paid-up, nonexclusive, irrevocable worldwide license in said article to reproduce, prepare derivative works, distribute copies to the public, and perform publicly and display publicly, by or on behalf of the government.
Footnotes
Accession Numbers: Atomic coordinates have been deposited in the Protein Data Bank [10] under ID codes 1KS2 (RCSB-ID of RCSB015282) for the apo form, and 1O8B for the complex.
References
- 1.Knowles FC, Pon NG. Improved Sephadex procedures for buffer exchange of ribosephosphate isomerase. Anal Biochem. 1968;24:305–313. doi: 10.1016/0003-2697(68)90184-x. [DOI] [PubMed] [Google Scholar]
- 2.Jung CH, Hartman FC, Lu TY, Larimer FW. D-ribose-5-phosphate isomerase from spinach: heterologous overexpression, purification, characterization, and site-directed mutagenesis of the recombinant enzyme. Arch Biochem Biophys. 2000;373:409–417. doi: 10.1006/abbi.1999.1554. [DOI] [PubMed] [Google Scholar]
- 3.Fersht A. Structure and Mechanism in Protein Science. New York: W.H. Freeman and Company; 1999. [Google Scholar]
- 4.Sorensen KI, Hove-Jensen B. Ribose catabolism of Escherichia coli: characterization of the rpiB gene encoding ribose phosphate isomerase B and of the rpiR gene, which is involved in regulation of rpiB expression. J Bacteriol. 1996;178:1003–1011. doi: 10.1128/jb.178.4.1003-1011.1996. [DOI] [PMC free article] [PubMed] [Google Scholar]
- 5.Essenberg MK, Cooper RA. Two ribose-5-phosphate isomerases from Escherichia coli K12: partial characterisation of the enzymes and consideration of their possible physiological roles. Eur J Biochem. 1975;55:323–332. doi: 10.1111/j.1432-1033.1975.tb02166.x. [DOI] [PubMed] [Google Scholar]
- 6.Ishikawa K, Matsui I, Payan F, Cambillau C, Ishida H, Kawarabayasi Y, Kikuchi H, Roussel A. A hyperthermostable D-ribose-5-phosphate isomerase from Pyrococcus horikoshii characterization and three-dimensional structure. Structure. 2002;10:877–886. doi: 10.1016/s0969-2126(02)00779-7. [DOI] [PubMed] [Google Scholar]
- 7.Hove-Jensen B, Maigaard M. Escherichia coli rpiA gene encoding ribose phosphate isomerase A. J Bacteriol. 1993;175:5628–5635. doi: 10.1128/jb.175.17.5628-5635.1993. [DOI] [PMC free article] [PubMed] [Google Scholar]
- 8.Jones S, Thornton JM. Principles of protein-protein interactions. Proc Natl Acad Sci USA. 1996;93:13–20. doi: 10.1073/pnas.93.1.13. [DOI] [PMC free article] [PubMed] [Google Scholar]
- 9.Rutner AC. Spinach 5-phosphoribose isomerase. Purification and properties of the enzyme. Biochemistry. 1970;9:178–184. doi: 10.1021/bi00803a023. [DOI] [PubMed] [Google Scholar]
- 10.Berman HM, Westbrook J, Feng Z, Gilliland G, Bhat TN, Weissig H, Shindyalov IN, Bourne PE. The Protein Data Bank. Nucleic Acids Res. 2000;28:235–242. doi: 10.1093/nar/28.1.235. [DOI] [PMC free article] [PubMed] [Google Scholar]
- 11.Holm L, Sander C. Protein structure comparison by alignment of distance matrices. J Mol Biol. 1993;233:123–138. doi: 10.1006/jmbi.1993.1489. [DOI] [PubMed] [Google Scholar]
- 12.Woodruff WW, III, Wolfenden R. Inhibition of ribose-5-phosphate isomerase by 4-phosphoerythronate. J Biol Chem. 1979;254:5866–5867. [PubMed] [Google Scholar]
- 13.Walsh C. Enzymatic Reaction Mechanisms. New York: W.H. Freeman; 1979. [Google Scholar]
- 14.Lee JH, Chang KZ, Patel V, Jeffery CJ. Crystal structure of rabbit phosphoglucose isomerase complexed with its substrate D-fructose 6-phosphate. Biochemistry. 2001;40:7799–7805. doi: 10.1021/bi002916o. [DOI] [PubMed] [Google Scholar]
- 15.Komives EA, Chang LC, Lolis E, Tilton RF, Petsko GA, Knowles JR. Electrophilic catalysis in triosephosphate isomerase: the role of histidine-95. Biochemistry. 1991;30:3011–3019. doi: 10.1021/bi00226a005. [DOI] [PubMed] [Google Scholar]
- 16.Sigrell JA, Cameron AD, Jones TA, Mowbray SL. Structure of Escherichia coli ribokinase in complex with ribose and dinucleotide determined to 1.8 Å resolution: insights into a new family of kinase structures. Structure. 1998;6:183–193. doi: 10.1016/s0969-2126(98)00020-3. [DOI] [PubMed] [Google Scholar]
- 17.Lindqvist Y, Schneider G, Ermler U, Sundstrom M. Three-dimensional structure of transketolase, a thiamine diphosphate dependent enzyme, at 2.5 Å resolution. EMBO J. 1992;11:2373–2379. doi: 10.1002/j.1460-2075.1992.tb05301.x. [DOI] [PMC free article] [PubMed] [Google Scholar]
- 18.Wood T. Spectrophotometric assay for D-ribose-5-phosphateketol-isomerase and for D-ribulose-5-phosphate 3-epimerase. Anal Biochem. 1970;33:297–306. doi: 10.1016/0003-2697(70)90300-3. [DOI] [PubMed] [Google Scholar]
- 19.Walsh MA, Dementieva I, Evans G, Sanishvili R, Joachimiak A. Taking MAD to the extreme: ultrafast protein structure determination. Acta Crystallogr D Biol Crystallogr. 1999;55:1168–1173. doi: 10.1107/s0907444999003698. [DOI] [PubMed] [Google Scholar]
- 20.Otwinowski Z, Minor W. Processing of X-ray diffraction data collected in oscillation mode. Methods Enzymol. 1997;276:307–326. doi: 10.1016/S0076-6879(97)76066-X. [DOI] [PubMed] [Google Scholar]
- 21.CCP4 (Collaborative Computational Project 4) The CCP4 suite: programs for protein crystallography. Acta Crystallogr. 1994;D50:760–763. doi: 10.1107/S0907444994003112. [DOI] [PubMed] [Google Scholar]
- 22.Brünger AT, Adams PD, Clore GM, DeLano WL, Gros P, Grosse-Kunstleve RW, Jiang JS, Kuszewski J, Nilges M, Pannu NS, et al. Crystallography and NMR system (CNS): a new software suite for macromolecular structure determination. Acta Crystallogr. 1998;D54:905–921. doi: 10.1107/s0907444998003254. [DOI] [PubMed] [Google Scholar]
- 23.Perrakis A, Sixma TK, Wilson KS, Lamzin VS. wARP: improvement and extension of crystallographic phases by weighted averaging of multiple-refined dummy atomic models. Acta Crystallogr. 1997;D53:448–455. doi: 10.1107/S0907444997005696. [DOI] [PubMed] [Google Scholar]
- 24.Laskowski RA, MacArthur MV, Moss DS, Thornton JM. PROCHECK: a program to check the stereochemical quality of protein structures. J Appl Crystallogr. 1993;26:283–291. [Google Scholar]
- 25.Kleywegt GJ, Jones TA. Phi/psi-cology: Ramachandran revisited. Structure. 1996;4:1395–1400. doi: 10.1016/s0969-2126(96)00147-5. [DOI] [PubMed] [Google Scholar]
- 26.Vagin A, Teplyakov A. MOLREP: an automated program for molecular replacement. J Appl Crystallogr. 1997;30:1022–1025. [Google Scholar]
- 27.Murshudov GN, Vagin AA, Dodson EJ. Refinement of macromolecular structures by the maximum-likelihood method. Acta Crystallogr. 1997;D53:240–255. doi: 10.1107/S0907444996012255. [DOI] [PubMed] [Google Scholar]
- 28.Lee B, Richards FM. The interpretation of protein structures: estimation of static accessibility. J Mol Biol. 1971;55:379–400. doi: 10.1016/0022-2836(71)90324-x. [DOI] [PubMed] [Google Scholar]
- 29.Kleywegt GJ. Use of non-crystallographic symmetry in protein structure refinement. Acta Crystallogr. 1996;D52:842–857. doi: 10.1107/S0907444995016477. [DOI] [PubMed] [Google Scholar]
- 30.Kleywegt GJ, Jones TA. Detecting folding motifs and similarities in protein structures. Methods Enzymol. 1997;277:525–545. doi: 10.1016/s0076-6879(97)77029-0. [DOI] [PubMed] [Google Scholar]
- 31.Jones TA, Zou JY, Cowan SW, Kjeldgaard M. Improved methods for building protein models in electron density maps and the location of errors in these models. Acta Crystallogr. 1991;A47:110–119. doi: 10.1107/s0108767390010224. [DOI] [PubMed] [Google Scholar]
- 32.Lu G. TOP: a new method for protein structure comparisons and similarity searches. J Appl Crystallogr. 2000;33:176–183. [Google Scholar]
- 33.Karplus K, Barrett C, Hughey R. Hidden Markov models for detecting remote protein homologies. Bioinformatics. 1998;14:846–856. doi: 10.1093/bioinformatics/14.10.846. [DOI] [PubMed] [Google Scholar]
- 34.Jones TA, Kjeldgaard MO. Electron-density map interpretation. Methods Enzymol. 1997;277:173–208. doi: 10.1016/s0076-6879(97)77012-5. [DOI] [PubMed] [Google Scholar]
- 35.Harris M, Jones TA. Molray—a web interface between O and the POV-Ray ray tracer. Acta Crystallogr. 2001;D57:1201–1203. doi: 10.1107/s0907444901007697. [DOI] [PubMed] [Google Scholar]
- 36.Wallace AC, Laskowski RA, Thornton JM. LIG-PLOT: a program to generate schematic diagrams of protein-ligand interactions. Protein Eng. 1995;8:127–134. doi: 10.1093/protein/8.2.127. [DOI] [PubMed] [Google Scholar]