Introduction
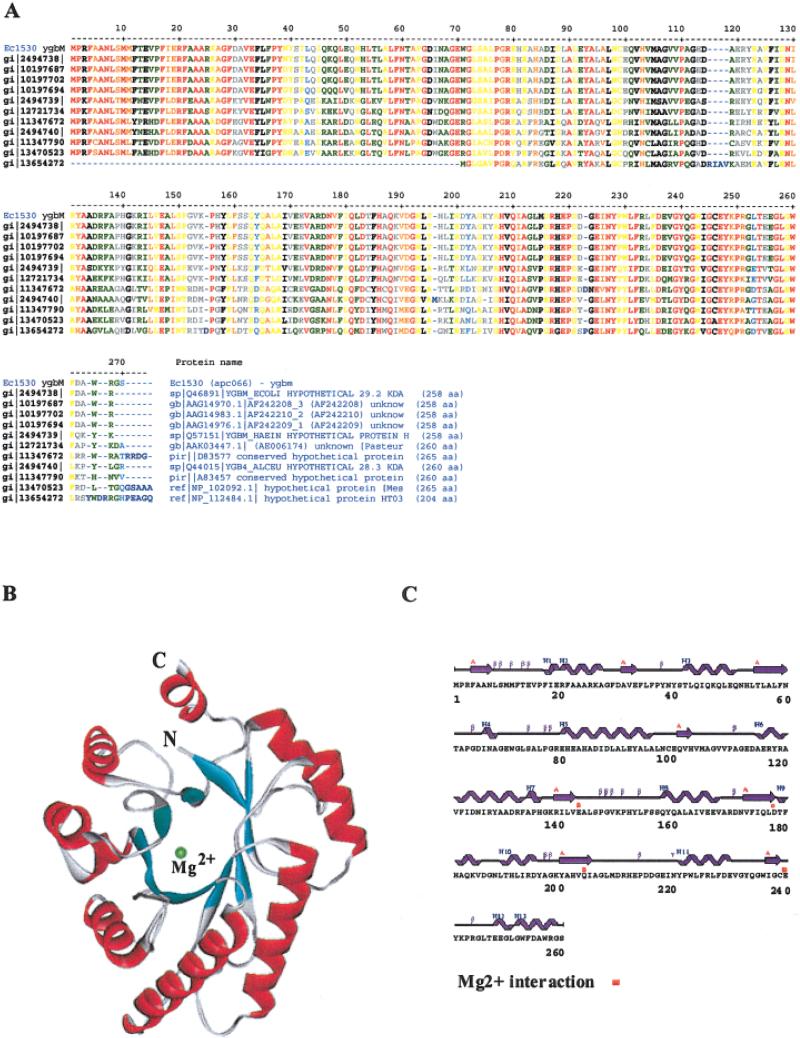
The crystal structure of YgbM (EC1530) (Fig. 1), a glyoxylate induced protein from Escherichia coli, has been determined and refined to 1.63 Å by multiple-wavelength anomalous dispersion (MAD) method. YgbM is encoded by DNA bases 2862259–2863035 and belongs to a protein family of Pfam-B_7694.1 The gene is clustered with MutS (DNA mismatch repair protein), serine/threonine protein phosphatase, glycerol-3-phosphate regulon repressor, 3-hydroxyisobutyrate dehydrogenase, l-fuculose phosphate aldolase, gluconate permease, Rpos (RNA polymerase sigma factor), Nlpd (lipoprotein Nlpd), Pcm (protein-l-isoaspartate o-methyltransferase), SurE (stationary phase survival protein).
Fig. 1.
A: Protein sequences are compared between different species. B: The ribbon drawing shows the TIM structure of EC1530. α-helices, outside of the barrel, are shown in red, β-strands, inside of the barrel in cyan, and one of two Mg2+ (the major site) in the barrel is shown in green. The Mg2+ in the minor site located on the outside surface is not shown. C: The secondary elements were indicated above the one-letter amino acid codes of E. coli ygbM. Residues interacting with Mg2+ are also indicated in red dots.
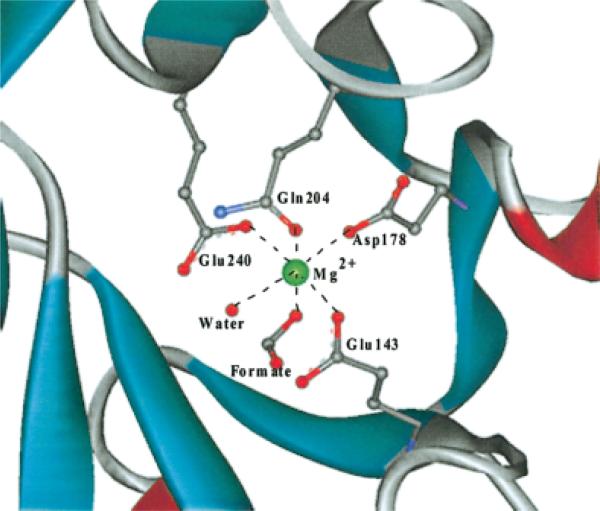
The Se-Met derivative of YgbM crystallized in the C2 space group with unit cell dimensions of a = 104.907 Å, b = 74.368 Å, c = 39.376 Å, β = 98.81°. There is one 258-residue protein per asymmetric unit. This structure adopts the common TIM (triosephosphate isomerase) barrel (β/α)8, in which an eight-membered cylindrical β-sheet is surrounded by eight helices.2 Similar to other TIM barrel structures, all of the turns between the α-helices and the subsequent β-strands at the N-terminal end of the barrel are composed of only three or four residues, whereas the corresponding loops at the C-terminal end are longer and form a part of the potential active site. Inside of the TIM barrel, several hydrophilic side-chains from the C-terminal loops as well as two well-ordered water molecules coordinate to a Mg2+, presumably forming an active site (Fig. 2). As expected, a Dali search3 found several structures with relatively high similarity, which include 4XIS, 1A0C-A, 1QUM-A, 1DE5, and 1BYB with Z scores higher than 10. Further biochemical and structural analyses are in progress.
Fig. 2.
Putative catalytic site including Mg2+ (major site) is shown. The Mg2+ is coordinated to an ordered water molecule, a formate, two glutamate, a glutamine, aspartate residues forming a square-bi-pyramid conformation.
Materials and Methods
Protein Cloning Expression and Purification. The ORF of ygbM was amplified by PCR from E. coli genomic DNA (ATCC). The gene was cloned into the NdeI and BamHI sites of a modified pET15b cloning vector (Novagen) in which the TEV protease cleavage site replaced the thrombin cleavage site and a double-stop codon was introduced downstream from the BamHI site. This construct provides for an N-terminal hexa-histidine tag separated from the gene by a TEV protease recognition site (ENLYFQ↓G). The fusion protein was overexpressed in E. coli BL21-Gold (DE3) (Stratagene) harboring an extra plasmid encoding three rare tRNAs (AGG and AGA for Arg, ATA for Ile). The cells were grown in LB at 37°C to an OD600 of approximately 0.6 and protein expression induced with 0.4 mM IPTG. After induction, the cells were incubated overnight with shaking at 15°C. The harvested cells were resuspended in binding buffer (500 mM NaCl, 5% Glycerol, 50 mM HEPES pH 7.5, 5 mM imidazole), flash-frozen in liquid N2, and stored at –70°C. The thawed cells were lysed by sonication after the addition of 0.5% NP-40 and 1 mM each of PMSF and benzamidine. The lysate was clarified by centrifugation (27000g for 30 min) and passed through a DE52 column preequilibrated in binding buffer. The flow-through fraction was then applied to a metal chelate affinity column charged with Ni2+. The hexa-histidine tag was eluted from the column in elution buffer (500 mM NaCl, 5% Glycerol, 50 mM HEPES pH 7.5, 500 mM imidazole), and the tag then cleaved from the protein by treatment with recombinant His-tagged TEV protease. The cleaved protein was then resolved from the cleaved His-tag and the His-tagged protease by flowing the mixture through a second Ni2+-column.
The YgbM protein was dialyzed in 10 mM HEPES, pH 7.5, 500 mM NaCl, and concentrated by using a BioMax concentrator (Millipore). Before crystallization, any particulate matter was removed from the sample by passing through a 0.2-μm Ultrafree-MC centrifugal filter (Millipore). For the preparation of selenomethionine (SeMet) enriched protein, the E. coli YgbM was expressed in the methionine auxotroph strain B834(DE3) of E. coli (Novagen) and purified under the same conditions as the native protein in supplemented M9 media. The reducing reagent β-mercaptoethanol (5 mM) was added to all purification buffers.
Protein crystallization
The protein was crystallized by vapor diffusion in hanging drops by mixing 2 μL of the protein solution (9 mg/mL) with 2 μL of 0.1 M HEPES, pH 7, 5% PEG 8000 and 5% glycerol, and equilibrated at 20°C over 100 μL of this solution. Crystals, which appeared after 3 days, were flash-frozen in liquid nitrogen with crystallization buffer plus 20% glycerol as cryoprotectant before data collection.
Data Collection
Diffraction data were collected at 100 K at the 19ID beamline of the Structural Biology Center at the Advanced Photon Source, Argonne National Laboratory. The three-wavelength inverse-beam MAD data up to 1.63 Å [peak: 12.6620 KeV (0.97946 Å), inflection point: 12.6603 KeV (0.97957 Å), high-energy remote: 13.1000 KeV (0.93927 Å)] were collected from a Se-Met labeled protein crystal. One crystal (0.2 × 0.2 × 0.2 mm) was used to collect at 100 K all data MAD sets to 1.63 Å with 3 s exposure/1°/frame using 150 mm crystal to detector distance. The total oscillation range was 170 degrees as predicted with use of strategy module within HKL2000 suite.4 The space group was C2 with cell dimension of a = 104.907, b = 74.368, c = 39.376, β = 98.81°. All data were processed and scaled with HKL2000 (Table I) to an Rmerge of 7.2%, 7.0%, and 8.0% for inflection point, peak, and remote, respectively.
TABLE I.
Summary of Crystal and MAD Data
| Unit cell | a = 104.907 Å, b = 74.368 Å, c = 39.376 Å, β = 98.81° |
| Space group | C2 |
| MW Da (residues) | 29200(258) |
| Mol (AU) | 1 |
| SeMet (AU) | 4 |
| MAD data collection |
|||||
|---|---|---|---|---|---|
| Edge | Peak | Remote | Parent | ||
| Wavelength (Å) | 0.97957 | 0.97946 | 0.93927 | 0.97946 | |
| Resolution range (Å) | 1.63 | 1.63 | 1.63 | 30–1.63 | (1.69–1.63) |
| No. of unique reflections | 35666 | 35621 | 36010 | 35621 | (2656) |
| Completeness (%) | 95.3 | 95.7 | 97.1 | 95.7 | (70.8) |
| R merge (%) | 6.6 | 7.2 | 6.4 | 7.2 | (26.6) |
Structure Determination and Refinement
The structure was determined by MAD phasing5 using CNS6 and refined to 1.63 Å by using CNS against the averaged peak data. The initial model was built automatically by using ARP/wARP.7 The model was further refined to 1.63 Å. Throughout the model was manually adjusted by using O.8 The final R was 0.194 and the free R of 0.214 with all data (Table 2). Electron density calculated at 1.5 σ is well connected for all the main-chains and most of the side-chains except a few areas on the surface of the molecules. The stereochemistry of the structure was checked with PROCHECK9 and the Ramachandran plot. The main-chain torsion angles for all residues are in allowed regions.
TABLE II.
Crystallographic Statistics
| Phasing | ||||||
|---|---|---|---|---|---|---|
| Resolution range | Inf | Peak | h-Remote | All | ||
| 39–2.4 Å | Fried | Iso | Fried | Iso | Fried | |
| Phasing power | 3.05 | 1.91 | 2.71 | 1.33 | 1.74 | |
| FOM | 0.45 | 0.38 | 0.43 | 0.30 | 0.32 | 0.75 |
| Density modification, FOM (1.8 Å) | 0.96 | |||||
| Refinement | ||||||
| Resolution range (Å) | 39–1.63 | |||||
| No. of reflections | 35198 | |||||
| σ cutoff | 0 | |||||
| R-value | 0.194 | |||||
| Free R-value | 0.214 (4024) | |||||
| RMSD from ideal geometry | ||||||
| Bond length (1–2) (Å) | 0.005 | |||||
| Angle (°) | 1.20 | |||||
| Dihedral (°) | 21.9 | |||||
| Improper (°) | 0.84 | |||||
| Mean B-factor (Å2) | ||||||
| All atoms | 18.70 | |||||
| Protein atoms (2149) | ||||||
| Protein main chain | 16.95 | |||||
| Protein side chain | 15.70 | |||||
| Formate (3) | 12.52 | |||||
| Mg (2) | 8.69 | |||||
| Glycerol (12) | 29.26 | |||||
| Water (272) | 30.76 | |||||
| Ramachandran plot statistics (%) | ||||||
| Residues in most favored regions | 100 | |||||
| Residues in additional allowed regions | 0.0 | |||||
| Residues in disallowed region | 0.0 | |||||
Acknowledgments
We thank all members of the Structural Biology Center at Argonne National Laboratory for their help in conducting experiments and Lindy Keller for help in preparation of this manuscript.
Grant sponsor: National Institutes of Health; Grant number: GM62414-01; Grant sponsor: U.S. Department of Energy, Office of Biological and Environmental Research; Grant number: W-31-109-Eng-38; Grant sponsor: Ontario Research and Development Challenge Fund.
Footnotes
Atomic coordinates have been deposited into the Protein Data Bank (PDB) as 1k77.
REFERENCES
- 1.Bateman A, Birney E, Durbin R, Eddy SR, Howe KL, Sonnhammer EL. The Pfam protein families database. Nucleic Acids Res. 2000;28:263–266. doi: 10.1093/nar/28.1.263. [DOI] [PMC free article] [PubMed] [Google Scholar]
- 2.Wierenga RK. The TIM-barrel fold: a versatile framework for efficient enzymes. FEBS Lett. 2001;492:193–198. doi: 10.1016/s0014-5793(01)02236-0. [DOI] [PubMed] [Google Scholar]
- 3.Holm L, Sander C. Dali: a netwok tool for protein structure comparison. Trends Biochem Sci. 1995;20:478–480. doi: 10.1016/s0968-0004(00)89105-7. [DOI] [PubMed] [Google Scholar]
- 4.Otwinowski Z, Minor W. Processing of x-ray diffraction data collected in oscillation mode. Methods Enzymol. 1997;276:307–326. doi: 10.1016/S0076-6879(97)76066-X. [DOI] [PubMed] [Google Scholar]
- 5.Walsh MA, Dementieva I, Evans G, Sanishvili R, Joachimiak A. Taking MAD to the extreme: ultrafast protein structure determination. Acta Crystallogr. 1999;D55:1168–1173. doi: 10.1107/s0907444999003698. [DOI] [PubMed] [Google Scholar]
- 6.Brunger AT, et al. Crystallography and NMR system: a new software suite for macromolecular structure determination. Acta Crystallogr. 1998;D54:905–921. doi: 10.1107/s0907444998003254. [DOI] [PubMed] [Google Scholar]
- 7.Perrakis A, Morris RJ, Lamzin VS. Automated protein model building combined with iterative structure refinement. Nat Struct Biol. 1999;6:458–463. doi: 10.1038/8263. [DOI] [PubMed] [Google Scholar]
- 8.Jones TA, Zou JY, Cowan SW, Kjeldgaard M. Improved methods for building protein models in electron density maps and the location of errors in these models. Acta Crystallogr. 1991;A47:110–119. doi: 10.1107/s0108767390010224. [DOI] [PubMed] [Google Scholar]
- 9.Laskowski RA, MacArthur MW, Moss DS, Thornton JM. PROCHECK: a program to check the stereochemical quality of protein structures. J Appl Crystallogr. 1993;26:283–291. [Google Scholar]


