

Abstract
Objective
To determine if selected culture conditions enhance the expansion and redifferentiation of chondrocytes isolated from human osteoarthritic cartilage with yields appropriate for creation of constructs for treatment of joint-scale cartilage defects, damage, or osteoarthritis.
Methods
Chondrocytes isolated from osteoarthritic cartilage were analyzed to determine the effects of medium supplement on cell expansion in monolayer and then cell redifferentiation in alginate beads. Expansion was assessed as cell number estimated from DNA, growth rate, and day of maximal growth. Redifferentiation was evaluated quantitatively from proteoglycan and collagen type II content, and qualitatively by histology and immunohistochemistry.
Results
Using either serum or a growth factor cocktail (TFP: transforming growth factor β1, fibroblast growth factor 2, and platelet-derived growth factor type bb), cell growth rate in monolayer was increased to 5.5× that of corresponding conditions without TFP, and cell number increased 100-fold within 17 days. In subsequent alginate bead culture with human serum or transforming growth factor β1 and insulin-transferrin-selenium-linoleic acid-bovine serum albumin, redifferentiation was enhanced with increased proteoglycan and collagen type II production. Effects of human serum were dose dependent, and 5% or higher induced formation of chondron-like structures with abundant proteoglycan-rich matrix.
Conclusion
Chondrocytes from osteoarthritic cartilage can be stimulated to undergo 100-fold expansion and then redifferentiation, suggesting that they may be useful as a cell source for joint-scale cartilage tissue engineering.
Introduction
The treatment of joints affected by osteoarthritis (OA) using tissue engineering presents challenges that are distinct and formidable compared to those for the treatment of focal cartilage defects. OA involves widespread damage to articular cartilage, resulting in decreased joint function and pain.1–3 Cartilage does not undergo effective self-repair because of the limited intrinsic metabolism of chondrocytes or extrinsic influx of reparative cells1,4; therefore, surgical and biological therapies are attractive treatment options. Current therapies for focal cartilage defects include microfracture, osteochondral autografts, and autologous chondrocyte implantation (ACI).1,2,5,6 In Europe, subsequent generations of ACI are in use and development, with cells being seeded onto scaffolds or other support structures and then implanted into defects.5,7 For larger defects and severe OA, in which the entire joint is damaged, allografts and total knee replacements, respectively, are available treatments.2 However, none of these therapies fully restore function to damaged cartilage.2 A cartilaginous construct engineered in vitro may be a regenerative or repair solution providing normal function.2,3,8 While animal studies have shown some success in repairing focal defects using constructs,2 currently, there are no tissue engineering treatments for OA, in which the entire articular surface would need to be replaced.
Creation of large tissue-engineered constructs to resurface entire joints will require sufficiently large cell sources. Cell-based therapies such as ACI utilize autologous sources starting from ∼100 mg of cartilage from a nonload bearing region.5,6,9 These cells are isolated and expanded to obtain the prescribed number, 2 million cells per cm2 of defect area.9 For restorative treatment of the entire knee joint, with a surface area of 120 cm2,10 240+ million cells are required. In an osteoarthritic joint, if an autologous source is to be used, the amount of cartilage available for cell isolation could be limited due to tissue damage; the yield of freshly isolated cells can be as low as 2 million per gram,4,11,12 and decreases with increasing age.4,11 Extensive chondrocyte expansion is thus required to obtain the number of cells needed for joint resurfacing.
However, longer expansion times and multiple passages in monolayer can lead to chondrocyte dedifferentiation,13,14 with cells going through morphological and phenotypical changes, becoming fibroblastic and producing collagen type I, not collagen type II,13 which may be detrimental to repair. To minimize dedifferentiation and maximize the number of cells that can be obtained within a single passage, a growth factor cocktail (TFP) consisting of transforming growth factor β1 (TGF-β1), fibroblast growth factor 2 (FGF-2), and platelet-derived growth factor type bb (PDGF-bb), which has previously been used to accelerate growth with normal chondrocytes,11–13 may be applied to expand chondrocytes derived from OA cartilage. In the present study, the effect of TFP in combination with human serum (HS) and fetal bovine serum (FBS) on expansion of cells from OA cartilage was evaluated.
To utilize such cells for tissue engineering applications, redifferentiation would be required to restore their functional phenotype after expansion. Previously, redifferentiation of human chondrocytes has been enhanced by the application of growth factors and HS.11–15 Alginate bead encapsulation was selected as the method for studying redifferentiation since the three-dimensional environment enhances retention of phenotype in human articular chondrocytes and encourages formation of matrix molecules, such as aggrecan and collagen type II.15–17 The redifferentiation of expanded chondrocytes11,14,15,17–19 and chondrogenesis20,21 of stem cells is stimulated by the factors insulin-transferrin-selenium-linoleic acid-bovine serum albumin (ITS + 1) dexamethasone (dex), TGF-β1, insulin-like growth factor I (IGF-I), and bone morphogenic protein 14 (BMP-14). Serum may provide chondrogenic factors in a manner dependent on maturation, so that HS, FBS, and adult bovine serum (ABS) may have different effects on chondrogenesis. Chondrocytes from OA cartilage have not been previously studied to determine if the specific factors described above, alone or with serum, facilitate expansion and then redifferentiation in alginate.
The hypothesis of this study was that cells derived from OA cartilage can be expanded and redifferentiated at amplification levels relevant to cell sourcing for human cartilage tissue engineering at the whole-joint scale. The aims of this study were to determine the ability of selected serum and defined chemical factors to stimulate (1) proliferation of primary human chondrocytes from OA cartilage as assessed by DNA and (2) redifferentiation as assessed by accumulation of proteoglycan, and type I, II, and VI collagen.
Materials and Methods
Materials
Materials were obtained as previously described,18,22,23 except for bovine serum albumin (BSA), ITS + 1 (10 mg/mL insulin, 5.5 mg/mL transferrin, 5 ng/mL selenium, 0.5 mg/mL BSA, and 4.7 mg/mL linoleic acid) and dex (Sigma-Aldrich, St. Louis, MO); HS (Gemini Bioproducts, Sacramento, CA); and recombinant human BMP-14, FGF-2, IGF-I, PDGF-bb, and TGF-β1 (Peprotech, Rocky Hill, NJ).
Cell isolation
Chondrocytes were isolated from the cartilage of osteochondral tissue fragments removed from patients during total knee arthroplasty for OA. Tissue fragments included articular cartilage along with bone that was removed from the joint surface during surgery and usually discarded, to accept implantation of the artificial knee prosthesis. Patients (four men and five women; age, 65 ± 9 years; age range, 56–79 years) were from Scripps Green Hospital (La Jolla, CA) and had consented according to an Institutional Review Board–approved protocol. Macroscopically intact cartilage was harvested from lateral femoral condyles and the lateral portion of trochlea, and initially cultured in Dulbecco's modified Eagle's medium supplemented with 25 μg/mL ascorbate, 0.1 mM minimum essential medium nonessential amino acids, 0.4 mM L-proline, 2 mM L-glutamine, antimicrobials (100 U/mL penicillin, 100 μg/mL streptomycin, and 0.25 μg/mL fungizone), and 10% FBS for 7 days. Subsequently, cartilage was digested sequentially with pronase and collagenase to obtain chondrocytes.24
Experiment I: Chondrocyte proliferation
To determine the ability of various growth factors and serum to stimulate proliferation, primary human chondrocytes were seeded at low density in monolayer and analyzed for DNA content after various durations of culture. Chondrocytes (from two men and three women; age, 67 ± 9 years; age range, 58–79 years) were seeded at 5000 cells/cm2 in 48-well tissue culture plates with duplicate cultures for each condition and patient, and incubated with basal medium and (1) 0.1% BSA, (2) 2% FBS, (3) 2% HS, (4) 5% FBS, or (5) 5% HS, alone or with additional supplementation with 1 ng/mL TGF-β1, 5 ng/mL FGF-2, and 10 ng/mL PDGF-bb (TFP), which stimulates proliferation of normal human chondrocytes.11,12 Medium was changed every other day. On days 1, 5, 7, 9, 13, 17, and 21, one plate of cultures was terminated after recording a phase microscopy image of each culture, removing medium and freezing samples at −20°C.
To quantify cell number, samples were solubilized (0.5 mL per well of 0.5 mg/mL proteinase K in phosphate buffered ethylenediaminetetraacetic acid at 37°C for 1 h and then overnight at 60°C), and portions analyzed for DNA using PicoGreen® and human DNA standards.25 Cell number was calculated using a conversion factor of 7.7 pg of DNA per cell.25
For each set of samples from the same patient and culture condition, cell growth was characterized by fitting cell number data to a logistic growth equation. The equation was Y = A + C/(1 − e−B(x − M)), where Y = number of cells, A =initial number seeded, C = maximum number of cells, B = growth rate, x = day of culture, and M = day of maximal growth.26 C was assumed to be the average number of cells on day 21 in cultures, including serum and TFP. Values for B and M were determined by iterative minimization of sum of squared error with Excel (Microsoft, Redmond, WA).
Experiment II: Cell redifferentiation
To determine the ability of selected growth factors and serum additives to stimulate redifferentiation of chondrocytes from OA cartilage after expansion, cells were expanded under a favorable condition from Experiment I, cultured in alginate beads, and analyzed. Chondrocytes (from four men and four women; age, 66 ± 9 years; age range, 56–79 years) were seeded in monolayer at a density of 5000 cells/cm2 in 175 cm2 tissue culture flasks and incubated in medium supplemented with 2% HS and TFP for 14 days. Cells were released from monolayer with pronase and collagenase, and encapsulated in alginate beads at a density of 4 × 10⁶ cells/mL of alginate.27 Samples (10 beads each) were incubated in 24-well non-tissue culture-treated plates for 14 days with triplicate cultures for each condition and patient, with Dulbecco's modified Eagle's medium/F-12 supplemented with (A) 0.01% BSA, (B) ITS + 1, (C) ITS + 1 and 10−7 M dex, (D) ITS + 1 and 5 ng/mL TGF-β1, (E) ITS + 1 and 10 ng/mL TGF-β1, (F) ITS + 1, 10−7 M dex, and 5 ng/mL TGF-β1, (G) ITS + 1, 10−7 M dex, and 10 ng/mL TGF-β1, (H) 2% HS, (I) 2% HS, 200 ng/mL IGF-I, and 100 ng/mL BMP-14, (J) 5% HS, (K) 10% HS, (L) 10% FBS, (M) 10% ABS, and (N) 20% HS. Medium was changed every other day. Cells from all replicates were released from alginate using sodium citrate,27 and centrifuged to separate cells with their cell-associated matrix (CM, pellet) and further-removed matrix (FRM, supernatant).
Biochemical analysis
To determine the extent of redifferentiation, the contents of sulfated glycosaminoglycan (sGAG) and type II collagen, which are markers of chondrogenesis,28,29 were assayed. Portions of CM and FRM were digested with proteinase K overnight at 60°C. Digested samples were analyzed for DNA content as described above and for sGAG content using dimethylmethylene blue.30 To assess levels of collagen type II, portions of the CM fractions were pooled from four patients, digested with 1 mg/mL pepsin in 0.05 M acetic acid at 4°C overnight, and then with 0.1 mg/mL pancreatic elastase in 1.0 M Tris, 2.0 M NaCl, and 50 mM CaCl2, pH 8.0, at 4°C overnight, and processed according to manufacturer's instructions using an enzyme-linked immunosorbent assay kit (Native Type II Collagen Detection Kit; Chondrex, Redmond, WA). FRM fractions were not analyzed for collagen type II because levels were below the sensitivity of the assay.
Histochemistry and immunohistochemistry
Histochemical staining was performed on cells and associated matrix released from alginate beads from each culture condition. To view the proteoglycan matrix surrounding the cells, the CM was fixed in 2.5% gluteraldehyde and stained with 1% alcian blue overnight.31 Samples were destained with 3% acetic acid and observed using brightfield microscopy.
Immunohistochemistry (IHC) staining for collagen types I, II, and VI was performed on the CM portions of alginate bead cultures. The presence of collagen type I indicates dedifferentiation, whereas that of collagen type II indicates redifferentiation.13,18 The presence of collagen type VI can also indicate redifferentiation, and is a marker for chondrons,22 which are structures consisting of groups of cells and matrix found in native cartilage.32 Collagen types I and II were localized using the Vectastain ABC Elite Kit (Vector Laboratories, Burlingame, CA) and viewed using the Vector VIP Substrate Kit (Vector Laboratories). The CM was resuspended in phosphate buffered saline and placed on poly-L lysine–coated slides and allowed to dry overnight. Slides were postfixed in acetone, rinsed with ABC buffer, blocked with 2.5% normal horse serum, and incubated with the following primary antibodies: mouse monoclonal anti-collagen type I (1:2000 dilution; Sigma-Aldrich), mouse monoclonal anti-collagen type II (1:1500 dilution; Chondrex), and mouse nonspecific IgG (Pierce, Rockford, IL) at a concentration of 1 μg/mL as a negative control. Slides were counterstained with methyl green nuclear stain and viewed using brightfield microscopy (when methyl green is used with the Very Intense Purple (VIP) chromagen, cell nuclei appear blue). Collagen type VI was localized with the same steps as described for collagen types I and II, with an additional digestion step of 5000 U/mL of bovine testicular hyaluronidase in buffer (0.1 M NaH2PO4-H2O and 0.15 M NaCl, pH 5.3), using goat monoclonal anti-collagen type VI antibody (1:80 dilution; Southern Biotech, Birmingham, AL); as a negative control for collagen type VI, a goat nonspecific IgG (1:80 dilution; Southern Biotech) was used, also with the additional hyaluronidase digestion step.
To perform correlations with biochemical data, collagen type II IHC slides were graded manually for the percent of positively stained cells, the intensity of stain, and the total number of cells. IHC slides (2 men and 2 women; age, 62 ± 8 years; age range, 56–74 years) were graded by two independent observers for stain intensity using a quadratic scoring scale (to correspond to the area of staining). A grade of 0 indicated no staining, a grade of 1 indicated a light stain, and grades of 4, 9, and 16 indicated increasing intensity and area of staining. The number of positively stained cells per 100 cells was calculated by dividing the sum of the cells with grades of 1 through 16 by the total number of cells and multiplying by 100. The score per cell was calculated by multiplying the number of grade 1 cells by 1, the number of grade 4 cells by 4, the number of grade 9 cells by 9, and the number of grade 16 cells by 16; summing; and then dividing by the total number of cells. Clusters were counted, with a cluster defined as a group of three or more cells surrounded by positively stained matrix, and normalized to the number of clusters per 100 cells for comparison. Collagen type I IHC slides were also graded manually for the percentage of positively stained cells using the same grading system as for collagen type II. All positive collagen type I cells were graded as 1, and there were virtually no positive cells in clusters, so the score per cell and the number of clusters data are not presented.
Statistical analysis
The data are expressed as the mean ± standard error of the mean, and were analyzed using Systat 10.2 (Systat Software, Point Richmond, CA).
Experiment I
Effects on cell number, growth rate (B), and day of maximal growth (M) were assessed by two-way analysis of variance with serum and TFP as independent factors.
Experiment II
Effects on total sGAG per cell and collagen type II IHC grading parameters (number of positive cells per 100 cells, score per cell, and number of clusters per 100 cells) were assessed by analysis of variance with medium as an independent factor. When significant effects (p < 0.05) were found, Tukey post hoc testing was performed.
Results
Experiment I: Chondrocyte proliferation
TFP and serum supplementation of expansion cultures resulted in acceleration of cell growth rates and reduction of time to confluency. Phase micrographs (Fig. 1) indicated differences in growth between conditions. In conditions 2–5 with serum and TFP, cells typically reached confluency by day 7 and hyperconfluency by day 13. Without serum, in condition 1, TFP stimulated cells to reach confluency by day 13. In contrast, cells without TFP with 2% serum, FBS and HS in conditions 2 and 3, respectively, did not reach confluency until day 21. However, with more serum (5%, conditions 4 and 5), cells were confluent by day 13. Without serum or TFP, in condition 1, cell proliferation appeared minimal during the 21-day culture period. Because cell growth was minimal, data from condition 1 without TFP were not curve-fit for logistical growth parameters.
FIG. 1.

Cell expansion in monolayer with and without growth factor cocktail (TFP: transforming growth factor beta 1, fibroblast growth factor 2, and platelet-derived growth factor bb) supplementation. Phase micrographs of cells. Day 1 is shown as an example of seeding density, which is 5000 cells/cm2 for all conditions. BSA, bovine serum albumin; FBS, fetal bovine serum; HS, human serum.
These qualitative observations were consistent with cell number (Fig. 2) and calculated growth rate and day of maximal growth (Table 1). With TFP, cell number increased (p < 0.001) as did growth rate (p < 0.001), and day of maximal growth shifted earlier (p < 0.001). Growth rate was approximately 5.5-fold faster for TFP conditions than corresponding non-TFP conditions. Serum supplementation affected cell number (p < 0.05) with significant differences between serum-containing conditions 2–5 and serum-free condition 1. There were no differences due to percentage or type of serum except with cell number on day 9 between condition 2 (2% FBS), condition 3 (2% HS), and condition 5 (5% HS) (p < 0.01). There was an interactive effect of TFP and medium (p < 0.05) between days 7 and 21. An approximately 100-fold expansion was achieved with serum and TFP within a 17-day period. At day 21, the fold expansion varied between patients by 44% for conditions without TFP or serum, whereas it varied by only 8% with the addition of TFP and serum.
FIG. 2.

Cell expansion. Time course of cell growth under different medium conditions with serum ± TFP. n = 4–5 patients. Representative standard error bars are shown. Color images available online at www.liebertonline.com/ten.
Table 1.
Cell-Expansion Model Fit: Logistic Growth Curve
| |
|
B (Growth rate, day−1) |
M (Day of maximal growth) |
||
|---|---|---|---|---|---|
| Media condition | −TFP | +TFP | −TFP | +TFP | |
| 1 | 0% + 0.1% BSA | 0.152 ± 0.016 | 28.5 ± 2.8 | ||
| 2 | 2% FBS | 0.122 ± 0.018 | 0.738 ± 0.039* | 41.9 ± 2.8 | 10.9 ± 0.6* |
| 3 | 2% HS | 0.121 ± 0.026 | 0.672 ± 0.130* | 43.7 ± 4.7 | 9.9 ± 0.8* |
| 4 | 5% FBS | 0.131 ± 0.015 | 0.725 ± 0.011* | 33.4 ± 2.1 | 10.1 ± 0.7* |
| 5 | 5% HS | 0.139 ± 0.011 | 0.815 ± 0.142* | 34.4 ± 4.6 | 9.2 ± 0.6* |
n = 4, Mean ± Standard Error of the Mean.
No values are included for condition 1 without the growth factor cocktail (TFP, as defined in the caption to Figure 1) because data could not be fit to a curve.
Significant differences between + and − TFP, p < 0.001.
Experiment II: Cell redifferentiation
Biochemical analysis
Medium formulation had an effect on matrix production, assessed as sGAG/cell after incubation in alginate beads (p < 0.001, Fig. 3a). sGAG/cell was similarly low for serum-free conditions, A–G. Compared to levels in basal medium, sGAG/cell was 3.6- to 5.7-fold higher for serum-containing conditions H–N (p < 0.05). For conditions without serum, A–G, variability in matrix production was 36% between patients and 49% for conditions, H–N, with serum. Collagen type II content on a per-cell basis was low in all conditions except those with 5 and 10 ng/mL TGF-β1 (D, E), and 10 and 20% HS (K, N) (Fig. 3b).
FIG. 3.

Cell redifferentiation. (a) Sulfated glycosaminoglycan (sGAG) and (b) collagen type II production on a per-cell basis. Sulfated glycosaminoglycan samples are reported as pg/cell ± standard error of the mean for n = 5–8 patients. Standard error bars are shown. Collagen type II samples are the pooled results from n = 4 patients. The red dotted line separates nonserum from serum conditions. Significant differences from the basal control condition, A, are indicated: *p < 0.05, **p < 0.01, ***p < 0.005, and ****p < 0.001. CM, cells with cell-associated matrix; FRM, further removed matrix (panel a only); dex, dexamethasone; TGF-β1, transforming growth factor β1; IGF-I, insulin-like growth factor I; BMP-14, bone morphogenic protein 14; ABS, adult bovine serum.
Histology and IHC
Alcian blue staining was consistent with quantitative values for proteoglycan content, with culture conditions without serum resulting in less staining than culture conditions with serum. However, alcian blue staining (Fig. 4) also indicated variation among serum conditions in proteoglycan localization in the pericellular matrix even when sGAG/cell quantities were similar. In particular, conditions with 5% and higher HS (J, K, L) had structures where cells were surrounded by a shell of matrix.
FIG. 4.
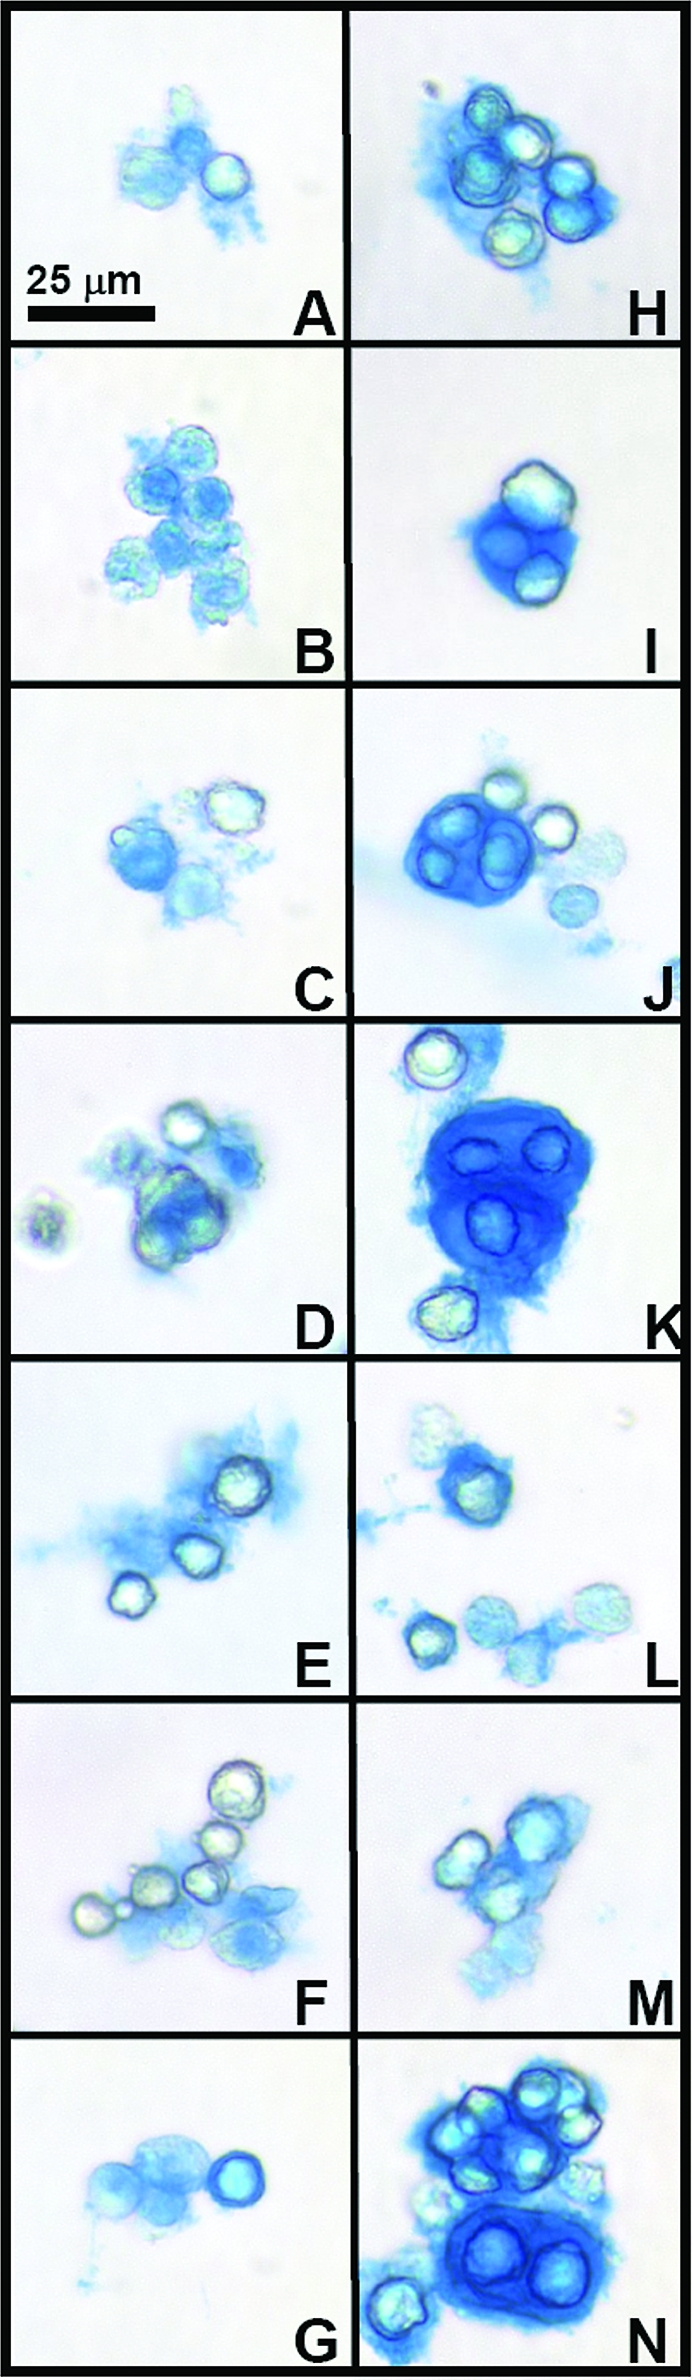
Effect of medium conditions on proteoglycan content of the cell-associated matrix. Typical alcian blue staining patterns for groups of cells are shown in micrographs (A–N). Letters correspond to medium conditions shown in Figure 3. Color images available online at www.liebertonline.com/ten.
Immunostaining for collagen types I, II, and VI indicated differences and similarities between medium conditions during redifferentiation. Collagen type I staining was light in all conditions (Fig. 5). Staining patterns for collagen type II (Fig. 6) indicated that most conditions exhibited minimal positive staining, except for serum-free conditions with TGF-β1 (D, E) and higher concentration HS conditions (K, N), consistent with biochemical data. Similar to proteoglycan staining patterns, with 10% and 20% HS, collagen type II staining also had structures where cells were surrounded by a shell of matrix. Collagen type VI (Fig. 7) was present in most conditions, with more staining intensity in conditions where clusters of cells were present. IgG controls (not shown) were negative.
FIG. 5.
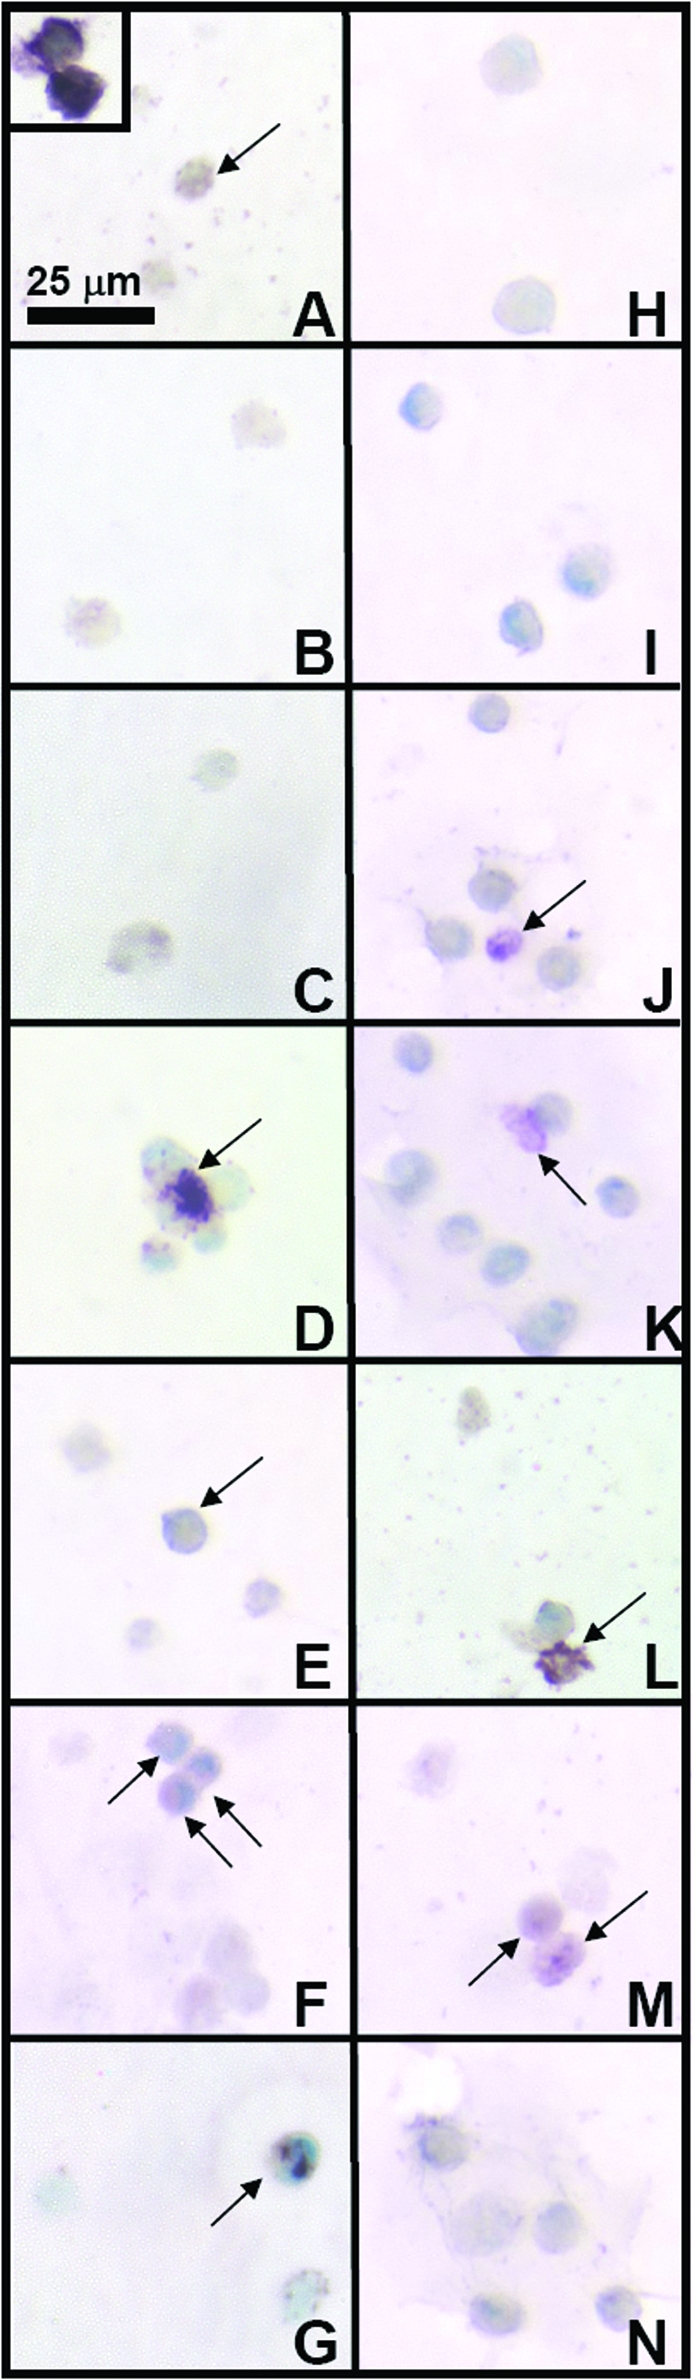
Effect of medium conditions on collagen type I content of the cell-associated matrix. Typical immunohistochemical staining patterns for groups of cells are shown in micrographs (A–N). Letters correspond to medium conditions shown in Figure 3. Inset shows example of positive staining for collagen type I. Arrows indicate positive cells in the panel for each condition. Color images available online at www.liebertonline.com/ten.
FIG. 6.
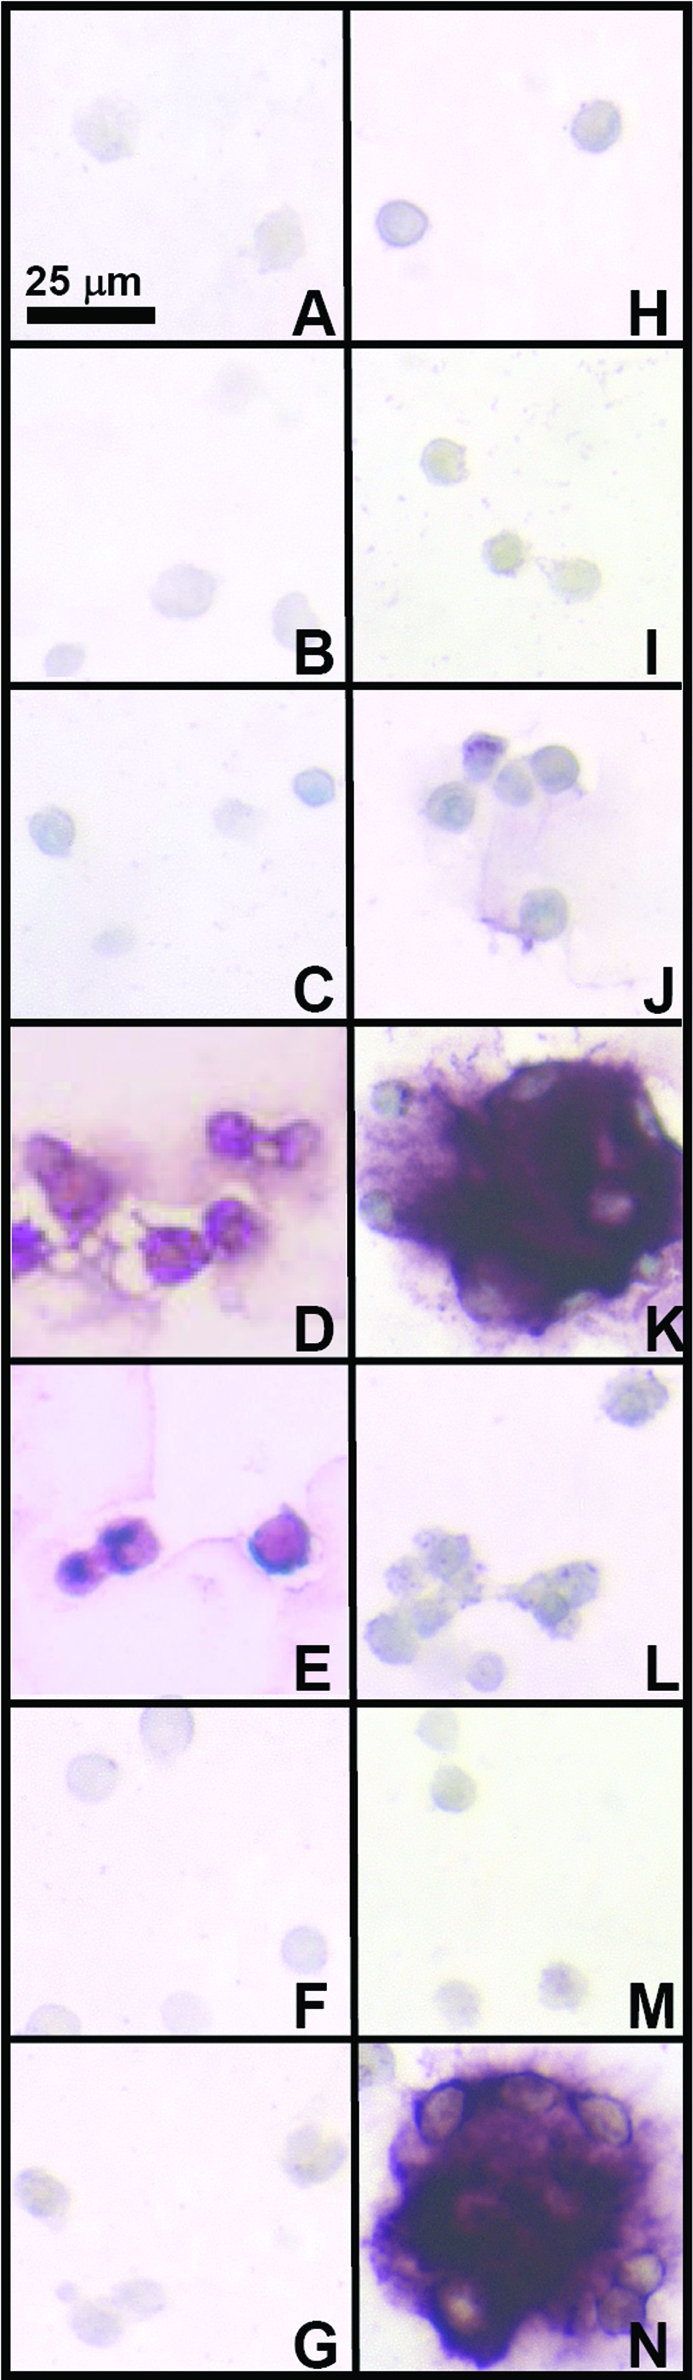
Effect of medium conditions on collagen type II content of the cell-associated matrix. Typical immunohistochemical staining patterns for groups of cells are shown in micrographs (A–N). Letters correspond to medium conditions shown in Figure 3. Color images available online at www.liebertonline.com/ten.
FIG. 7.
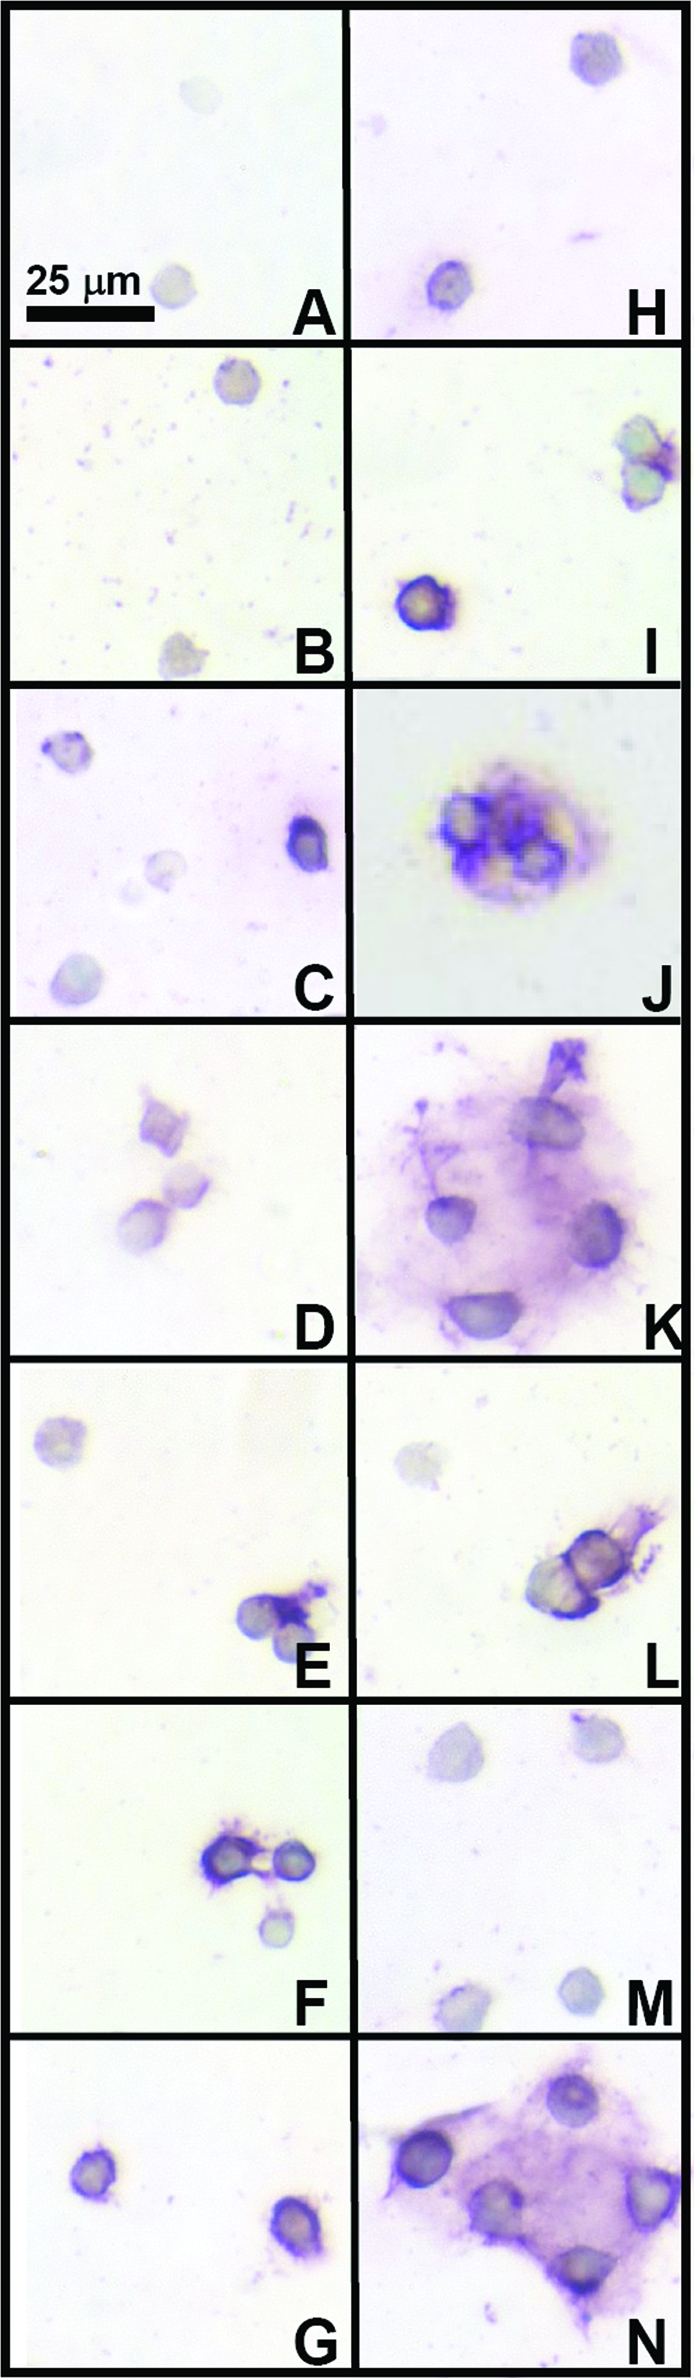
Effect of medium conditions on collagen type VI content of the cell-associated matrix. Typical immunohistochemical staining patterns for groups of cells are shown in micrographs (A–N). Letters correspond to medium conditions shown in Figure 3. Color images available online at www.liebertonline.com/ten.
Semiquantitative analysis of staining for collagen type II indicated differences between medium conditions (Fig. 8), consistent with the biochemical results. Medium had an effect on number of positive cells per 100 cells (Fig. 8B, p < 0.001), score per cell (Fig. 8C, p < 0.001), and cluster number per 100 cells (Fig. 8D, p < 0.001). Score per cell and cluster number were highest for 20% HS (N), followed by 10% HS (K), and 5 and 10 ng/mL TGF-β1 (D, E), respectively. Percent positive for those groups (D, E, K, N) were similar. HS also appeared to have a dose-dependent effect, with increasing percentages of HS resulting in an increasing number of positive cells per 100 cells, score per cell, and cluster number per 100 cells. Semiquantitative analysis of staining for collagen type I indicated that conditions were similar, with all conditions on average having less than or equal to 33 positive cells per 100 cells except for 10% ABS (M) (Fig. 8A; p < 0.05, M vs. D, E, F, I; p < 0.005, M vs. H, J, K, L, N; p < 0.001, M vs. B, C).
FIG. 8.

Effect of medium conditions on grades of collagen types I and II expression. (A) Example of semiquantitative immunohistochemistry grading of cells using a scale of 0–16. (B) Percent positive collagen type I cells. (C) Percent positive collagen type II cells. (D) Score per cell. (E) Number of clusters per 100 cells. n = 4 patients, mean±standard error of the mean. Standard error bars are shown. Significant differences from condition A are indicated: *p < 0.05, **p < 0.01, and ***p < 0.001. Color images available online at www.liebertonline.com/ten.
Discussion
The results of this study demonstrate that OA cartilage is a source of chondrocytes that can both proliferate and redifferentiate at amplification levels necessary for engineering large cartilaginous constructs. The expansion of chondrocytes from OA cartilage was accelerated by TFP (Figs. 1 and 2; Table 1), with an increase of growth rate of 5.5-fold resulting in a 100-fold expansion within 17 days for serum-containing conditions. Expanded chondrocytes could be redifferentiated in alginate when incubated in certain types of medium (Fig. 3). Histology and IHC indicated that the produced matrix, including proteoglycan and collagen type II, was localized to the pericellular environment and consistent with biochemical data (Figs. 4–8). Conditions with high percentages of cells depositing collagen type II (Fig. 8C), score per cell (Fig. 8D), and collagen type II expressing cells in clusters (Fig. 8E) generally had low percentages of cells expressing type I collagen (Fig. 8B), consistent with a chondrogenic phenotype. Additionally, supplementation of medium with HS, but not a variety of other components, including FBS, induced the formation of clusters of cells with large amounts of matrix, resembling chondrons (Figs. 4J, K, N and 6K, N). Like chondrons present in native cartilage, the clusters exhibited a characteristic pericellular staining pattern for collagen type VI (Fig. 7J, K, N). Collectively, these findings indicate that OA cartilage has the potential to be utilized as a cell source for creating large-scale cartilage constructs.
A limitation to this study is that only chondrocytes from full-thickness OA cartilage were analyzed. Such cartilage contains a mix of cells including clones and those from superficial, middle, and deep zones. The presence of clones within the cell population could have affected the results. Clones, a feature of OA pathogenesis, appear as clustered cells in lacunae under fibrillated surfaces of cartilage,33–37 and may result as part of a cellular attempt at matrix repair, although they can be present with or without matrix.33–36 The cartilage used in this study was macroscopically intact and contains a lower number of clones than fibrillated cartilage.35,36 Minimal preparation was needed to use cells from the full thickness of cartilage, thereby facilitating a high yield of isolated cells. Differences in cartilage zonal phenotype, which include cell morphology and matrix synthesis, could influence proliferative and redifferentiative properties, and may be of interest to investigate in future studies.
Additionally, cells in this study were not compared directly to chondrocytes derived from normal cartilage. During culture, OA and normal articular chondrocytes exhibit differences in gene expression14,19,38 and OA chondrocytes synthesize less cartilage-specific matrix components under certain culture condtions.14,39 However, after prolonged incubation and expansion, gene expression profiles of cells derived from OA and from normal cartilage indicated little difference, suggesting that culture conditions rather than disease state may determine the biosynthetic profile of such chondrocytes.40 Additionally, in the present studies on redifferentiation, the OA chondrocytes were expanded with TFP, which has been demonstrated to encourage redifferentiation.11 Studies that have investigated the matrix synthesis of OA chondrocytes describe proteoglycan synthesis rates that are similar to those of normal chondrocytes,14,17,19 but decreased collagen synthesis rates.14 However, as shown in this study, collagen synthesis may be markedly stimulated by certain supplements, such as 20% HS.
The present study extends prior analysis of proliferation of normal articular chondrocytes by defining the responses of chondrocytes from OA cartilage to a variety of putative regulators. With normal human chondrocytes from the knee joint, the addition of TFP increased the growth rate 3.7-fold (for donors 40 and older),11 whereas in the present study, TFP increased the growth rate 5.5-fold or higher than that of corresponding control medium conditions for chondrocytes from OA cartilage. With added TFP, serum, regardless of percentage or type, caused a similar increase in chondrocyte growth rate and total fold expansion. Minimal variation (8%) between patients for total fold expansion with the use of serum and TFP suggests that these supplements likely accelerate cell expansion for all patients. The ability for cells to proliferate up to 100-fold in one passage also has the advantage of preservation of their chondrogenic potential, which appears to be decreased further with passaging.41,42 A low seeding density (5000 cells/cm2), which has been studied for expansion of normal articular12 as well as nasal septal26 and auricular43 chondrocytes, was utilized to allow higher fold expansion in one passage.
The effects of HS on redifferentiation, which have not been examined with articular chondrocytes, were demonstrated in this study. Redifferentiation with HS has been previously studied in a dose-dependent manner using human nasal septal chondrocytes,18 but, with normal or OA articular chondrocytes, only HS albumin has been used as a supplement during redifferentiation culture.11,14,19 In this study, different percentages of HS (2, 5, 10, and 20) had similar effects on the sGAG content on a per-cell basis, although alcian blue indicated variation in matrix localization, where some cells stained positively and others did not. Further analysis could be done on the alcian blue pattern of cell staining to clarify heterogeneity of cell responses, for example, that due to different cell types found within articular cartilage.23,44 For collagen type II on a per-cell basis, only higher concentrations (10% and 20%) of HS resulted in measurable amounts (along with serum-free conditions of 5 or 10 ng/mL TGF-β1), in contrast to human nasal septal chondrocytes, where low concentrations (2%) of HS have been adequate to stimulate production of collagen type II.18 There was also a distinct and dose-dependent effect of HS on the formation of chondrons, which may also be important to the propensity of these cells to create functional tissue-engineered cartilage. Compared to chondrocytes, chondrons in pellet culture have an increased propensity to accumulate and produce cartilaginous matrix.45,46 Additionally, the pericellular matrix that is characteristic of chondrons has been postulated to have protective and signaling functions for chondrocytes,22,32,45,46 which may also be crucial for the ability of chondrocytes from OA cartilage to form cartilaginous tissue.
While the results suggest the potential utility of cartilage from OA joints, an OA cell source for tissue engineering could be used in either an autogenic or an allogeneic manner. Current clinical treatments for large cartilage defects include both autologous and allogeneic cell and tissue sources. OA cartilage from total joint surgeries would be an abundant source of cartilage, with more than a half million surgeries performed each year in the United States.47 Cartilage is considered to be immunoprivileged, because the chondrocytes are protected from an immune response by their surrounding matrix48–50; however, implantation of allogeneic chondrocytes without matrix can cause immune reactions.49 Autologous HS could be used during both expansion and redifferentiation phases to eliminate the possibility of adverse immunological reaction or transmission of infectious diseases through HS. Some patient variability was noted for the redifferentiation portion of this study and will need to be assessed for specific treatment applications. If a particular patient's cells were to outperform other cell sources, those cells could potentially be used to create a bank of cells for creating a supply of tissue-engineered constructs. Again, because the immune response should not be a critical issue with chondrocytes that have surrounding matrix, this would be a feasible therapy.
These cells could also potentially be used in a therapy analogous to ACI, except that the source would be osteoarthritic cartilage. Characterized chondrocyte implantation includes an additional step before implantation, where expanded chondrocytes are screened for gene expression levels of markers that indicate the capacity to form hyaline-like cartilage.44 Similarly, these chondrocytes could be screened to select for chondrocytes that may have higher capacity for cartilage formation. Another potential application would be to utilize these cells with the additional redifferentiation step, which is not included in the ACI procedure. Cells with matrix, or chondrons, would possibly have greater capacity for regenerating cartilage within the defect to be repaired,45,46 and may also facilitate allogeneic applications since the immune response should be minimized.48–50 Overall, OA cartilage may serve as a cell source for joint-scale engineering of cartilage tissue. Cells could be used for several different types of therapies in an autologous or allogeneic manner such as chondrocyte implantation with or without a scaffold or a cell-associated matrix, or construct formation (Fig. 9). Ongoing studies are assessing whether cells from OA cartilage expanded and redifferentiated under select conditions presented in this study can generate cartilaginous tissue in vitro, a finding that would support the use of these cells as a cell source for tissue engineering and potential clinical applications.
FIG. 9.

Potential therapeutic applications of culture-expanded and redifferentiated chondrocytes from osteoarthritic cartilage. From an osteoarthritic knee, cells are isolated (A), expanded (B), and then redifferentiated (C). The redifferentiated cells could be used to create a construct (D) for resurfacing the knee joint. The expanded or redifferentiated cells could be injected (E, F) or implanted in a scaffold (G, H) for focal defect repair. Color images available online at www.liebertonline.com/ten.
Acknowledgments
This work was supported by the National Football League Charities and the National Institutes of Health. The authors thank Mary Ellen Lenz for her careful reading of the article.
Disclosure Statement
No competing financial interests exist.
References
- 1.Hollander A.P. Dickinson S.C. Sims T.J. Brun P. Cortivo R. Kon E. Marcacci M. Zanasi S. Borrione A. De Luca C. Pavesio A. Soranzo C. Abatangelo G. Maturation of tissue engineered cartilage implanted in injured and osteoarthritic human knees. Tissue Eng. 2006;12:1787. doi: 10.1089/ten.2006.12.1787. [DOI] [PubMed] [Google Scholar]
- 2.Hunziker E.B. Articular cartilage repair: basic science and clinical progress. A review of the current status and prospects. Osteoarthritis Cartilage. 2002;10:432. doi: 10.1053/joca.2002.0801. [DOI] [PubMed] [Google Scholar]
- 3.Wendt D. Jakob M. Martin I. Bioreactor-based engineering of osteochondral grafts: from model systems to tissue manufacturing. J Biosci Bioeng. 2005;100:489. doi: 10.1263/jbb.100.489. [DOI] [PubMed] [Google Scholar]
- 4.Bobacz K. Erlacher L. Smolen J. Graninger W.B. Chondrocyte number and proteoglycan synthesis in the aging and osteoarthritic human articular cartilage. Ann Rheum Dis. 2004;63:1618. doi: 10.1136/ard.2002.002162. [DOI] [PMC free article] [PubMed] [Google Scholar]
- 5.Bartlett W. Flanagan A.M. Gooding C.R. Skinner J.A. Carrington R.W. Briggs T.W. Bentley G. Autologous chondrocyte implantation versus matrix-induced autologous chondrocyte implantation for osteochondral defects of the knee: a prospective, randomised study. J Bone Joint Surg Br. 2005;87:640. doi: 10.1302/0301-620X.87B5.15905. [DOI] [PubMed] [Google Scholar]
- 6.Brittberg M. Lindahl A. Nilsson A. Ohlsson C. Isaksson O. Peterson L. Treatment of deep cartilage defects in the knee with autologous chondrocyte transplantation. N Engl J Med. 1994;331:889. doi: 10.1056/NEJM199410063311401. [DOI] [PubMed] [Google Scholar]
- 7.Zheng M.H. Willers C. Kirilak L. Yates P. Xu J. Wood D. Shimmin A. Matrix-induced autologous chondrocyte implantation (MACI): biological and histological assessment. Tissue Eng. 2007;13:737. doi: 10.1089/ten.2006.0246. [DOI] [PubMed] [Google Scholar]
- 8.Sah R.L. Klein T.J. Schmidt T.A. Albrecht D.R. Bae W.C. Nugent G.E. McGowan K.B. Temple M.M. Jadin K.D. Schumacher B.L. Chen A.C. Sandy J.D. Articular cartilage repair, regeneration, and replacement. In: Koopman W.J., editor. Arthritis and Allied Conditions: A Textbook of Rheumatology. Philadelphia: Lippincott Williams & Wilkins; 2005. pp. 2277–2301. [Google Scholar]
- 9.Jones D.G. Peterson L. Autologous chondrocyte implantation. J Bone Joint Surg Am. 2006;88:2502. doi: 10.2106/00004623-200611000-00025. [DOI] [PubMed] [Google Scholar]
- 10.Eckstein F. Winzheimer M. Hohe J. Englmeier K.H. Reiser M. Interindividual variability and correlation among morphological parameters of knee joint cartilage plates: analysis with three-dimensional MR imaging. Osteoarthritis Cartilage. 2001;9:101. doi: 10.1053/joca.2000.0365. [DOI] [PubMed] [Google Scholar]
- 11.Barbero A. Grogan S.P. Schafer D. Heberer M. Mainil-Varlet P. Martin I. Age related changes in human articular chondrocyte yield, proliferation and post-expansion chondrogenic capacity. Osteoarthritis Cartilage. 2004;12:476. doi: 10.1016/j.joca.2004.02.010. [DOI] [PubMed] [Google Scholar]
- 12.Francioli S.E. Martin I. Sie C.P. Hagg R. Tommasini R. Candrian C. Heberer M. Barbero A. Growth factors for clinical-scale expansion of human articular chondrocytes: relevance for automated bioreactor systems. Tissue Eng. 2007;13:1227. doi: 10.1089/ten.2006.0342. [DOI] [PubMed] [Google Scholar]
- 13.Giannoni P. Cancedda R. Articular chondrocyte culturing for cell-based cartilage repair: needs and perspectives. Cells Tissues Organs. 2006;184:1. doi: 10.1159/000096946. [DOI] [PubMed] [Google Scholar]
- 14.Tallheden T. Bengtsson C. Brantsing C. Sjögren-Jansson E. Carlsson L. Peterson L. Brittberg M. Lindahl A. Proliferation and differentiation potential of chondrocytes from osteoarthritic patients. Arthritis Res Ther. 2005;7:R560. doi: 10.1186/ar1709. [DOI] [PMC free article] [PubMed] [Google Scholar]
- 15.Chubinskaya S. Hakimiyan A. Pacione C. Yanke A. Rappoport L. Aigner T. Rueger D.C. Loeser R.F. Synergistic effect of IGF-1 and OP-1 on matrix formation by normal and OA chondrocytes cultured in alginate beads. Osteoarthritis Cartilage. 2007;15:421. doi: 10.1016/j.joca.2006.10.004. [DOI] [PMC free article] [PubMed] [Google Scholar]
- 16.Hauselmann H.J. Masuda K. Hunziker E.B. Neidhart M. Mok S.S. Michel B.A. Thonar E.J. Adult human chondrocytes cultured in alginate form a matrix similar to native human articular cartilage. Am J Physiol. 1996;271:C742. doi: 10.1152/ajpcell.1996.271.3.C742. [DOI] [PubMed] [Google Scholar]
- 17.Loeser R.F. Pacione C.A. Chubinskaya S. The combination of insulin-like growth factor 1 and osteogenic protein 1 promotes increased survival of and matrix synthesis by normal and osteoarthritic human articular chondrocytes. Arthritis Rheum. 2003;48:2188. doi: 10.1002/art.11209. [DOI] [PubMed] [Google Scholar]
- 18.Alexander T.H. Sage A.B. Schumacher B.L. Sah R.L. Watson D. Human serum for tissue engineering of human nasal septal cartilage. Otolaryngol Head Neck Surg. 2006;135:397. doi: 10.1016/j.otohns.2006.05.029. [DOI] [PubMed] [Google Scholar]
- 19.Yang K.G. Saris D.B. Geuze R.E. van Rijen M.H. van der Helm Y.J. Verbout A.J. Creemers L.B. Dhert W.J. Altered in vitro chondrogenic properties of chondrocytes harvested from unaffected cartilage in osteoarthritic joints. Osteoarthritis Cartilage. 2006;14:561. doi: 10.1016/j.joca.2005.12.002. [DOI] [PubMed] [Google Scholar]
- 20.Kafienah W. Mistry S. Dickinson S.C. Sims T.J. Learmonth I. Hollander A.P. Three-dimensional cartilage tissue engineering using adult stem cells from osteoarthritis patients. Arthritis Rheum. 2007;56:177. doi: 10.1002/art.22285. [DOI] [PubMed] [Google Scholar]
- 21.Mehlhorn A.T. Schmal H. Kaiser S. Lepski G. Finkenzeller G. Stark G.B. Sudkamp N.P. Mesenchymal stem cells maintain TGF-beta-mediated chondrogenic phenotype in alginate bead culture. Tissue Eng. 2006;12:1393. doi: 10.1089/ten.2006.12.1393. [DOI] [PubMed] [Google Scholar]
- 22.Fraser S.A. Crawford A. Frazer A. Dickinson S. Hollander A.P. Brook I.M. Hatton P.V. Localization of type VI collagen in tissue-engineered cartilage on polymer scaffolds. Tissue Eng. 2006;12:569. doi: 10.1089/ten.2006.12.569. [DOI] [PubMed] [Google Scholar]
- 23.Klein T.J. Schumacher B.L. Schmidt T.A. Li K.W. Voegtline M.S. Masuda K. Thonar E.J.-M.A. Sah R.L. Tissue engineering of stratified articular cartilage from chondrocyte subpopulations. Osteoarthritis Cartilage. 2003;11:595. doi: 10.1016/s1063-4584(03)00090-6. [DOI] [PubMed] [Google Scholar]
- 24.Kuettner K.E. Pauli B.U. Gall G. Memoli V.A. Schenk R.K. Synthesis of cartilage matrix by mammalian chondrocytes in vitro. I. Isolation, culture characteristics, and morphology. J Cell Biol. 1982;93:743. doi: 10.1083/jcb.93.3.743. [DOI] [PMC free article] [PubMed] [Google Scholar]
- 25.McGowan K.B. Kurtis M.S. Lottman L.M. Watson D. Sah R.L. Biochemical quantification of DNA in human articular and septal cartilage using PicoGreen and Hoechst 33258. Osteoarthritis Cartilage. 2002;10:580. doi: 10.1053/joca.2002.0794. [DOI] [PubMed] [Google Scholar]
- 26.Hicks D.L. Sage A.B. Schumacher B.L. Sah R.L. Watson D. Growth and phenotype of low-density nasal septal chondrocyte monolayers. Otolaryngol Head Neck Surg. 2005;133:417. doi: 10.1016/j.otohns.2005.03.084. [DOI] [PubMed] [Google Scholar]
- 27.Masuda K.Sah R.L.Hejna M.J.Thonar E.J.-M.A.A novel two-step method for the formation of tissue-engineered cartilage by mature bovine chondrocytes: the alginate-recovered-chondrocyte (ARC) method J Orthop Res 21139.2003 [DOI] [PubMed] [Google Scholar]
- 28.Buckwalter J.A. Hunziker E.B. Articular cartilage morphology and biology. In: Archer C.W., editor; Caterson B., editor; Benjamin M., editor; Ralphs J.R., editor. Biology of the Synovial Joint. Amsterdam, The Netherlands: Harwood Academic Publishers; 1999. pp. 75–100. [Google Scholar]
- 29.Muir H. The chondrocyte, architect of cartilage. Biomechanics, structure, function and molecular biology of cartilage matrix macromolecules. Bioessays. 1995;17:1039. doi: 10.1002/bies.950171208. [DOI] [PubMed] [Google Scholar]
- 30.Enobakhare B.O. Bader D.L. Lee D.A. Quantification of sulfated glycosaminoglycans in chondrocyte/alginate cultures, by use of 1,9-dimethylmethylene blue. Anal Biochem. 1996;243:189. doi: 10.1006/abio.1996.0502. [DOI] [PubMed] [Google Scholar]
- 31.Sun D. Aydelotte M.B. Maldonado B. Kuettner K.E. Kimura H.J. Clonal analysis of the population of chondrocytes from the swarm rat chondrosarcoma in agarose culture. J Orthop Res. 1986;4:427. doi: 10.1002/jor.1100040405. [DOI] [PubMed] [Google Scholar]
- 32.Poole C.A. Articular cartilage chondrons: form, function and failure. J Anat. 1997;191:1. doi: 10.1046/j.1469-7580.1997.19110001.x. [DOI] [PMC free article] [PubMed] [Google Scholar]
- 33.Aigner T. McKenna L. Molecular pathology and pathobiology of osteoarthritic cartilage. Cell Mol Life Sci. 2002;59:5. doi: 10.1007/s00018-002-8400-3. [DOI] [PMC free article] [PubMed] [Google Scholar]
- 34.Kouri J.B. Arguello C. Luna J. Mena R. Use of microscopical techniques in the study of human chondrocytes from osteoarthritic cartilage: an overview. Microsc Res Tech. 1998;40:22. doi: 10.1002/(SICI)1097-0029(19980101)40:1<22::AID-JEMT4>3.0.CO;2-Z. [DOI] [PubMed] [Google Scholar]
- 35.Kouri J.B. Jimenez S.A. Quintero M. Chico A. Ultrastructural study of chondrocytes from fibrillated and non-fibrillated human osteoarthritic cartilage. Osteoarthritis Cartilage. 1996;4:111. doi: 10.1016/s1063-4584(05)80320-6. [DOI] [PubMed] [Google Scholar]
- 36.Mitchell N. Lee E.R. Shepard N. The clones of osteoarthritic cartilage. J Bone Joint Surg Br. 1992;74B:33. doi: 10.1302/0301-620X.74B1.1732261. [DOI] [PubMed] [Google Scholar]
- 37.Sandell L.J. Aigner T. Articular cartilage and changes in arthritis. An introduction: cell biology of osteoarthritis. Arthritis Res. 2001;3:107. doi: 10.1186/ar148. [DOI] [PMC free article] [PubMed] [Google Scholar]
- 38.Aigner T. Fundel K. Saas J. Gebhard P.M. Haag J. Weiss T. Zien A. Obermayr F. Zimmer R. Bartnik E. Large-scale gene expression profiling reveals major pathogenetic pathways of cartilage degeneration in osteoarthritis. Arthritis Rheum. 2006;54:3533. doi: 10.1002/art.22174. [DOI] [PubMed] [Google Scholar]
- 39.Dorotka R. Bindreiter U. Vavken P. Nehrer S. Behavior of human articular chondrocytes derived from nonarthritic and osteoarthritic cartilage in a collagen matrix. Tissue Eng. 2005;11:877. doi: 10.1089/ten.2005.11.877. [DOI] [PubMed] [Google Scholar]
- 40.Lin Z. Fitzgerald J.B. Xu J. Willers C. Wood D. Grodzinsky A.J. Zheng M.H. Gene expression profiles of human chondrocytes during passaged monolayer cultivation. J Orthop Res. 2008;26:1230. doi: 10.1002/jor.20523. [DOI] [PubMed] [Google Scholar]
- 41.Schnabel M. Marlovits S. Eckhoff G. Fichtel I. Gotzen L. Vecsei V. Schlegel J. Dedifferentiation-associated changes in morphology and gene expression in primary human articular chondrocytes in cell culture. Osteoarthritis Cartilage. 2002;10:62. doi: 10.1053/joca.2001.0482. [DOI] [PubMed] [Google Scholar]
- 42.von der Mark K. Gauss V. von der Mark H. Muller P. Relationship between cell shape and type of collagen synthesised as chondrocytes lose their cartilage phenotype in culture. Nature. 1977;267:531. doi: 10.1038/267531a0. [DOI] [PubMed] [Google Scholar]
- 43.Mandl E.W. van der Veen S.W. Verhaar J.A. van Osch G.J. Multiplication of human chondrocytes with low seeding densities accelerates cell yield without losing redifferentiation capacity. Tissue Eng. 2004;10:109. doi: 10.1089/107632704322791754. [DOI] [PubMed] [Google Scholar]
- 44.Saris D.B. Vanlauwe J. Victor J. Haspl M. Bohnsack M. Fortems Y. Vandekerckhove B. Almqvist K.F. Claes T. Handelberg F. Lagae K. van der Bauwhede J. Vandenneucker H. Yang K.G. Jelic M. Verdonk R. Veulemans N. Bellemans J. Luyten F.P. Characterized chondrocyte implantation results in better structural repair when treating symptomatic cartilage defects of the knee in a randomized controlled trial versus microfracture. Am J Sports Med. 2008;36:235. doi: 10.1177/0363546507311095. [DOI] [PubMed] [Google Scholar]
- 45.Graff R.D. Kelley S.S. Lee G.M. Role of pericellular matrix in development of a mechanically functional neocartilage. Biotechnol Bioeng. 2003;82:457. doi: 10.1002/bit.10593. [DOI] [PubMed] [Google Scholar]
- 46.Larson C.M. Kelley S.S. Blackwood A.D. Banes A.J. Lee G.M. Retention of the chondrocyte's native pericellular matrix results in significantly improved matrix production in vitro. Trans Orthop Res Soc. 1998;23:448. doi: 10.1016/s0945-053x(02)00026-4. [DOI] [PubMed] [Google Scholar]
- 47.Healy W.L. Sharma S. Schwartz B. Iorio R. Athletic activity after total joint arthroplasty. J Bone Joint Surg Am. 2008;90:2245. doi: 10.2106/JBJS.H.00274. [DOI] [PubMed] [Google Scholar]
- 48.Langer F. Gross A.E. Immunogenicity of allograft articular cartilage. J Bone Joint Surg Am. 1974;56:297. [PubMed] [Google Scholar]
- 49.Moskalewski S. Hyc A. Osiecka-Iwan A. Immune response by host after allogeneic chondrocyte transplant to the cartilage. Microsc Res Tech. 2002;58:3. doi: 10.1002/jemt.10110. [DOI] [PubMed] [Google Scholar]
- 50.Williams S.K. Amiel D. Ball S.T. Allen R.T. Tontz W.L., Jr. Emmerson B.C. Badlani N.M. Emery S.C. Haghighi P. Bugbee W.D. Analysis of cartilage tissue on a cellular level in fresh osteochondral allograft retrievals. Am J Sports Med. 2007;35:2022. doi: 10.1177/0363546507305017. [DOI] [PubMed] [Google Scholar]