

Abstract
Mesenchymal stem cells (MSCs) are adult stem cells with potential for multilineage differentiation. They represent an attractive cell source alternative to embryonic stem cells for therapeutic applications. Optimal utilization of MSCs for tissue engineering requires improved biomaterials that can enhance their growth and direct differentiation. The biological activity of glycosaminoglycans (GAGs) has been previously exploited for use in tissue engineering applications. In this study, MSC proliferation and differentiation was studied on GAG-derivatized chitosan membranes. The GAGs included heparin, heparan sulfate, dermatan sulfate, chondroitin 4-sulfate, chondroitin 6-sulfate, and hyaluronic acid. The covalent GAG immobilization method and amount of immobilized GAG were varied. It was found that MSC growth increased as much as fivefold on GAG-immobilized surfaces compared to tissue culture plastic and chitosan-only controls. The MSC growth rates increased significantly with increasing GAG density on the culture surfaces. The MSC proliferation rates on heparin, heparan sulfate, dermatan sulfate, and chondroitin 6-sulfate exhibited nonlinear increases with the level of fibronectin binding on these surfaces. In contrast, MSC proliferation on hyaluronic acid and chondroitin 4-sulfate was found to be independent of fibronectin or vitronectin binding on the surfaces, suggesting that these GAGs influenced MSC proliferation through different mechanisms. In conclusion, the results indicate that GAG immobilization on chitosan scaffolds provides an effective means of manipulating MSC proliferation and has promising potential for directing MSC differentiation in tissue engineering applications employing chitosan.
Introduction
Mesenchymal stem cells (MSCs) can be isolated from adult bone marrow and constitute a population capable of regenerating of mesenchymal tissues. MSCs have been shown to differentiate into not only mesenchymal tissues such as bone, cartilage, fat, ligament, and tendon in vitro,1 but also nonmesenchymal lineages such as neuronal,2 glial,3 hepatic,4 and endothelial.5 Owing to this great potential, MSCs make an attractive alternative to embryonic stem cells for tissue engineering applications. To develop tissue-engineered organs using MSCs, improved understanding of the growth and differentiation characteristics of these cells on scaffold materials is needed, as well as new ways of modifying these characteristics using biologically active molecules.
Chitosan is a natural polysaccharide that is biodegradable, is highly biocompatible, and can be used as a biomaterial for tissue engineering applications.6–8 Although chitosan serves as a promising material for structural assembly of a tissue engineering scaffold, its biological activity is limited as far as inducing cell attachment, growth, and differentiation. One means to improve biological activity of chitosan is through the use of immobilized, bioactive polysaccharides. These materials can modulate cell activity by mimicking aspects of the in vivo extracellular environment. Glycosaminoglycans (GAGs) are a group of extracellular matrix (ECM) polysaccharides that play important roles in cell signaling, proliferation, and differentiation, particularly during embryogenesis, through their ability to interact with ECM proteins and peptide growth factors. For example, perlecan, a heparan sulfate (HS) proteoglycan, has been implicated in many cell signaling events through its GAG chain interactions with fibroblast growth factors, vascular endothelial growth factor, and platelet-derived growth factor.9 Hyaluronic acid (HA) is known to directly bind to cell surface receptor CD44 and mediate tissue regeneration and repair.10 Heparin (HEP), dermatan sulfate (DS), and chondroitin sulfates have also been reported to interact with a number of growth factors.11,12 GAGs also offer advantages as scaffold components, since they intrinsically have greater stability and lower immunogenicity compared to most ECM proteins. The biological activity of GAGs has been exploited for use in tissue engineering applications involving angiogenesis,13,14 blood compatibility,15 sustained growth factor release,16–18 and hematopoietic stem cell proliferation.19 The GAGs can also be surface-immobilized and used as scaffold components cell culture substrates to manipulate MSC behavior, with regard to adhesion, proliferation, and differentiation in vitro and potentially in vivo.20
Traditionally, the interactions of GAGs with proteins and cells were studied with GAGs in solution. However, in the ECM, GAGs are found immobilized either covalently or ionically. In addition, the three-dimensional interactions between immobilized GAGs and proteins may be quite different from those observed in solution. Hence, the immobilized GAGs may better mimic the in vivo environment in cell culture experiments. Moreover, covalent immobilization is advantageous over ionic immobilization since it creates a more stable substrate. For example, on ionically immobilized HEP-chitosan membranes, it was shown that 90% of HEP initially present on the membrane desorbed into the medium over a 24-day incubation, leading to a constantly changing membrane composition during the culture period.21 Finally, by covalent immobilization, it is possible to stably incorporate biologically active GAGs in scaffolds for tissue engineering applications, specifically when the scaffold is intended for implantation.
In this paper, we examined the responses of rat MSCs cultured on chitosan membranes with immobilized GAGs with the objective of enhancing MSC growth and differentiation into osteogenic, adipogenic, and chondrogenic lineages. Six different GAGs were immobilized covalently on chitosan membranes and evaluated for their influence on MSC spreading, proliferation, and differentiation. We further explored the hypothesis that enhanced serum protein binding by immobilized GAGs specifically enhanced the rate and extent of MSC proliferation and differentiation.
Materials and Methods
Materials
HEP sodium United States Pharmacopoeia (USP) (molecular weight [MW] 10–12 kDa), HS (MW 10–12 kDa), and DS (MW 28–32 kDa) from porcine intestinal mucosa were purchased from Celsus Laboratories (Cincinnati, OH). Chondroitin-4-sulfate (C4S) sodium salt (average MW 20–30 kDa) from bovine trachea, chondroitin-6-sulfate (C6S) sodium salt (MW 50–60 kDa) from shark cartilage, and chitosan from crab shells (medium MW 450 kDa, and 85% degree of deacetylation), penicillin–streptomycin, amphotericin B, Dulbecco's modified Eagle's medium (DMEM), fetal bovine serum (FBS), trypsin-ethylenediaminetetraacetic acid solution, 4,6-diamidino-2-phenylindole dilactate, and methylthiazolyldiphenyl-tetrazolium bromide (MTT) were purchased from Sigma-Aldrich (St. Louis, MO). HA sodium salt (MW 1600–1800 kDa) from Streptococcus equi and 1-ethyl-3-[3-dimethylaminopropyl]carbodiimide hydrochloride (EDC) were purchased from BioChemika-Fluka (Allentown, PA). Safranin-O was purchased from EM Sciences (Cherry Hill, NJ), and toluidine blue was purchased from Polysciences (Warrington, PA).
Preparation of membranes
Chitosan membranes were prepared in 24-well tissue culture plates by air-drying 50 μL of sterile chitosan solution (1.5 wt% medium MW chitosan in 0.2 M acetic acid) per well. The chitosan membranes were derivatized with GAGs including HEP, HS, DS, C4S, C6S, or HA at GAG to chitosan ratios of 0.04, 0.08, 0.1, 0.2, 0.5, and 1.0 mg GAG per mg chitosan. GAGs were immobilized on chitosan membranes using two different methods. In the first method, the GAG solution (300 μL/well), prepared in phosphate-buffered saline (PBS), was applied to the acidic dry chitosan membrane and was incubated overnight at 4°C. The GAG solution was then aspirated, and EDC solution (10-fold molar excess with respect to the GAG solution initially applied) was added on the membranes to covalently link the ionically bound GAG to chitosan. The reaction was allowed to proceed for 24 h at room temperature. The EDC solution was then removed, and the membranes were washed extensively with sterile PBS to remove excess EDC as well as any unbound GAG and reaction by-products. In the second method, the chitosan membranes were neutralized by washing with 0.2 M sodium hydroxide and stored in PBS until ready to use. Each GAG solution was activated by mixing with an equal volume of EDC solution prepared at a concentration such that the molar ratio of EDC to GAG in the mixture was 10 to 1. The active intermediate was allowed to form for 15 min, and the activated GAG solution (600 μL/well) was applied to the chitosan membranes. The reaction was allowed to proceed for 24 h at room temperature, and the derivatized membranes were washed with three changes of PBS over 3 h.
Analysis of bound GAGs on chitosan
The presence of the GAGs on the membranes was confirmed by staining the membranes with toluidine blue (0.15 mg/mL in 50 mM sodium acetate) for 10 min (data not shown). The amount of GAG bound on the membranes was determined indirectly by measuring the concentration of GAG in the reaction solution, and the wash solutions collected after the reaction were complete. All GAG concentrations, except for HA concentration, were measured using Safranin-O dye. Thirty microliters of GAG solution or wash solution was mixed with 240 μL Safranin-O (0.04 mg/mL in 50 mM sodium acetate buffer, pH 7.4), and the absorbance of the resulting solution was measured at 510 nm. HA concentration was determined using modified m-hydroxydiphenyl method for uronic acids.19 Briefly, 40 μL of HA-containing samples were hydrolyzed by 200 μL of 120 mM sodium tetraborate in concentrated sulfuric acid at 80°C for 1 h. Then, 40 μL of 2 mg/mL m-hydroxydiphenyl reagent was added to the reaction mixture. After 15 min incubation, the absorbance of the resulting solution was measured at 540 nm. The amount of GAG in milligrams in each solution was calculated using a standard curve prepared for each GAG, and this value was subtracted from the amount of GAG initially applied to each membrane. The difference was reported as the amount of GAG bound on the membranes.
MSC isolation and culture
MSCs were isolated from bone marrow of adult male Sprague-Dawley rats as described elsewhere.20 The shafts of femurs and tibias were flushed with sterile PBS using an 18-gauge needle, and the aspirate was passed through a 70-μm nylon cell strainer. After centrifugation at 1500 rpm for 10 min and washing twice with sterile PBS, the cells were suspended in DMEM containing 10% FBS supplemented with 20 μg/mL streptomycin, 20 mU/mL penicillin, 2.5 μg/mL amphotericin B, and plated into 75-cm2 tissue culture flasks. After 3–4 days, the medium was changed to remove the unattached cells, and the adherent cells were grown to 80% confluency. The cells were then trypsinized and subcultured at a ratio of 1:4. The cells were utilized in the experiments were between passage number 2 (P2) and 10 (P10).
MSC spreading on GAG-chitosan membranes
MSCs were plated (5000 cells/cm2) on GAG-immobilized chitosan membranes prepared at GAG to chitosan ratios of 0.04, 0.08, 0.1, 0.2, 0.5, and 1 mg/mg. The cultures were monitored via phase contrast microscopy. The captured images were used to measure the projected area of attached cells using the computer software SigmaScan Pro 5 (Systat Software, San Jose, CA) to determine the degree of cell spreading on the surfaces.
MSC proliferation on GAG-modified chitosan membrane
MSCs (P2, 5000 cells/cm2) were seeded on GAG-chitosan membranes. Cells were allowed to attach for 4 days with a half medium change on day 2. Full medium changes were done every 2–3 days thereafter. The metabolic activity of the cells was measured by an MTT assay on days 2 and 4 of the culture. Fifty microliters of 6 mg/mL MTT in culture medium was added to the wells, and the cells were incubated for 4 h at 37°C. The formazan crystals were dissolved via an overnight incubation with 5% sodium dodecyl sulfate solution, pH 2.0. The absorbance was measured at 540 nm using a spectrophotometer. Assuming exponential cell growth and the proportionality of formazan absorbance to cell number, the increase in MTT metabolic activity between two time points, to and t, is given by the following equation21:
 |
where A is the absorbance measured by MTT assay, t is time in days, and μA is the specific growth rate in day−1 based on metabolic activity.
Proliferation was also assessed by cell counts performed on days 2 and 4. Briefly, medium was removed from the wells and the cell layer was gently washed with PBS. Cells were removed by trypsinization (0.25% trypsin and 0.2 g/L ethylenediaminetetraacetic acid in Hanks balanced salts) and counted using a hemacytometer. Results were used to calculate the specific growth rate (μN) using the equation:
 |
where N is the number of cells and t is time in days. We defined a parameter termed “normalized metabolic bioactivity” as the ratio of MTT absorbance to number of cells:
 |
Normalized bioactivity was expected to remain constant if the metabolic activity measured by MTT absorbance was proportional to the number of cells. However, if this was not the case, a rate of change in normalized bioactivity could be written as
 |
After appropriate substitutions, this equation reduces to
 |
where (μA − μN) was reported as the specific rate of change in the normalized bioactivity.
Cytoskeletal organization
The cytoskeletal organization of MSCs on GAG-chitosan membranes was investigated by staining the cells to view actin fibers and the focal adhesion protein vinculin. Third-passage MSCs were seeded on GAG-modified chitosan membranes at a density of 3000 cells/cm2. After 2 days of culture, cells were fixed with 4% paraformaldehyde, permeabilized using 0.1% Triton X-100, blocked with 0.5% bovine serum albumin in PBS, and stained for vinculin using a mouse monoclonal, antivinculin primary antibody (Sigma-Aldrich) and an anti-mouse immunoglobulin G (IgG)–fluorescein isothiocyanate conjugate secondary antibody (Sigma-Aldrich). Actin fibers were stained with rhodamine-labeled phalloidin (Invitrogen, Carlsbad, CA). The nuclei were counterstained with 4,6-diamidino-2-phenylindole dilactate, and cells were observed with a Nikon fluorescence microscope.
Adsorption of serum proteins on GAG-chitosan membranes
Protein adsorption on the membranes was evaluated by an immunoassay for fibronectin and vitronectin. The GAG-modified chitosan membranes were incubated overnight with culture medium containing 10% FBS at 4°C. The membranes were washed with four changes of PBS over 2 h. The primary antibodies were allowed to attach to the membranes for 2 h and then washed three times with PBS over 30 min. Next, membranes were incubated with alkaline phosphatase (AP)–conjugated secondary antibodies for 2 h. After three washes with PBS over 30 min, p-nitrophenyl phosphate (Sigma-Aldrich) in Tris-buffer was added as the substrate and kept for 30 min. The reaction was stopped by addition of 3 M sodium hydroxide, and the absorbance of the resultant solution was measured at 405 nm using a multiwell plate reader. The primary antibodies were rabbit anti-human fibronectin (Sigma-Aldrich) and monoclonal mouse antivitronectin, clone VIT-2 (Sigma-Aldrich), and the secondary antibodies were AP conjugates of anti-mouse IgM (Sigma-Aldrich) and anti-rabbit IgG (Sigma-Aldrich), respectively.
MSC differentiation into mesenchymal lineages
The differentiation potential of MSCs was evaluated on GAG-derivatized chitosan membranes. GAGs were covalently immobilized on chitosan at 0.04, 0.1, and 1 mg/mg GAG to chitosan ratio. For osteogenic differentiation, chitosan scaffolds were prepared in 24-well plates by freeze-drying method. Briefly, 100 μL of chitosan solution was placed into the wells of a 24-well plate, and the solution was allowed to freeze for 4 h by placing the multiwell plate on dry ice. At the end of 4 h, the plate containing the frozen chitosan solution was transferred to a lyophilizer flask and dried under vacuum of 80–120 mTorr (condenser temperature −57°C) for 24 h. The plate was removed from the lyophilizer, and the chitosan sponges were sterilized in 70% ethanol for at least 16 h. They were then derivatized with GAGs using the direct covalent immobilization (DCI) method, and MSCs (10,000 cells/scaffold) were seeded and allowed to penetrate into the scaffold by gravity. The cells were cultured for 6 days before osteogenic differentiation was induced with the method of Maniatopoulos et al.22 The differentiation medium was supplemented with 9 μg/mL tetracycline. The extent of osteogenic differentiation was determined by measuring the intracellular AP activity at the end of 3 weeks. The scaffolds containing the cells were washed with PBS and were sonicated using a probe-type sonicator to lyse the cells. The supernatant was used to measure the intracellular AP activity using a commercial kit (Pointe Scientific, Canton, MI) following the manufacturer's instructions. In addition, bone mineral deposition by the cells was monitored by imaging tetracycline fluorescence (excitation 380–420 nm) within the new bone matrix. For adipogenic differentiation, MSCs (20,000 cells/cm2) were seeded on GAG-derivatized chitosan membranes. After 6 days in the growth medium, adipogenic differentiation was initiated by exposure to 1 μM dexamethasone, 0.2 mM indomethacin, 10 μg/mL insulin, and 0.5 mM isobutyl methylxanthine in DMEM supplemented with 10% FBS and antibiotics.1 After 3 days in differentiation medium, the medium was changed to an adipogenic maintenance medium, which was a growth medium supplemented with 10 μg/mL insulin for another 3 days. The 6-day treatment was repeated three times. At the end of 3 weeks, the cells were fixed with 4% paraformaldehyde in PBS and stained with Oil Red O to view lipid accumulation. Further, the cells were collected via trypsinization and lysed by sonication. The concentration of intracellular triglycerides was measured using a commercial kit (Pointe Scientific). For chondrogenic differentiation, the cells were seeded (6000 cells/cm2) on 1 mg/mg HEP-, HA-, and C4S-immobilized membranes. The cells were grown for 1 week, and chondrogenic differentiation was induced by the addition of 10 ng/mL transforming growth factor-β1 in the culture medium.23 After 3 weeks of treatment, the cells were fixed and stained with Safranin-O or toluidine blue to evaluate deposition of a GAG-rich cartilage matrix by the cells.
Statistical analysis
Statistical data comparisons were performed using Student's t-test with a 95% confidence limit.
Results
Characteristics of GAG-derivatized chitosan
The membranes prepared via ionic immobilization followed by covalent binding (ICB) method appeared to be highly swollen and rough on the surface regardless of the GAG type or concentration used. However, the DCI method resulted in membranes that were smooth and exhibited no swelling (data not shown).
On membranes prepared via ICB, over 90% of the applied GAGs were immobilized on the surface at GAG to chitosan ratios less than 0.2 mg/mg (Fig. 1A). For higher amounts of applied GAG, the level of GAGs immobilized on the surfaces also increased with only slight differences between different GAGs. However, the efficiency of GAG immobilization varied from 39.3 ± 15.2% to 92.1 ± 0.6% and from 55.8 ± 1.6% to 75.6 ± 0.4% at GAG to chitosan ratios of 0.5 and 1 mg/mg, respectively. The level of HA binding reached a plateau at 0.5 mg/mg GAG to chitosan ratio. The DCI method resulted in a different immobilization profile (Fig. 1B). For low amounts of applied GAG, the level of binding was over 90%. However, for applied GAG amounts above 0.1 mg/mg, the fraction of the GAG immobilized decreased drastically. HAP, HS, and C6S displayed similar immobilization trends displaying saturation between 0.1 and 0.2 mg/mg. The amount of GAG immobilized increased only slightly for HS and C6S when the GAG concentration was increased further. The level of immobilized DS was found to be the lowest among GAGs regardless of the amount applied. On the other hand, immobilized C4S reached a plateau of 0.37 mg/mg at an applied level of 0.5 mg/mg, which was the highest level of immobilization of any GAG. The level of immobilized HA increased with increasing amounts of applied GAG within the range studied. Thus, the two immobilization methods yielded polysaccharide surfaces that were variable in macrostructure as well as in the amount of GAGs that were immobilized.
FIG. 1.

Quantification of immobilized GAGs on chitosan membranes. (A) ICB method and (B) DCI method. The amount of GAG immobilized on membranes was quantified using Safranin-O assay, and HA was quantified using m-dihydroxyphenol method as described in the text. Error bars indicate standard deviation of n = 4. GAGs, glycosaminoglycans; ICB, ionic immobilization followed by covalent binding; DCI, direct covalent immobilization; HA, hyaluronic acid.
MSC culture on GAG-immobilized chitosan
MSCs were cultured on GAG-derivatized chitosan membranes prepared using six different GAGs at six different concentrations. The negative and positive control surfaces were unmodified chitosan and tissue culture polystyrene, respectively. On membranes prepared via the ICB method, most MSCs remained unattached even after 7 days in culture (Fig. 2). On the other hand, MSCs adhered and proliferated to a different extent on GAG-chitosan membranes prepared via DCI, depending on the GAG type and density on the surfaces (Fig. 3). After 6 days, HEP-, HS-, C4S-, and HA-immobilized surfaces promoted MSC spreading and proliferation when compared to unmodified chitosan. At low GAG levels, cell density was the highest on the C4S chitosan. As the immobilized GAG density was increased to 1 mg/mg, MSC density also increased on HEP, HS, C4S, and HA, whereas GAG immobilization density had little effect on cell number on DS and C6S. In addition, cell growth in clusters was observed on HEP- and HS-modified surfaces at GAG densities of 1 mg/mg.
FIG. 2.

MSC cultures on GAG-chitosan membranes prepared via ICB on culture day 7. Chitosan membranes were derivatized with (a) HEP, (b) HS, (c) C6S, (d) C4S, (e) dermatan sulfate, and (f) HA, and MSCs were seeded at a density of 5000 cells/cm2. Cells remained round on all the surfaces after a week of culture. Scale bar is 100 μm. MSCs, mesenchymal stem cells; HEP, heparin; HS, heparan sulfate; C6S, chondroitin-6-sulfate; C4S, chondroitin-4-sulfate.
FIG. 3.

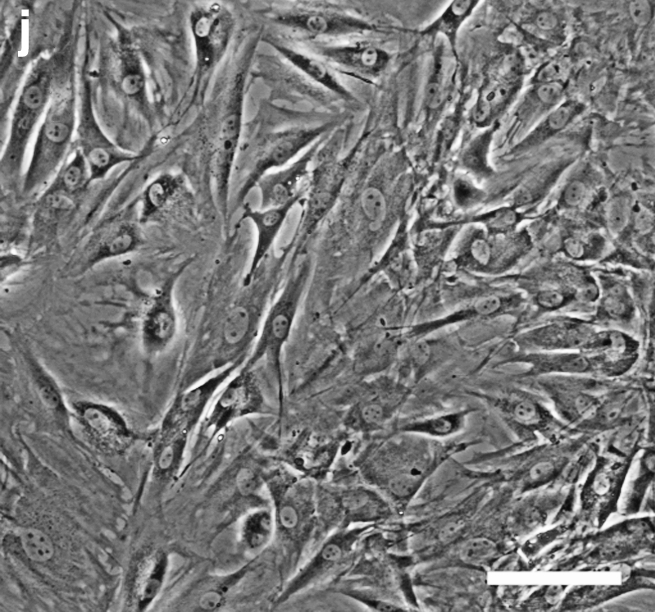
MSC cultures on GAG-chitosan membranes prepared via DCI on day 6. Chitosan membranes were derivatized with (a) 0.04 mg/mg HEP, (b) 1 mg/mg HEP, (c) 0.04 mg/mg HS, (d) 1 mg/mg HS, (e) 0.04 mg/mg C6S, (f) 1 mg/mg C6S, (g) 0.04 mg/mg C4S, (h) 1 mg/mg C4S, (i) chitosan only, and (j) TCP. Scale bar is 100 μm. TCP, tissue culture plastic.
The effect of GAG density on MSC spreading on the substrates was quantified by measuring the projected cell area as a function of GAG type and density after 5 days in culture. Increasing GAG density had a positive effect on the degree of MSC spreading on HEP-immobilized membranes (Fig. 4A). At HEP densities above 0.5 mg/mg, the mean cell area was significantly greater than that measured on low HEP membranes. The average cell area also varied depending on the GAG type (Fig. 4B). At 1 mg/mg GAG density, the cell area was lowest on C6S, followed by similar values on C4S, DS, and HEP. The cell area was significantly higher on HS- and HA-immobilized membranes compared to other GAGs.
FIG. 4.

MSC spreading on GAG-modified chitosan prepared via DCI. (A) On HEP as a function of surface GAG density and (B) on different GAGs at 1 mg/mg. The results were normalized by TCP control. Error bars represent standard deviation from the mean, n = 120, *,†p < 0.05.
MSC growth rates on GAG-modified chitosan surfaces were determined by evaluating specific growth rates based on metabolic activity (μA) and/or number (μN) of the cultured cells. The specific growth rate (μA) displayed a sharp linear increase with increasing GAG density up to approximately 0.1 mg/mg for all GAGs studied (Fig. 5A). At the peak value, specific growth rate was the highest on HEP-bound surfaces, followed by those immobilized with C4S, HS, C6S, DS, and HA in the decreasing order. When the GAG level was increased above 0.1 mg/mg, the specific growth rate decreased slightly on all the GAGs except C4S. Above 0.1 mg/mg HEP, C6S, HS, and DS modified surfaces sustained MSC growth in ascending order. MSC growth was the lowest on HA-immobilized membranes when compared with the other GAGs.
FIG. 5.

MSC proliferation on GAG-immobilized chitosan membranes. Specific growth rates calculated based on (A) metabolic activity, (B) actual number of cells, and (C) specific rate of change in the normalized bioactivity of MSCs between days 2 and 4. Error bars represent standard deviation from the mean, n = 4.
The specific growth rate of MSCs was also calculated using the actual number of cells found on the membranes on days 2 and 4 of the culture period (Fig. 5B). The specific growth rate (μN) profiles were found to be different from those obtained based on the metabolic activity. For example, μN for HA was found to be higher than those on other GAGs. In addition, on HEP, μN was smaller than those observed on other GAGs although μA was found to be the highest on HEP. To clarify the differences observed in the proliferation profiles as determined using the metabolic activity and number of cells, the metabolic activity was normalized by the number of cells and the rate of change in the normalized bioactivity was calculated. The specific rate of change in the normalized bioactivity (μA − μN) should be zero if the metabolic activity is proportional to the number of cells. ***It was found that the normalized bioactivity of the cells was influenced by the GAG type (Fig. 5C). It was enhanced on HEP-modified membranes, while it was inhibited by the presence of HA or C4S. On the other hand, the normalized bioactivity was not affected by immobilized HS, C6S, or DS.
Cytoskeletal organization in MSCs cultured on immobilized GAGs
To observe the variation of cell morphology on GAG-modified surfaces, the extent of cell spreading and cytoskeletal organization in MSCs on GAG-derivatized chitosan were analyzed by fluorescent staining of f-actin fibers and the focal adhesion protein, vinculin. MSCs were cultured on GAG-derivatized chitosan membranes at 1 mg/mg GAG to chitosan ratio, and the cultures were fixed on day 2. The organization of actin fibers is an indicator of the strength of cell–substratum attachment and the extent of cell spreading. The presence of vinculin at the ends of actin fibers suggests integrin involvement in cell adhesion to the immobilized GAGs. Cells grown on HEP-, HS-, C4S-, and HA-immobilized membranes displayed a significant degree of cell spreading with some diffuse fluorescence for vinculin inside the cells (Fig. 6). In cells grown on C4S and HA, the presence of vinculin at the end of the actin fibers could clearly be seen, and the actin fibers were very much aligned similar to those observed on tissue culture plastic. On chitosan, C6S, and DS, the cells were less spread with disorganized actin fibers, mainly near the cell periphery with some diffuse staining for vinculin. On plastic control surfaces, even though the presence of vinculin was unclear, the actin organization was significantly more prominent than on the more compliant polysaccharide surfaces.
FIG. 6.


Actin cytoskeleton and focal adhesions in MSCs cultured on GAG-modified chitosan at 1 mg/mg. (a) Dermatan sulfate, (b) C6S, (c) HEP, (d) HS, (e) HA, (f) C4S, (g) chitosan only, and (h) TCP. Actin fibers stained with rhodamine phalloidin (red), vinculin stained with monoclonal antivinculin (Sigma-Aldrich), and anti-mouse immunoglobulin G-fluorescein isothiocyanate (green) and nuclei counterstained with 4,6-diamidino-2-phenylindole dilactate. Arrows indicate vinculin-positive actin fiber ends. Scale bar is 50 μm. Color images available online at www.liebertonline.com/ten.
Adsorption of serum proteins on chitosan-GAG membranes
GAG influence on the morphology and proliferation may be dependent on several factors. One such factor is the level of serum proteins adsorbed on GAG-chitosan surfaces. The interactions of cells with materials are often governed by interactions with the serum proteins adsorbed on the material.24 Therefore, the adsorption of fibronectin and vitronectin from the serum-supplemented medium onto GAG-derivatized membranes was evaluated qualitatively using an enzyme-linked immunosorbent assay–based immunoassay. The amount of fibronectin adsorbed on the GAG-chitosan membranes increased with the amount of GAG immobilized on the surface for all GAG types, except for C4S and HA (Fig. 7A). HAP-chitosan membranes showed the highest levels of adsorbed fibronectin among other GAG-membranes over the GAG concentration range studied. HS- and C6S-immobilized surfaces displayed similar levels of fibronectin adsorption at all GAG levels. Below a density of 0.5 mg/mg, DS-derivatized membranes adsorbed slightly more fibronectin than HS and C6S-derivatized surfaces, but all three GAGs adsorbed the same level of protein at 1 mg/mg. Over the density range studied, the lowest fibronectin levels were found on HA and C4S. The highest level of vitronectin adsorption was observed on HS-derivatized surfaces, followed by HEP, even though the difference between the two GAGs was found to be statistically insignificant at high GAG/chitosan (Fig. 7B). On HS and HEP, the level of adsorbed vitronectin increased with increasing GAG density, reaching a saturation at 0.2 and 0.5 mg/mg, respectively. The presence of C6S, DS, C4S, and HA did not appear to affect the level of adsorbed vitronectin at densities up to 0.2 mg/mg. The amount of adsorbed vitronectin showed minimal increase on DS and C4S, whereas the increase was significant on HA and C6S above 0.2 mg/mg.
FIG. 7.

Adsorption of serum adhesion proteins on GAG-derivatized membranes via DCI. (A) Fibronectin binding. (B) Vitronectin binding. (C) Specific growth rate as a function of level of fibronectin binding. Error bars represent standard deviation from the mean, n = 4.
On HEP, HS, DS, and C6S, MSC-specific growth rate (μA) exhibited nonlinear trends as a function of the amount of fibronectin adsorbed on the culture surfaces (Fig. 7C). Specifically, the specific growth rate increased rapidly with fibronectin level, followed by moderate declines at higher fibronectin levels. However, the MSC-specific growth rate was found to be independent of the level of fibronectin adsorbed on C4S and HA. Both of these surfaces exhibited only low levels of fibronectin binding.
MSC differentiation
To assess the effects of GAG surfaces on MSC differentiation, the cellular response to standard MSC differentiation protocols was examined as a function of GAG surface. MSC osteogenesis was induced in porous chitosan-GAG scaffolds rather than membranes with the aim of improving three-dimensional cell-to-cell interactions. Before induction of differentiation, live cells were fluorescently imaged with calcein-AM to ensure the uniform distribution of MSCs inside the scaffold (data not shown). The deposition of bone mineral was monitored by the fluorescence of tetracycline incorporated into newly deposited bone matrix. Small nodules exhibiting tetracycline fluorescence were observed at low frequencies on HS, C4S, DS, and HA. The intracellular AP activity measurements did not suggest any significant influence of GAG type on the extent of MSC osteogenic differentiation. However, the increased AP activity on all GAG surfaces compared to chitosan-only membranes suggests that the presence of GAGs on chitosan may enhance the osteogenic differentiation potential of MSCs (data not shown).
Adipogenic differentiation of MSCs was induced on GAG-chitosan membranes prepared using 0.04, 0.1, and 1 mg GAG per mg chitosan. Adipogenic differentiation was successfully achieved on all GAG-chitosan surfaces as evident by Oil Red O staining (Fig. 8A). The highest lipid accumulation was observed on HA-bound membranes. On HEP-immobilized membranes, lipid accumulation was the lowest when compared to other GAG surfaces. The intracellular triglyceride concentration was found to be highest on the HA-immobilized membranes at 0.1 mg/mg. The presence of GAGs on chitosan appeared to enhance accumulation of intracellular triglycerides except for HS. However, with the exception of HA, increasing the GAG density above 0.1 mg/mg did not seem to affect the extent of MSC adipogenic differentiation (Fig. 8B).
FIG. 8.


Lipid accumulation in MSCs after 3 weeks of adipogenic differentiation treatment. (A) Lipid droplets stained with Oil Red O (a) HA, (b) C4S, (c) C6S, (d) HEP, (e) chitosan only, and (f) TCP. GAGs immobilized via DCI at 0.04 mg/mg. (B) Intracellular triglyceride concentration as a function of GAG density. Error bars represent standard deviation from the mean, n = 3. Color images available online at www.liebertonline.com/ten.
Chondrogenesis was induced on C4S-, HA-, and HEP-immobilized surfaces by the addition of transforming growth factor-β1 into the proliferation medium. On HA and HEP, MSCs formed attached, three-dimensional aggregates as a result of the treatment. The aggregates were found to be positive for GAG/proteoglycans as evidenced by both toluidine blue and Safranin-O staining (Fig. 9). On C4S, the aggregate size was smaller, and the staining intensity was lower than that observed on the other GAGs.
FIG. 9.

Chondrogenic differentiation of MSCs on GAG-chitosan surfaces. (a, b) C4S, (c, d) HEP, and (e, f) HA immobilized via DCI at 1 mg/mg. Cells were stained with Safranin-O (a, c, e) and toluidine blue (b, d, f) for GAGs deposited by cells. Color images available online at www.liebertonline.com/ten.
Discussion
In this study, covalent immobilization of GAGs on chitosan membranes was evaluated for the purpose of improving the biological activity of chitosan to achieve enhanced MSC proliferation and differentiation in tissue engineering applications. A series of GAG-bound chitosan surfaces were prepared using two different covalent immobilization methods, and the effects of GAG type and density on the proliferation of MSCs were studied. GAG-derivatized chitosan surfaces were evaluated for their ability to influence MSC proliferation and differentiation.
Depending on the immobilization method, GAG-chitosan surfaces displayed qualitative differences. GAG-chitosan membranes prepared by ICB were highly swollen because of the initial acidity of the cast chitosan membrane. Since the solubility of chitosan is pH dependent,25 it was expected that chitosan membrane would partly dissolve when the GAG solution was applied to the chitosan–acetic acid membrane, hence the observed swelling. However, in the other method, DCI, the chitosan membrane was neutralized before the addition of the GAG-EDC reaction mixture, and as a result, the membranes did not swell.
The quantitative analysis of the membrane-bound GAGs revealed that a higher percentage of the applied GAGs were immobilized on the surfaces via ICB, compared to DCI. In the ICB method, membrane swelling would have increased the membrane permeability. In addition, the long incubation time with the GAGs (>16 h) allowed more GAG molecules to diffuse into the swollen membrane and form ionic complexes. Subsequent addition of the cross-linker resulted in the formation of a GAG cross-linked network within the membrane. On the other hand, the DCI method involved the addition of preactivated GAGs onto neutral chitosan membranes that were less permeable because of minimal swelling. Therefore, it is likely that the GAG binding reaction mostly occurred at the membrane surface, limiting the number of GAG molecules that could be immobilized to the number of amino groups present at or near the membrane surface. The saturation observed in the amount of GAGs bound via this method supports this notion.
MSCs failed to adhere to the GAG-chitosan surfaces prepared by the ICB method, whereas they attached, spread, and proliferated on membranes prepared by DCI. As discussed earlier, the former method produced membranes that were highly swollen and rough when compared to the latter. In addition, quantitative results suggested that GAG binding was higher on membranes prepared with ICB method than those prepared via DCI. It is possible that as a result of high loading of ionically immobilized GAGs on the membrane, the GAG chains were subsequently covalently linked to chitosan at only a small number of carboxyl groups. This scenario would have produced covalently immobilized GAGs with relatively high chain mobility, and thus may have inhibited the adsorption of serum adhesion proteins on the membrane surface, resulting in low cell adhesion.
For the DCI membranes, projected cell area was determined to be the lowest on C6S, intermediate on C4S, DS, and HEP, and highest on HS and HA. As the cell-projected area is related to surface density of adhesion ligands present on the culture surface,26 it is likely that HS- and HA-immobilized membranes have comparatively higher numbers of ligands available for MSC adhesion and subsequent spreading than other GAG-bound surfaces.
When the cells are close to confluency, various aspects of metabolism may be altered. This is demonstrated particularly well in cells that are contact inhibited. Related metabolic changes may be the drivers behind the discrepancies observed between specific growth rate values calculated based on MTT metabolism and direct cell counts. To explore this further, the specific rate of change in the normalized bioactivity was used to evaluate the effect of GAG type and density on MSC metabolism. The results showed that the specific rate of change in normalized bioactivity was enhanced on HEP but suppressed on HA-bound surfaces, suggesting that the metabolic activity may be related to the degree of sulfation of the GAGs present on the surface as HEP is the most sulfated GAG among others, whereas HA does not contain any sulfate groups.27 Alternatively, HA signaling mediated by its receptor (CD44) may have played a role in this phenomenon.28
For anchorage-dependent cells, like MSCs, adhesion to ECM ligands induces several intracellular signaling processes that lead to responses such as proliferation or differentiation. In vitro, cell adhesion is a result of the affinity binding of cell surface receptors (e.g., integrins) to adhesion proteins (e.g., fibronectin and vitronectin) adsorbed on the culture surface.29,30 GAGs are known to bind a variety of ECM proteins. For example, fibronectin was previously shown to bind with decreasing affinity to HEP, HS, C6S, and C4S.31 In this report, it was found that varying levels of two serum adhesion proteins, fibronectin and vitronectin, were adsorbed by the immobilized GAGs depending on the type and density. The relative adsorption levels of both proteins revealed that MSC growth based on metabolic activity partly correlated with the level of adsorbed fibronectin on the GAG-modified membranes, except for those with immobilized C4S at low GAG/chitosan ratios. Adsorbed fibronectin has previously been shown to enhance the attachment and proliferation of endothelial cells,32 skin fibroblasts,33 and human MSCs.34 The decrease in the specific growth rate observed on most GAGs at high surface densities could be caused by the confluency signals received by the cells growing in clusters on high-density GAG-chitosan surfaces. Alternatively, high-density GAG surfaces may induce an altered conformation of serum proteins, or an increase in substrate compliance, both of which could result in decreased spreading and proliferation. Even though C4S membranes displayed the lowest levels of adsorbed fibronectin and vitronectin, the specific growth rate was measured to be highest on C4S, suggesting that MSC growth on C4S was influenced by additional factors. In particular, MSCs are known to express high levels of CD44, a HA cell surface receptor.35–38 C4S was also found to be a ligand for CD44. Therefore, it is likely that specific CD44–GAG interactions are responsible for the initial cell attachment, spreading and subsequent growth on HA- and C4S-immobilized membranes. However, more data are needed to determine if there are similar CD44 involvement in other GAG–MSC interactions.
For future work, simultaneous immobilization of different types of GAGs is recommended, which will better mimic the extracellular environment by incorporating the effects of GAGs for MSC proliferation and differentiation. A similar approach has been used for preventing the dedifferentiation of chondrocytes.39 Two GAGs that may be simultaneously immobilized on culture surface may be HEP and C4S, which are suggested to influence MSC proliferation via two different mechanisms, specifically enhanced serum protein binding and direct receptor interactions. Hence, both effects may be combined for increased MSC growth rate and metabolic activity.
Conclusions
MSCs are adult stem cells that can regenerate mesenchymal tissues. They also have advantages over other stem cell types, such as easy availability and an absence of ethical issues related to their use. Hence, they have significant potential for use in a number of cell replacement therapies and tissue engineering applications. This potential would be significantly augmented by the use of biomaterials that have the capacity to improve MSC proliferation and differentiation. In this study, we have shown that the biological activity of chitosan may be greatly enhanced by covalent immobilization of GAGs and that the resulting material has the potential to influence MSC proliferation and differentiation. MSC spreading and proliferation were found to be dependent on the type and density of the GAG present on the membrane. It was concluded that at low GAG levels increasing GAG density on the membranes enhanced MSC growth rate up to 0.1 mg GAG/mg chitosan; however, the MSC growth rate displayed saturation, as the GAG density was increased further. The analysis of adsorption of serum adhesion proteins on the GAG-modified membranes revealed that the MSC proliferation on HEP, HS, DS, and C6S correlated with the level of fibronectin binding on the surfaces. However, the protein binding levels were not found to correlate with the MSC proliferation observed on C4S- and HA-modified membranes. Instead, it was suggested that MSC proliferation on HA- and C4S-immobilized membranes was influenced by other interactions with the immobilized GAGs, possibly through the hyaluronan receptor, CD44. MSC differentiation into mesenchymal lineages was successfully achieved and showed GAG-dependent patterns. In conclusion, modification of chitosan through covalent surface immobilization of GAGs rendered chitosan more biologically active in terms of influencing MSC proliferation and differentiation. The results propose a valuable approach to make biomaterials more bioactive by mimicking native ECM for tissue engineering applications.
Acknowledgments
Funding for this work was provided by Grant #DK58711 to H.W.T.M. from the National Institutes of Health.
Disclosure Statement
No competing financial interests exist.
References
- 1.Pittenger M.F. Mackay A.M. Beck S.C. Jaiswal R.K. Douglas R. Mosca J.D. Moorman M.A. Simonetti D.W. Craig S. Marshak D.R. Multilineage potential of adult human mesenchymal stem cells. Science. 1999;284:143. doi: 10.1126/science.284.5411.143. [DOI] [PubMed] [Google Scholar]
- 2.Azizi S.A. Stokes D. Augelli B.J. DiGirolamo C. Prockop D.J. Engraftment and migration of human bone marrow stromal cells implanted in the brains of albino rats—similarities to astrocyte grafts. Proc Natl Acad Sci USA. 1998;95:3908. doi: 10.1073/pnas.95.7.3908. [DOI] [PMC free article] [PubMed] [Google Scholar]
- 3.Dezawa M. Takahashi I. Esaki M. Takano M. Sawada H. Sciatic nerve regeneration in rats induced by transplantation of in vitro differentiated bone-marrow stromal cells. Eur J Neurosci. 2001;14:1771. doi: 10.1046/j.0953-816x.2001.01814.x. [DOI] [PubMed] [Google Scholar]
- 4.Shu S.N. Wei L. Wang J.H. Zhan Y.T. Chen H.S. Wang Y. Hepatic differentiation capability of rat bone marrow-derived mesenchymal stem cells and hematopoietic stem cells. World J Gastroenterol. 2004;10:2818. doi: 10.3748/wjg.v10.i19.2818. [DOI] [PMC free article] [PubMed] [Google Scholar]
- 5.Reyes M. Lund T. Lenvik T. Aguiar D. Koodie L. Verfaillie C.M. Purification and ex vivo expansion of postnatal human marrow mesodermal progenitor cells. Blood. 2001;98:2615. doi: 10.1182/blood.v98.9.2615. [DOI] [PubMed] [Google Scholar]
- 6.Whitelock J.M. Melrose J. Iozzo R.V. Diverse cell signaling events modulated by perlecan. Biochemistry. 2008;47:11174. doi: 10.1021/bi8013938. [DOI] [PMC free article] [PubMed] [Google Scholar]
- 7.Jiang D. Liang J. Noble P.W. Hyaluronan in tissue injury and repair. Annu Rev Cell Dev Biol. 2007;23:435. doi: 10.1146/annurev.cellbio.23.090506.123337. [DOI] [PubMed] [Google Scholar]
- 8.Carulli D. Laabs T. Geller H.M. Fawcett J.W. Chondroitin sulfate proteoglycans in neural development and regeneration. Curr Opin Neurobiol. 2005;15:116. doi: 10.1016/j.conb.2005.01.014. [DOI] [PubMed] [Google Scholar]
- 9.Sugahara K. Mikami T. Uyama T. Mizuguchi S. Nomura K. Kitagawa H. Recent advances in the structural biology of chondroitin sulfate and dermatan sulfate. Curr Opin Struct Biol. 2003;13:612. doi: 10.1016/j.sbi.2003.09.011. [DOI] [PubMed] [Google Scholar]
- 10.Wissink M.J. Beernink R. Pieper J.S. Poot A.A. Engbers G.H. Beugeling T. van Aken W.G. Feijen J. Binding and release of basic fibroblast growth factor from heparinized collagen matrices. Biomaterials. 2001;22:2291. doi: 10.1016/s0142-9612(00)00418-x. [DOI] [PubMed] [Google Scholar]
- 11.Ohyama T. Nishide T. Iwata H. Sato H. Toda M. Toma N. Taki W. Immobilization of basic fibroblast growth factor on a platinum microcoil to enhance tissue organization in intracranial aneurysms. J Neurosurg. 2005;102:109. doi: 10.3171/jns.2005.102.1.0109. [DOI] [PubMed] [Google Scholar]
- 12.Wang A. Cao T. Tang H. Liang X. Salley S.O. Ng K.Y. In vitro haemocompatibility and stability of two types of heparin-immobilized silicon surfaces. Coll Surf B Biointerfaces. 2005;43:245. doi: 10.1016/j.colsurfb.2005.04.015. [DOI] [PubMed] [Google Scholar]
- 13.Sakiyama-Elbert S.E. Hubbell J.A. Controlled release of nerve growth factor from a heparin-containing fibrin-based cell ingrowth matrix. J Control Release. 2000;69:149. doi: 10.1016/s0168-3659(00)00296-0. [DOI] [PubMed] [Google Scholar]
- 14.Taylor S.J. McDonald J.W., 3rd Sakiyama-Elbert S.E. Controlled release of neurotrophin-3 from fibrin gels for spinal cord injury. J Control Release. 2004;98:281. doi: 10.1016/j.jconrel.2004.05.003. [DOI] [PubMed] [Google Scholar]
- 15.Steffens G.C. Yao C. Prevel P. Markowicz M. Schenck P. Noah E.M. Pallua N. Modulation of angiogenic potential of collagen matrices by covalent incorporation of heparin and loading with vascular endothelial growth factor. Tissue Eng. 2004;10:1502. doi: 10.1089/ten.2004.10.1502. [DOI] [PubMed] [Google Scholar]
- 16.Cho C.H. Eliason J.F. Matthew H.W. Application of porous glycosaminoglycan-based scaffolds for expansion of human cord blood stem cells in perfusion culture. J Biomed Mater Res A. 2008;86:98. doi: 10.1002/jbm.a.31614. [DOI] [PubMed] [Google Scholar]
- 17.Ferdous Z. Grande-Allen K.J. Utility and control of proteoglycans in tissue engineering. Tissue Eng. 2007;13:1893. doi: 10.1089/ten.2006.0056. [DOI] [PubMed] [Google Scholar]
- 18.Madihally S.V. Flake A.W. Matthew H.W. Maintenance of CD34 expression during proliferation of CD34+ cord blood cells on glycosaminoglycan surfaces. Stem Cells. 1999;17:295. doi: 10.1002/stem.170295. [DOI] [PubMed] [Google Scholar]
- 19.van den Hoogen B.M. van Weeren P.R. Lopes-Cardozo M. van Golde L.M. Barneveld A. van de Lest C.H. A microtiter plate assay for the determination of uronic acids. Anal Biochem. 1998;257:107. doi: 10.1006/abio.1997.2538. [DOI] [PubMed] [Google Scholar]
- 20.Javazon E.H. Colter D.C. Schwarz E.J. Prockop D.J. Rat marrow stromal cells are more sensitive to plating density and expand more rapidly from single-cell-derived colonies than human marrow stromal cells. Stem Cells. 2001;19:219. doi: 10.1634/stemcells.19-3-219. [DOI] [PubMed] [Google Scholar]
- 21.Bailey J.E. Ollis D.F. Biochemical Engineering Fundamentals. Singapore: McGraw-Hill; 1986. [Google Scholar]
- 22.Maniatopoulos C. Sodek J. Melcher A.H. Bone formation in vitro by stromal cells obtained from bone marrow of young adult rats. Cell Tissue Res. 1988;254:317. doi: 10.1007/BF00225804. [DOI] [PubMed] [Google Scholar]
- 23.Johnstone B. Hering T.M. Caplan A.I. Goldberg V.M. Yoo J.U. In vitro chondrogenesis of bone marrow-derived mesenchymal progenitor cells. Exp Cell Res. 1998;238:265. doi: 10.1006/excr.1997.3858. [DOI] [PubMed] [Google Scholar]
- 24.Wilson C.J. Clegg R.E. Leavesley D.I. Pearcy M.J. Mediation of biomaterial-cell interactions by adsorbed proteins: a review. Tissue Eng. 2005;11:1. doi: 10.1089/ten.2005.11.1. [DOI] [PubMed] [Google Scholar]
- 25.Suh J.K. Matthew H.W. Application of chitosan-based polysaccharide biomaterials in cartilage tissue engineering: a review. Biomaterials. 2000;21:2589. doi: 10.1016/s0142-9612(00)00126-5. [DOI] [PubMed] [Google Scholar]
- 26.Reinhart-King C.A. Dembo M. Hammer D.A. The dynamics and mechanics of endothelial cell spreading. Biophys J. 2005;89:676. doi: 10.1529/biophysj.104.054320. [DOI] [PMC free article] [PubMed] [Google Scholar]
- 27.Tillman J. Ullm A. Madihally S.V. Three-dimensional cell colonization in a sulfate rich environment. Biomaterials. 2006;27:5618. doi: 10.1016/j.biomaterials.2006.07.006. [DOI] [PubMed] [Google Scholar]
- 28.Lisignoli G. Cristino S. Piacentini A. Cavallo C. Caplan A.I. Facchini A. Hyaluronan-based polymer scaffold modulates the expression of inflammatory and degradative factors in mesenchymal stem cells: involvement of Cd44 and Cd54. J Cell Physiol. 2006;207:364. doi: 10.1002/jcp.20572. [DOI] [PubMed] [Google Scholar]
- 29.Schvartz I. Seger D. Shaltiel S. Vitronectin. Int J Biochem Cell Biol. 1999;31:539. doi: 10.1016/s1357-2725(99)00005-9. [DOI] [PubMed] [Google Scholar]
- 30.Pankov R. Yamada K.M. Fibronectin at a glance. J Cell Sci. 2002;115:3861. doi: 10.1242/jcs.00059. [DOI] [PubMed] [Google Scholar]
- 31.Herndon M.E. Stipp C.S. Lander A.D. Interactions of neural glycosaminoglycans and proteoglycans with protein ligands: assessment of selectivity, heterogeneity and the participation of core proteins in binding. Glycobiology. 1999;9:143. doi: 10.1093/glycob/9.2.143. [DOI] [PubMed] [Google Scholar]
- 32.Balcells M. Edelman E.R. Effect of pre-adsorbed proteins on attachment, proliferation, and function of endothelial cells. J Cell Physiol. 2002;191:155. doi: 10.1002/jcp.10087. [DOI] [PubMed] [Google Scholar]
- 33.Barbucci R. Magnani A. Chiumiento A. Pasqui D. Cangioli I. Lamponi S. Fibroblast cell behavior on bound and adsorbed fibronectin onto hyaluronan and sulfated hyaluronan substrates. Biomacromolecules. 2005;6:638. doi: 10.1021/bm049642v. [DOI] [PubMed] [Google Scholar]
- 34.Ogura N. Kawada M. Chang W.J. Zhang Q. Lee S.Y. Kondoh T. Abiko Y. Differentiation of the human mesenchymal stem cells derived from bone marrow and enhancement of cell attachment by fibronectin. J Oral Sci. 2004;46:207. doi: 10.2334/josnusd.46.207. [DOI] [PubMed] [Google Scholar]
- 35.Moriscot C. de Fraipont F. Richard M.J. Marchand M. Savatier P. Bosco D. Favrot M. Benhamou P.Y. Human bone marrow mesenchymal stem cells can express insulin and key transcription factors of the endocrine pancreas developmental pathway upon genetic and/or microenvironmental manipulation in vitro. Stem Cells. 2005;23:594. doi: 10.1634/stemcells.2004-0123. [DOI] [PubMed] [Google Scholar]
- 36.Li G.R. Sun H. Deng X. Lau C.P. Characterization of ionic currents in human mesenchymal stem cells from bone marrow. Stem Cells. 2005;23:371. doi: 10.1634/stemcells.2004-0213. [DOI] [PubMed] [Google Scholar]
- 37.Meirelles Lda S. Nardi N.B. Murine marrow-derived mesenchymal stem cell: isolation, in vitro expansion, and characterization. Br J Haematol. 2003;123:702. doi: 10.1046/j.1365-2141.2003.04669.x. [DOI] [PubMed] [Google Scholar]
- 38.Bertani N. Malatesta P. Volpi G. Sonego P. Perris R. Neurogenic potential of human mesenchymal stem cells revisited: analysis by immunostaining, time-lapse video and microarray. J Cell Sci. 2005;118:3925. doi: 10.1242/jcs.02511. [DOI] [PubMed] [Google Scholar]
- 39.Chen Y.L. Chen H.C. Lee H.P. Chan H.Y. Hu Y.C. Rational development of GAG-augmented chitosan membranes by fractional factorial design methodology. Biomaterials. 2006;27:2222. doi: 10.1016/j.biomaterials.2005.10.029. [DOI] [PubMed] [Google Scholar]