Abstract
Motor output capabilities of the forelimb representation of dorsal motor area (PMd) and ventral motor area (PMv) were compared with primary motor cortex (M1) in terms of latency, strength, sign, and distribution of effects. Stimulus-triggered averages (60 μA) of electromyographic activity collected from 24 forelimb muscles were computed at 314 tracks in 2 monkeys trained to perform a reach-to-grasp task. The onset latency and magnitude of facilitation effects from PMd and PMv were significantly longer and 7- to 9-fold weaker than those from M1. Proximal muscles were predominantly represented in PMd and PMv. A joint-dependent flexor or extensor preference was also present. Distal and proximal muscle representations were intermingled in PMd and PMv. A gradual increase in latency and decrease in magnitude of effects were observed in moving from M1 surface sites toward more anterior sites in PMd. For many muscles, segregated areas producing suppression effects were found along the medial portion of PMd and adjacent M1. Although some facilitation effects from PMd and PMv had onset latencies as short as those from M1 in the same muscle, suggesting equal direct linkage, the vast majority had properties consistent with a more indirect linkage to motoneurons either through corticocortical connections with M1 and/or interneuronal linkages in the spinal cord.
Keywords: corticospinal neurons, EMG, forelimb, frontal lobe, motor control, premotor areas, primate
Introduction
The premotor cortex corresponds to the anterior aspect of Brodmann's area 6 in primates and is located on the lateral aspect of the hemisphere of the frontal cortex (Brodmann 1909). The premotor cortex is composed of 2 functional representations, the dorsal motor area (PMd) and the ventral motor area (PMv). PMd and PMv are 2 of 7 separable motor areas contained within the frontal lobe. These areas each contain corticospinal neurons and are involved in the control of forelimb movements (Dum and Strick 1991; Galea and Darian-Smith 1994). More significantly, corticospinal neurons from PMd and PMv project into and near motoneuronal pools, suggesting the potential for monosynaptic control over motoneurons, paralleling that from primary motor cortex (M1) (Kuypers and Brinkman 1970; He et al. 1993; Galea and Darian-Smith 1994). Whereas, the existence of monosynaptic M1 corticomotoneuronal linkages has been well characterized, the nature of the linkage from PMd and PMv corticospinal neurons to spinal motoneurons and the efficacy of effects from these areas on motor output remain largely unknown (Cheney and Fetz 1980; Porter and Lemon 1993; Maier et al. 2002; Shimazu et al. 2004).
Using repetitive intracortical microstimulation (ICMS), proximal and distal forelimb movements can be evoked from PMd and PMv (Godschalk et al. 1995; Graziano et al. 2002; Frost et al. 2003; Raos et al. 2003; Stark et al. 2007). The extent to which segregated proximal and distal forelimb representations exist in PMd and PMv is debatable. Anatomical studies of PMd based on high-density bins of labeled corticospinal neurons show a segregated forelimb representation of proximal muscles located laterally to a representation of distal muscles (He et al. 1993). The opposite organization was reported with evoked movements in ICMS studies in which a proximal forelimb representation was found to be located medially to a distal representation (Raos et al. 2003). Whereas, segregated representations of proximal versus distal muscles were reported in the above studies, other studies have reported that proximal and distal movements in PMd are largely overlapping (Godschalk et al. 1995). For PMv, anatomical studies suggest that the majority of its corticospinal neurons are involved in the control of proximal forelimb muscles (He et al. 1993). Moreover, recent studies have shown that PMv's effects on forelimb muscle activity are mainly achieved indirectly through M1, suggesting only a weak contribution of its corticospinal neurons to muscle activity (Cerri et al. 2003; Shimazu et al. 2004; Schmidlin et al. 2008).
In comparison to ICMS and anatomical approaches, stimulus-triggered averaging (StTA) of electromyographic (EMG) activity has the advantage that both excitatory and inhibitory output effects to large numbers of individual muscles can be quantified in terms of magnitude, latency, and distribution. Using this technique, Park et al. (2001) mapped the forelimb representation of M1 and established the existence of segregated proximal and distal muscle representations. The broad objective of this study was to use StTA of EMG activity to assess the motor output capabilities of PMd and PMv, relative to M1, in terms of sign (poststimulus facilitation [PStF] or poststimulus suppression [PStS]), latency, and strength of poststimulus effects (PStEs). We also systematically mapped the representation of PMd and PMv relative to 24 muscles of the forelimb in an effort to further investigate the organization of proximal, distal, and individual muscle representations. The same parameters of stimulation (60 μA) were used in PMd, PMv, and M1 for direct comparison of PStEs on muscle activity.
Materials and Methods
Behavioral Task and Surgical Procedures
Two male rhesus monkeys (Macaca mulatta, ∼9 kg, 5 and 8 years of age) were trained to perform a reach-to-grasp task requiring activation of multiple proximal and distal forelimb muscles as natural synergies. The monkeys will be referred to as “J” and “Y” throughout this report. On completion of training, each monkey was stereotaxically implanted with a 30-mm diameter cortical chamber over the left hemisphere at an angle of 15 degree to the midsagittal plane. The specific coordinates of the chambers were anterior 20.9 mm and lateral 12.9 mm for monkey J and anterior 12.9 mm and lateral 9 mm for monkey Y. The location of the chamber allowed us to have full access to the forelimb representations of M1 and PMd and all but the most lateral portion of PMv in both monkeys. Chamber implantation and electrode placements were guided by structural magnetic resonance images obtained from a 3 Tesla Siemens Allegra system prior to surgery. The images were acquired with the monkey's head mounted in an MRI-compatible stereotaxic apparatus. The orientation and location of the penetrations (Fig. 1) were matched to the MRI reconstruction of the brain as described previously (Boudrias et al. 2006).
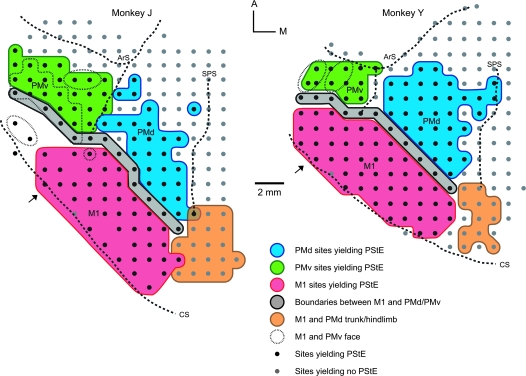
Figure 1.
Dorsal view of the electrode penetration maps of the left hemisphere in 2 monkeys. Red area corresponds to tracks in M1 where StTA yielded PStEs, blue area corresponds to tracks where StTA yielded PStEs in PMd, green area corresponds to tracks where StTA yielded PStEs in PMv, gray area indicates boundary zone between M1 and lateral premotor areas, tracks where StTA at 60 μA produced PStEs are marked by small black dots, tracks where StTA did not produce PStEs at 60 μA are marked by small gray dots, tracks where ICMS produced hindlimb movements in M1 and PMd are highlighted in orange, and tracks where ICMS produced oral–facial movements in M1 and PMv are enclosed by fine dotted lines. Course dotted lines indicate the fundus (curvature) of the central sulcus and other sulci. The arrow indicates the lateral limit of PStEs from M1 included in the data set for the transition of magnitude and latency from M1 to PMd sites in Figures 2–4. The midline is located 8–9 mm medial to the superior precentral sulcus for both monkeys. Tracks were performed 1 mm apart. A, Anterior; ArS, arcuate sulcus; CS, central sulcus; M, medial; and SPS, superior precentral sulcus.
Each forelimb muscle was implanted with a pair of multistranded stainless steel wires (Cooner Wire, Chatsworth, CA), which were led subcutaneously to connectors on the forearm (subcutaneous implant) or to a cranial connector attached to the acrylic surrounding the recording chamber (Park et al. 2000). While the monkeys were performing the task, EMG activity was recorded from 24 muscles of the forelimb including 5 shoulder muscles: pectoralis major (PEC), anterior deltoid (ADE), posterior deltoid (PDE), teres major (TMAJ), and latissimus dorsi (LAT); 7 elbow muscles: biceps short head (BIS), biceps long head (BIL), brachialis (BRA), brachioradialis (BR), triceps long head (TLON), triceps lateral head (TLAT), and dorsoepitrochlearis (DE); 5 wrist muscles: extensor carpi radialis (ECR), extensor carpi ulnaris (ECU), flexor carpi radialis (FCR), flexor carpi ulnaris (FCU), and palmaris longus; 5 digit muscles: extensor digitorum communis (EDC), extensor digitorum 2 and 3 (ED 2, 3), extensor digitorum 4 and 5 (ED 4, 5), flexor digitorum superficialis (FDS), and flexor digitorum profundus; and 2 intrinsic hand muscles: abductor pollicis brevis (APB) and first dorsal interosseus (FDI). In monkey Y, we recorded across FDI and APB because 1 wire in each muscle had high impedance. The combined FDI–APB recording was referred to as the intrinsic hand muscle (Intrins.). For similar reasons, 1 wire from TLAT and another 1 from TLON were combined to form a triceps muscle (TRI). Shoulder and elbow muscles are considered proximal muscles, and wrist, digit, and intrinsic hand muscles are considered distal muscles.
All surgeries were performed under deep general anesthesia and sterile conditions in accordance with the Association for Assessment and Accreditation of Laboratory Animal Care and the Guide for the Care and Use of Laboratory Animals, published by the US Department of Health and Human Services and the National Institutes of Health.
Data Recording
Glass- and mylar-insulated platinum–iridium electrodes with typical initial impedances between 0.7 and 2 MΩ were used for cortical recording and stimulation (Frederick Haer & Co., Bowdoinham, ME). The electrode was advanced with a manual hydraulic microdrive (Frederick Haer & Co.), and stimulation was performed at 0.5-mm intervals in all layers of the gray matter. Only PStEs recorded near or in layer V of the gray matter were included in this study. Layer V was identified by calculating the depth of the penetration according to the first cortical electrical activity encountered and by the presence of increased background activity and spike amplitude typical of layer V. Electrode penetrations were made 1 mm apart over the full extent of the forelimb representation of M1, PMd, and throughout PMv, except for its most lateral portion. Penetrations were performed throughout the posterior wall and the genu of the arcuate sulcus in both PMd and PMv. Some tracks in M1 were 2 mm apart in the forelimb representation of monkey J (Fig. 1).
StTAs (15 and 60 μA at 7–15 Hz) of EMG activity were computed for 24 muscles of the forelimb from stimuli applied throughout all phases of the reach-to-grasp task. StTAs were based on at least 500 trigger events. Individual stimuli were symmetrical biphasic pulses (0.2 ms negative followed by 0.2 ms positive). EMGs were filtered from 30 Hz to 1 KHz, digitized at 4 kHz, and full-wave rectified. To prevent averaging periods where EMG was minimal or absent, segments of EMG associated with each stimulus were evaluated and accepted for averaging only if the mean of data points over the entire epoch was ≥5% of full-scale input voltage (±5 V) of the CED Power 1401 (Cambridge Electronic Design Ltd., Cambridge, United Kingdom). At the beginning of every recording session, the gain of each EMG signal was adjusted to fill the full-scale range.
EMG recordings were tested for cross talk by computing EMG-triggered averages, and muscles were eliminated from the data set when cross talk was observed (Cheney and Fetz 1980). FCU and ED 4, 5 were rejected in monkey Y and BR in both monkeys due to cross talk. Additionally, PEC in monkey Y was rejected because the EMG signal was weak.
Data Analysis
Averages were compiled using an epoch of 60 ms in length, extending from 20 ms before the trigger to 40 ms after the trigger. Epoch duration was lengthened to 120 ms (30 ms pretrigger to 90 ms posttrigger) for all sites in PMd of monkey Y and in randomly selected sites in PMv and M1 for both monkeys in order to evaluate the presence of a second long latency peak as previously observed in the supplementary motor area (SMA; Boudrias et al. 2006). At each stimulation site, averages were obtained from all 24 muscles. Mean baseline EMG level and standard deviation (SD) were measured during the pretrigger period. PStF and PStS effects were computer measured. PStF effects were only considered significant if the envelope of the StTA crossed a level equivalent to 2 SD of the mean of the baseline EMG for a period of time equal to or greater than 1.25 ms (5 points). Peaks less than 2 SD of the baseline and peaks that remained above 2 SD for less than 1.25-ms period were not included in our data set. The magnitude of PStF and PStS was expressed as the peak percentage increase (ppi) or peak percentage decrease (ppd) in EMG activity above (facilitation) or below (suppression) baseline. Biphasic effects were categorized based on the earliest effects. All biphasic effects consisted of facilitation followed by suppression.
M1 Database
A total of 174 electrode tracks were made in the different representations of M1 and along its borders with PMd and PMv. PStEs collected from these tracks were used to create 2 different M1 data sets. For comparing the magnitudes and latencies of PStEs, the first data set included penetrations in M1 that were randomly selected within its forelimb representation. A total of 30 tracks were selected from the 2 monkeys, and data were collected at 2 different intensities, 15 and 60 μA (Tables 1–3). The use of 15 μA was based on previous StTA studies (Park et al. 2001, 2004). Half of the penetrations were in the anterior part of M1 (cortical surface) and the other half were in the buried posterior part of M1 (wall of the precentral gyrus) at depths ranging from 1.5 to 7.5 mm (mean 3.9 mm). For comparison of PStEs at 15 and 60 μA, only muscles with effects at both intensities from a particular cortical site were included.
Table 1.
Summary of data collected from PMd, PMv, and M1
| PMd |
PMv |
M1 |
|||||||
| Monkey J | Monkey Y | Total | Monkey J | Monkey Y | Total | Monkey J | Monkey Y | Total | |
| Electrode tracks | 103 | 102 | 205 | 54 | 25 | 79 | 12 | 18 | 30 |
| PStF effects | 74 | 182 | 256 | 188 | 139 | 327 | 140 | 200 | 340 |
| PStS effects | 50 | 41 | 91 | 18 | 2 | 20 | 10 | 1 | 11 |
| Total PStEs | 124 | 223 | 347 | 206 | 141 | 347 | 150 | 201 | 351 |
Note: PMd, PMv, and M1 data from 2 monkeys. M1 data are based on PStEs that were present at both 15 and 60 μA. A total of 174 tracks were in M1, but only a portion of these tracks (N = 30) was used for the data in this table (see M1 database in Materials and Methods).
Table 2.
Summary and comparison of effects obtained from PMd, PMv, and M1
| Number of muscles with PStEs and percent of total PStEs |
|||
| Joint | PMd | PMv | M1 |
| Shoulder | 107 | 67 | 39 |
| Elbow | 83 | 128 | 83 |
| Wrist | 25 | 64 | 103 |
| Digit | 36 | 50 | 88 |
| Intrinsic hand muscle | 5 | 18 | 27 |
| PStF proximal (%) | 78 | 61 | 38 |
| PStF distal (%) | 22 | 39 | 62 |
| Total PStF | 256 | 327 | 340 |
| Total PStS | 91 | 20 | 11 |
| PStF effects as percentage of total | 74 | 94 | 97 |
Note: M1 data are based on PStEs that were present at both 15 and 60 μA. Percentages of proximal (shoulder and elbow muscles) and distal (wrist, digit, and intrinsic hand muscles) PStF effects were adjusted to normalize for differences in the number of muscles recorded at distal and proximal joints.
Table 3.
Latency and magnitude of PStF and PStS effects from PMd, PMv, and M1 at 60 μA
| PMd | PMv | M1 | |
| PStF effects | N = 256 | N = 327 | N = 340 |
| Latencies (ms) | |||
| Shoulder | 8.5 ± 1.8 | 8.9 ± 1.5 | 7.5 ± 1.9 |
| Elbow | 10.6 ± 4.2 | 9.1 ± 1.6 | 7.0 ± 0.8 |
| Wrist | 11.8 ± 5.6 | 10.5 ± 1.6 | 7.7 ± 0.7 |
| Digit | 13.3 ± 5.6 | 10.5 ± 1.3 | 8.0 ± 0.8 |
| Intrinsic Hand | 10.4 ± 2.4 | 12.1 ± 1.6 | 9.2 ± 1.3 |
| All | 10.2 ± 4.1 | 9.7 ± 1.8 | 7.7 ± 1.2 |
| Magnitudes (ppi) | |||
| Shoulder | 17.6 ± 8.0 | 15.9 ± 7.3 | 50.5 ± 25.8 |
| Elbow | 16.9 ± 9.0 | 28.3 ± 19.6 | 109.7 ± 66.6 |
| Wrist | 18.3 ± 4.6 | 17.1 ± 6.6 | 178.9 ± 145.0 |
| Digit | 16.7 ± 4.4 | 17.5 ± 7.7 | 206.0 ± 167.5 |
| Intrinsic Hand | 17.7 ± 5.7 | 22.0 ± 21.1 | 235.2 ± 145.3 |
| All | 17.3 ± 7.6 | 21.6 ± 15.2 | 158.8 ± 139.9 |
| PStS effects | N = 91 | N = 20 | N = 11 |
| Latencies (ms) | |||
| Shoulder | 15.0 ± 6.0 | 15.1 ± 2.2 | 8.0 |
| Elbow | 14.1 ± 6.9 | 18.1 ± 2.0 | 9.3 ± 0.8 |
| Wrist | 17.0 ± 5.7 | 16.0 ± 1.1 | 11.8 |
| Digit | 16.7 ± 7.0 | 15.5 ± 2.5 | 10.6 ± 0.4 |
| Intrinsic Hand | 17.3 ± 6.3 | 13.8 ± 0.5 | 14.1 ± 0.4 |
| All | 15.8 ± 6.4 | 15.9 ± 2.4 | 10.9 ± 1.9 |
| Magnitudes (ppd) | |||
| Shoulder | −12.5 ± 3.8 | −17.6 ± 12.1 | −39.0 |
| Elbow | −16.5 ± 6.0 | −16.4 ± 3.5 | −22.3 ± 13.6 |
| Wrist | −14.1 ± 3.2 | −16.5 ± 4.0 | −21.4 |
| Digit | −13.9 ± 4.2 | −13.9 ± 1.3 | −35.4 ± 15.7 |
| Intrinsic Hand | −12.4 ± 2.9 | −11.1 ± 4.2 | −16.5 ± 0.9 |
| All | −14.4. ± 4.6 | −15.9 ± 7.9 | −28.6 ± 14.7 |
Note: M1 data are based on PStEs that were present at both 15 and 60 μA. Values are means of latencies and magnitudes ± SD.
An additional M1 data set was established to investigate variations in the magnitude and latency of PStEs in moving forward from the anterior part of M1 on the surface of the hemisphere into PMd (Figs 2–4). For this analysis, only sites located on the anterior part of M1 and located medial to a line extending from the spur of arcuate sulcus were included in the data set (see arrows in Fig. 1 for precise location of the boundary). All the PStEs produced at a stimulation intensity of 60 μA were included in this analysis.
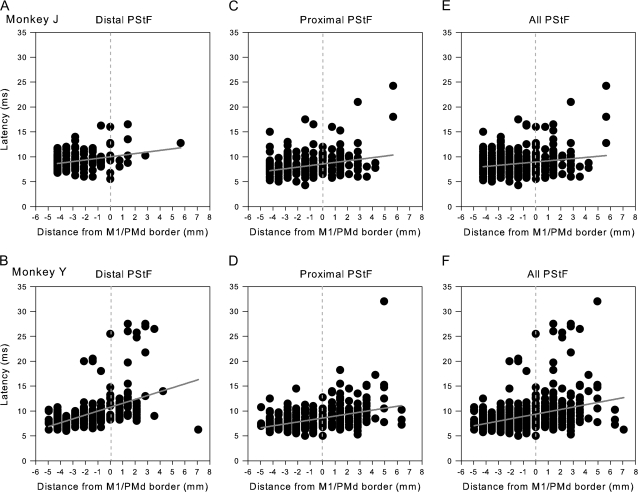
Figure 2.
Increasing latencies of PStF effects in moving from the convexity of the central sulcus to the most anterior part of PMd. Negative values on the axis correspond to sites located on the surface of the M1 forelimb representation, dotted lines at zero correspond to the boundary between PMd and M1 as represented in Figure 1, and positive values correspond to sites in PMd. Latency is plotted separately for distal joints (A, B), proximal joints (C, D), and all joints (E, F) in 2 monkeys (J and Y). Linear regression: (A) r2 = 0.09, P < 0.001; (B) r2 = 0.06, P < 0.001; (C) r2 = 0.09, P < 0.001; (D) r2 = 0.18, P < 0.001; (E) r2 = 0.05, P < 0.001;and (F) r2 = 0.15, P < 0.001. M1 data included all PStEs obtained at 60 μA from layer V sites on the surface of the cortex. For monkey J, N = 520 (N = 311 for proximal joints and N = 209 for distal joints). For monkey Y, N = 724 (N = 391 for proximal joints and N = 333 for distal joints).
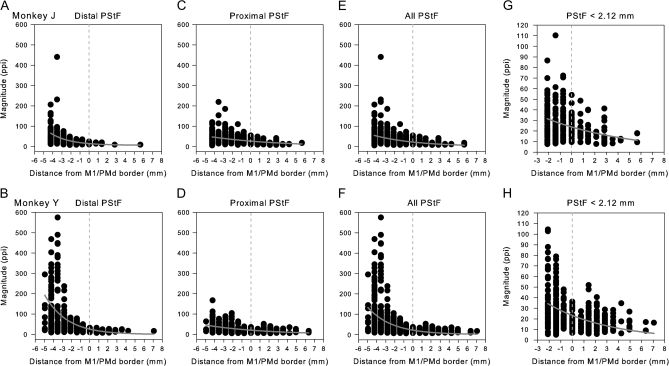
Figure 3.
Decreasing magnitude of PStF effects in moving from the convexity of the central sulcus in M1 to the most anterior part of PMd. Magnitude plotted separately for proximal joints, distal joints, and all joints in 2 monkeys. For better resolution, (G, H) are same data as (E, F) but restricting the M1 data to sites within 2.12 mm of the PMd border and expanding the vertical axis. Dotted lines at zero correspond to the boundary between PMd and M1 as represented in Figure 1; positive values correspond to sites in PMd. Nonlinear regression, exponential decay: (A) r2 = 0.18, P < 0.0001; (B) r2 = 0.28, P < 0.0001; (C) r2 = 0.12, P < 0.0001; (D) r2 = 0.20, P < 0.0001; (E) r2 = 0.13, P < 0.0001; (F) r2 = 0.21, P < 0.0001; (G) r2 = 0.11, P < 0.0001; and (H) r2 = 0.21, P < 0.001. Magnitude is expressed as ppi over baseline. Numbers of effects in A–D are the same as in Figure 2. (G) N = 263. (H) N = 395.
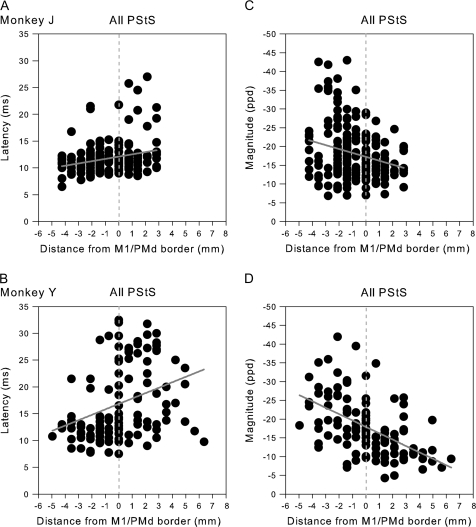
Figure 4.
Increasing latency (A, B) and decreasing magnitude (C, D) of PStS effects moving rostrally from M1 sites at the convexity of the central sulcus to the most proximal PMd sites in 2 monkeys. Dotted lines at zero correspond to the boundary between PMd and M1 as represented in Figure 1; positive values correspond to sites in PMd. Best-fit regression line was linear for all plots. (A) r2 = 0.06, P < 0.001; (B) r2 = 0.11, P < 0.001; (C) r2 = 0.07, P < 0.001; (D) r2 = 0.28, P < 0.001. Magnitude is expressed as ppd below baseline. N = 208 for monkey J and N = 117 for monkey Y.
ICMS to Evoke Movements
Motor output to body regions not implanted with EMG electrodes (face, trunk, and hindlimb) were identified using repetitive ICMS to evoke movements. ICMS consisted of a train of symmetrical biphasic stimulus pulses at a frequency of 330 Hz and intensity of 30–100 μA (Asanuma and Rosen 1972). Train duration was 100–500 ms (Graziano et al. 2002). Hindlimb and facial movements were evoked, respectively, in the most medial and lateral parts of M1 as described previously (Gentilucci et al. 1988; Park et al. 2001).
Histological Procedures
At the completion of neurophysiological testing, 1 monkey (monkey Y) underwent a final procedure in which ink tracks were placed stereotaxically into the forebrain as reference marks for reconstructing the location of motor areas and for subsequent histological analysis. The monkey was then given a lethal dose of sodium pentobarbital (Euthasol, 100 mg/kg of body weight) and perfused transcardially with 0.1 M phosphate buffered saline, followed by 10% buffered formalin fixative. The brain was removed, cryoprotected, and cut in coronal sections on a freezing microtome at 50 μm. Alternate sections were mounted on clean, subbed slides and stained for Nissl substance (cresyl violet acetate).
A neuroanatomical reconstruction system, consisting of a computer-interfaced microscope (Carl Zeiss, Inc., Maple Grove, MN) and associated software (Neurolucida; Microbrightfield, Inc., Colchester, VT), was used to record the location and diameter of layer V pyramidal cell bodies. One set of 12 cresyl violet–stained sections, 300 μm apart, was used to analyze pyramidal cell density and pyramidal cell size in relation to the M1–PMd border. Each large pyramidal neuron found on every sixth 50-μm section through the central M1–PMd border area was counted and measured for diameter. All measured cells contained a complete nucleus and/or had prominent apical and basal dendrites.
Soma diameters of pyramidal neurons in layer V were measured by averaging the length of the cell in the long axis and the width measured along a perpendicular through a point at maximum width. Using this criterion, we have defined “large pyramidal cells” as those with average maximal (length and width) diameters of greater than 25 μm. A total of 274 large pyramidal cells were counted and measured in 1 mm increments from both sides of the M1–PMd border. No corrections were made for tissue shrinkage.
Results
PStEs for this study were obtained from layer V of the gray matter in the motor areas of the left hemisphere in 2 rhesus monkeys. Data were collected from a total of 314 electrode tracks in PMd, PMv, and M1 covering the dorsal aspect of the frontal lobe and the anterior bank of the central gyrus (Table 1 and Fig. 1). Repetitive ICMS was performed at sites where no PStEs in forelimb muscles were obtained to identify motor output to the trunk, hindlimb, and face.
Boundary between M1 and PMd
We established the boundary between PMd and M1 to be ∼5 mm anterior to the central sulcus (gray zone in Fig. 1). This was based on a combination of criteria including latency, magnitude, and number of PStEs, pyramidal cell density, and boundaries established in previous studies (Dum and Strick 1991; He et al. 1993; Kurata and Hoffman 1994; Raos et al. 2003, 2004; Hoshi and Tanji 2006; Stark et al. 2007). These studies placed the boundary between M1 and PMd at 2 mm posterior to the end of the spur of the arcuate sulcus and/or 5 mm anterior to the central sulcus. This is in good agreement with our boundary placement and correlates well with transitions in the latency and magnitude of PStEs.
Figures 2–4 show the transition in latency and magnitude of PStEs in moving from sites on the surface of M1 toward more anterior sites in PMd. Negative numbers on the horizontal axis (distance) correspond to sites in M1 and positive numbers to sites in PMd. The dotted line at zero corresponds to the boundary between M1 and PMd indicated as the gray zone in Figure 1. Note that PStEs in the gray zone were not included in the PMd, PMv, or M1 databases. A gradual increase in latency and decrease in magnitude of PStF effects was observed in moving from sites in M1 toward sites in PMd (Figs 2 and 3). Some variability in M1 PStEs between the monkeys was noted. For example, the M1 representation of monkey Y was 1 mm longer in the anterior–posterior axis and was located more laterally in relation to the spur of the arcuate sulcus compared with monkey J (Fig. 1). Stronger magnitudes of PStF effects, particularly in distal muscles, were obtained from the surface portion of M1 in monkey Y compared with monkey J (Fig. 3A,B). In order to see the transition of PStEs around the border in greater detail, we replotted the data in Figure 3E,F with a different vertical axis after eliminating data in M1 that was greater than 2.12 mm from the border with PMd (Fig. 3G,H). The latency of PStEs in moving from M1 sites toward more anterior sites in PMd increased in both monkeys (Fig. 2) and followed a linear relationship (P < 0.0001). A significant exponentially decreasing relationship (P < 0.0001) between the magnitude of PStF effects and distance from M1 sites toward PMd sites was observed (Fig. 3).
Our histological results showed a gradual decrease in the density of large pyramidal cells in M1 approaching the PMd border. These observations are consistent with previous anatomical studies showing that retrogradely labeled giant pyramidal cells contributing to the corticospinal tract do not end abruptly but rather decrease gradually in crossing the M1–PMd border (Dum and Strick 1991; Galea and Darian-Smith 1994). The greatest number of large pyramidal neurons on the surface of M1 was adjacent to the central sulcus (convexity of the precentral gyrus). The distributions of pyramidal cell soma diameters in M1 and PMd were highly overlapping. However, the average diameter was significantly larger in M1 compared with PMd, particularly near the convexity of the central sulcus (Fisher's protected least significant difference, P < 0.05).
Properties of PStF Effects from M1
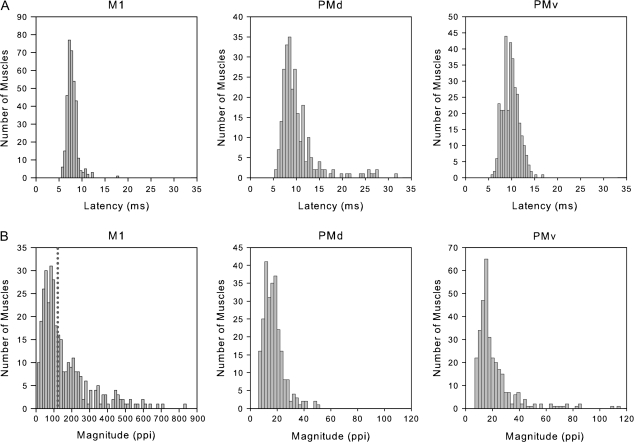
Figure 5A shows the distribution of PStF onset latencies for effects from PMd, PMv, and M1. PStF in M1 showed a narrow distribution compared with PMd and PMv with a peak in onset latency of 7.7 ± 1.2 ms (Table 3). Latencies from PMd and PMv were an average of 2.5 and 2 ms longer, respectively, than M1 (one-way analysis of variance, P < 0.0001). At 60 μA, the vast majority of PStEs obtained from M1 were PStF effects (97%) and most were in distal muscles (62%). This can be explained by the fact that most of the pure PStS effects present at 15 μA included a PStF effect when stimulation was applied at 60 μA.
Figure 5.
Distribution of onset latencies and magnitudes of PStF effects obtained at 60 μA from the forelimb representations of PMd, PMv, and M1. M1 data are based on PStF effects that were present at both 15 and 60 μA. Magnitudes are expressed as ppi over baseline. Note the difference in magnitude scales for M1 versus the graphs for PMd and PMv; the dotted line in the graph of M1 magnitude corresponds to the highest magnitude effect in the PMd and PMv histograms. N = 327 for PMd, N = 357 for PMv, and N = 340 for M1.
The magnitudes of PStF effects from M1 (Fig. 5B) were vastly stronger than those from PMd and PMv (P < 0.0001). M1 magnitudes had a mean ppi of 159 ± 140 at 60 μA and were 7- to 9-fold stronger than those for PMd and PMv (Table 3 and Fig. 5B). As described previously, M1 showed an increase in magnitude for each muscle group going from the most proximal to the most distal muscles (Park et al. 2004). This progressive trend was not present in PMd and PMv. All M1 PStF effects (46 effects) at 60 μA with magnitudes above 300 ppi were in distal muscles. Only 31 PStF effects from proximal joints had magnitudes above 105 ppi, and they all came from elbow flexor muscles (16 for BRA, 13 for BIL, and 2 for BIS).
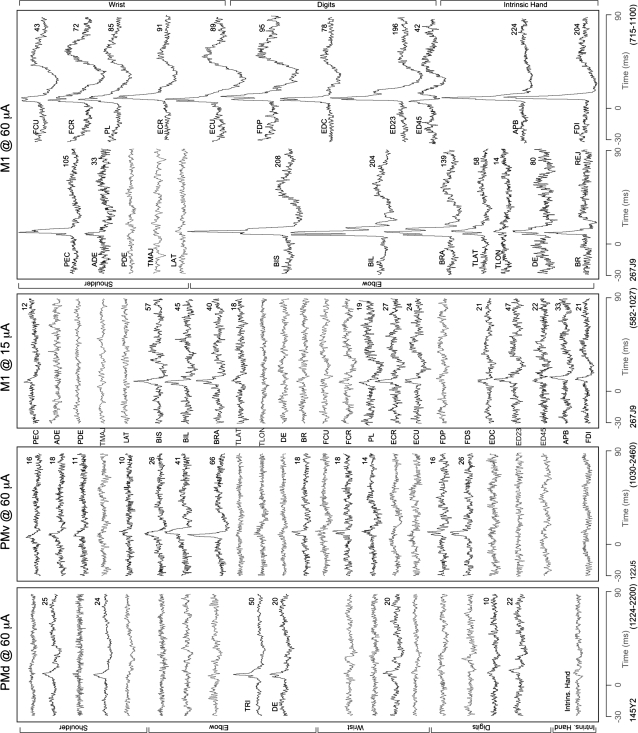
Figure 6 shows typical PStEs obtained at different joints from a given site in M1 at intensities of 15 and 60 μA. At 60 μA, the number of PStF effects in M1 expanded to include nearly all of the recorded muscles and their magnitudes increased by approximately 10-fold in some muscles. In comparison, stimulation of PMd and PMv at 60 μA yielded substantially fewer PStEs (7 and 12 muscles, respectively). All sites stimulated at an intensity of 60 μA on the surface of M1 showed cofacilitation of proximal and distal muscles with the exception of a few sites, where only distal or only proximal muscles were facilitated. As illustrated in Figure 6, this is due to considerable expansion in the number of PStEs at 60 μA compared with 15 μA. In Figure 6, the strongest PStF effects observed from PMd and PMv were 50 ppi (TRI) and 66 ppi (BRA), respectively.
Figure 6.
StTA of forelimb muscles from 1 site in PMd and 1 site in PMv at a stimulus intensity of 60 μA, and 1 M1 site at 2 different intensities, 15 and 60 μA. Time zero corresponds to the stimulus trigger event used for compiling the average. PStF effects were observed in muscles shown in bold, and records with no PStEs are unbolded. The range of number of trigger events for different channels is given in parenthesis. The number above each record is the magnitude of the PStE expressed as ppi over baseline.
Properties of PStF Effects from PMd
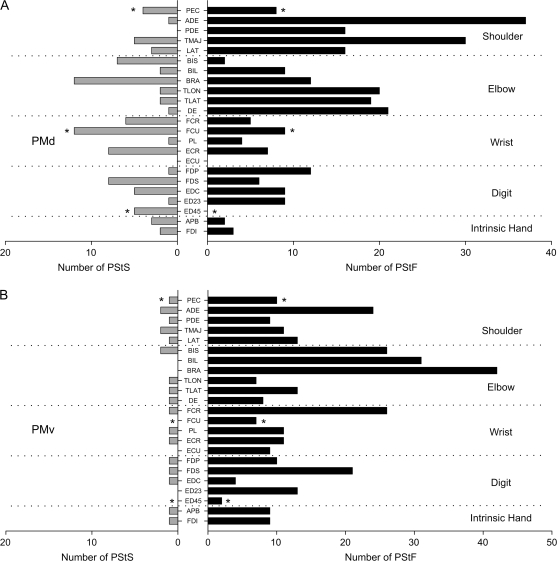
Three-quarters of PStEs from PMd were PStF effects and the majority of these came from proximal muscles. The most commonly observed PStF effects were in shoulder muscles (ADE and TMAJ; Table 2 and Fig. 7A). PStF from PMd had significantly longer latencies than those from PMv (P = 0.014; Table 3). The distribution of PStF latencies from PMd (Fig. 5A) was broader than PMv or M1 as reflected in a larger SD (Table 3). Comparison across joints revealed shorter latencies for shoulder muscles than distal muscles (P < 0.0002) that probably reflect a shorter conduction distance (Table 3). Additionally, latencies for elbow muscles were shorter than those for digit muscles (P < 0.0007). Although a few proximal muscles (DE and PEC) had PStF effects from PMd with onset latencies as short as the shortest latency effects from M1, this was clearly the exception rather than the rule. In distal muscles, the shortest latency effects from M1 in individual muscles were consistently shorter by 2–3 ms than those from PMd.
Figure 7.
Distribution of PStF (right) and PStS (left) in 23 muscles of the forelimb from stimuli applied to PMd (A) and PMv (B). The dotted lines separate muscles belonging to different joints. The asterisks on PEC, FCU, and ED 4, 5 indicate PStEs from monkey J only. For technical reasons (see Materials and Methods), in monkey Y, a combination of TLON and TLAT was used to form a triceps (TRI) EMG and a combination of FDI and APB was used to form an Intrins. EMG. To compensate for this, the total number of PStEs in the TRI and Intrins. records was divided by 2 and distributed equally in muscles labeled TLON and TLAT and in muscles FDI and APB, respectively. See Materials and Methods for muscle abbreviations.
PMd was the only area where PStF onset latencies greater than 20 ms were observed (Fig. 5A). When these effects were analyzed as a separate group, the average latency was 25.8 ± 2.8 ms. In the previous work (Boudrias et al. 2006), we reported that the distribution of onset latencies for PStF effects from SMA contained both short and long latency peaks with mean latencies of 15.2 ± 4.5 ms and 55.2 ± 7.2 ms, respectively. However, only 3 late PStF effects (mean latency of 52.1 ms) were observed from PMd and these were all from monkey Y. Because the mechanism of late PStF effects is unclear, these effects were excluded from the final data analysis and will not be discussed further in this study.
There was no difference in the magnitudes of PMd–PStF effects in different muscle groups and no difference when compared with effects from PMv (P = 0.90 and P = 0.55 respectively; Table 3). The strongest PStF effects (>27.5 ppi, 22 effects) all came from the proximal joints. TRI was the muscle showing the strongest PStF from PMd (ppi = 52). Additionally, there was a strong correlation between onset latency and magnitude of PStF effects in PMd (P < 0.0001).
Properties of PStF Effects from PMv
The great majority of PStEs from PMv were PStF effects (94%; Table 2). Among the PStF effects, 61% were in proximal muscles and 39% in distal muscles. The most commonly observed PStF effects were in elbow muscles (BRA and BIL; Fig. 7B). Latencies for proximal muscles were shorter than those for distal muscles (P < 0.0001). Intrinsic hand muscle latencies were significantly longer than any other muscle group (P < 0.0001). The shortest latency effects from PMv were as short as the shortest latency effects from M1 for several proximal muscles (PEC, DE, ADE, TRI, and TLON). However, as with PMd, this was not true of distal muscles where the shortest latency effects from M1 were consistently 2-3 ms shorter than the shortest latency effects from PMv.
Elbow muscles had greater magnitudes of PStF from PMv than shoulder, wrist, or digit muscles (P < 0.0001). Of the 11 strongest PStF effects obtained from PMv, 9 came from BRA and 2 from APB. These muscles had the strongest magnitudes (65–115 ppi) observed among all the secondary motor areas studied with StTA of EMG activity (Boudrias et al. 2006, 2009). There was a strong correlation between onset latency and magnitude of PStF effects from PMv (P < 0.0001).
Properties of PStS Effects
We compared PStS effects from PMd and PMv with PStS from M1 surface sites and to a random selection of M1 sites taken from both the surface and deep sites in the wall of the precentral gyrus. This database of randomly selected sites throughout the forelimb M1 representation was derived from 30 electrode tracks (Tables 1 and 2). In M1, the majority of pure PStS effects obtained at 15 μA also included a PStF effect (earliest effect) at 60 μA. In many of these cases, the PStEs were biphasic with strong early facilitation followed by later suppression. However, because of the difficulty in quantifying late suppression in biphasic effects, these effects were not measured. Only 11 pure PStS effects remained at 60 μA (Table 2) and, though the sample was small, these effects were used for the comparisons that follow. The mean latency of PStS effects from M1 was about 5 ms shorter than the mean latency from PMd and PMv (P < 0.03 and P < 0.008; Table 3). The mean PStS magnitude from M1 (−28.6 ± 14.7, ppd) was about 2-fold greater than the magnitude of PStS from PMd or PMv (P < 0.03). If the suppression in biphasic effects could have been unambiguously measured, it is likely that this difference would be greater. No differences in PStS latency or magnitude were observed when comparing PMd PStS effects to those from PMv (P = 0.96 and P = 0.37, respectively).
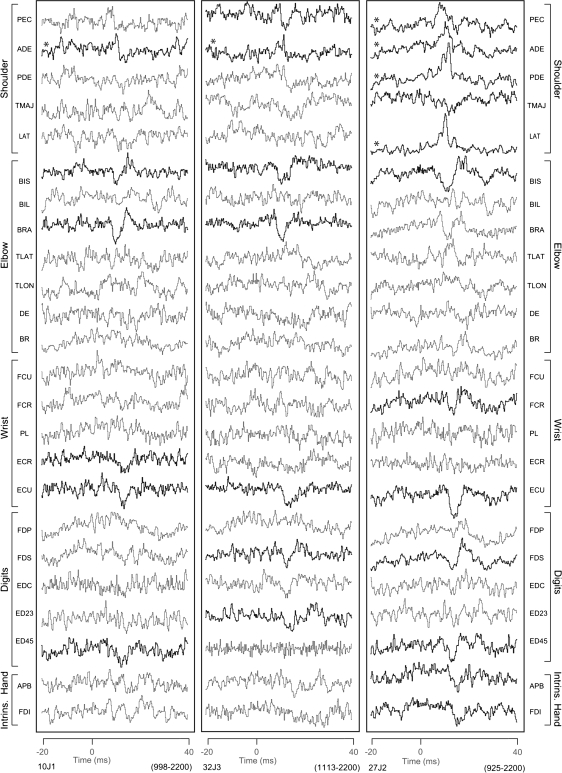
As noted above, we also compared PMd and PMv effects with M1 PStS effects obtained at 60 μA from sites in the anterior part of M1 located on the surface of the hemisphere. The majority of these PStS effects were located near the medial boundary of M1 and PMd. Once again, decreased magnitudes and increased latencies were observed for PStS effects in moving from M1 sites toward more anterior sites in PMd (P < 0.0005, Fig. 4). The mean latencies and magnitudes of these M1 surface PStS effects were 11.3 ± 2.1 ms and −19.5 ± 8.1 ppd for monkey J (N = 123) and 13.1 ± 4.7 ms and −22.1 ± 8.1 ppd for monkey Y (N = 46). The most medial portion of PMd extending 1–3 mm anterior to the boundary with M1 often yielded largely PStS effects in elbow, wrist, digit, and intrinsic hand muscles. Typical examples of PStS effects from 3 of these sites are illustrated in Figure 8. Although some PStF effects were observed in shoulder muscles, these sites and numerous others in this region yielded predominantly PStS effects.
Figure 8.
StTA (60 μA) of forelimb muscles from 3 PMd sites located 1–3 mm anterior to the boundary between M1 and PMd. Time zero corresponds to the stimulus event used for compiling the average. PStS effects were observed in muscles shown in bold, PStF effects are also in bold but marked with an asterisk, and no PStEs were observed in the unbolded records. The range in number of trigger events for different channels is given in parenthesis (lower right).
Proximal and Distal Muscle Representations in PMd and PMv
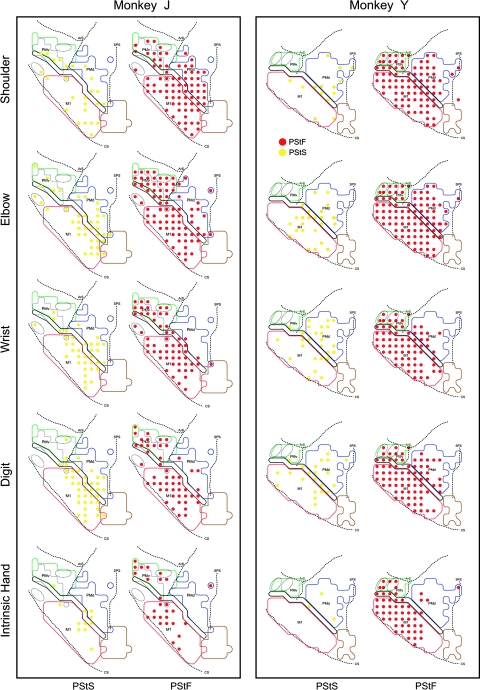
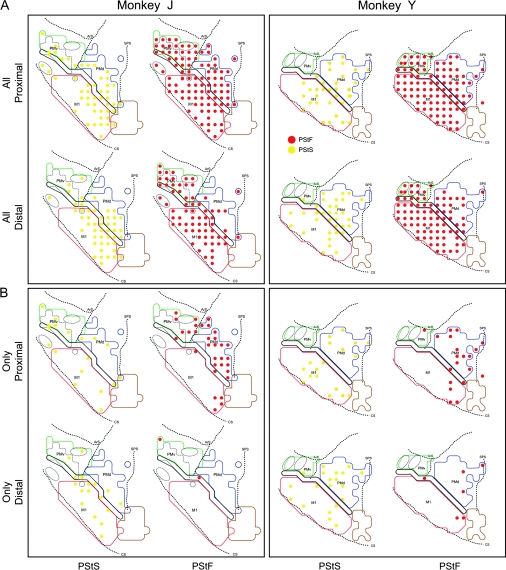
Motor output maps based on all PStEs at layer V sites revealed no clear segregation of proximal and distal muscle representations in PMd (Figs 9 and 10). Proximal muscles were predominantly represented in PMd (78% of all PStF effects; Table 2), particularly in monkey J, which showed 90% of PStF effects in proximal muscles. Also, a larger number of sites in PMd (30 sites from both monkeys) evoked only proximal muscle PStEs. In comparison, there were merely 3 sites where only distal muscle effects were evoked (monkey Y, Fig. 10B).
Figure 9.
Muscle output maps for PMd, PMv, and M1 obtained at 60 μA from 2 monkeys based on PStEs at 60 μA in shoulder, elbow, wrist, digit, and intrinsic hand muscles. PStF (red dots) and PStS (yellow dots) are shown in separate columns. The outlined regions in the background are the boundaries of PMd, PMv, and M1 carried over from Figure 1.
Figure 10.
Muscle output maps showing the representation of proximal and distal muscles for PMd, PMv, and M1 in 2 monkeys based on PStEs at 60 μA. (A) Sites where PStEs were obtained in both proximal and distal joints. PStF (red dots) and PStS (yellow dots) are shown in separate columns. (B) Sites where only proximal or only distal PStEs were present. The outlined regions in the background are the boundaries of PMd, PMv, and M1 carried over from Figure 1.
Motor output maps based on PStEs from PMv also failed to reveal a clear segregation of proximal and distal representations (Figs 9 and 10). As with PMd, proximal muscles were predominantly represented in PMv (61% of all PStF effects; Table 2). Two elbow muscles (BRA and BIL) were most frequently represented. At most sites in PMv, proximal and distal muscles were cofacilitated. Only 1 site showed facilitation limited to distal muscles (monkey J, Fig. 10B). As in PMd, a larger number of sites in both monkeys evoked effects limited to proximal muscles.
Representation of Individual Forelimb Muscles in PMd and PMv
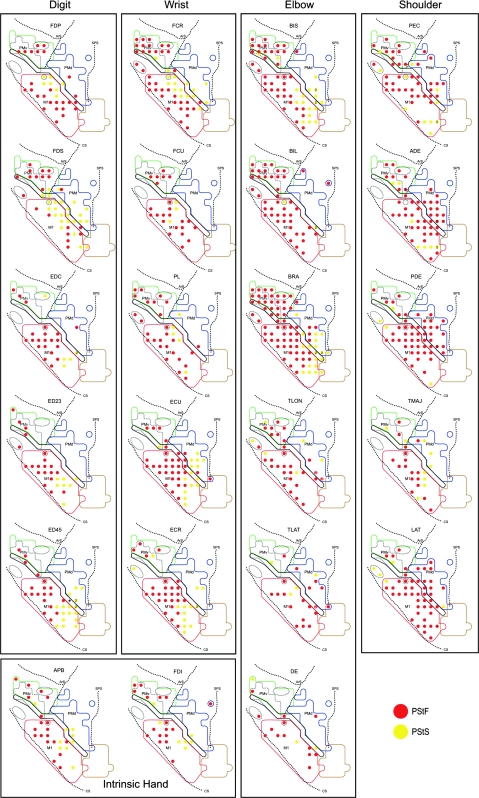
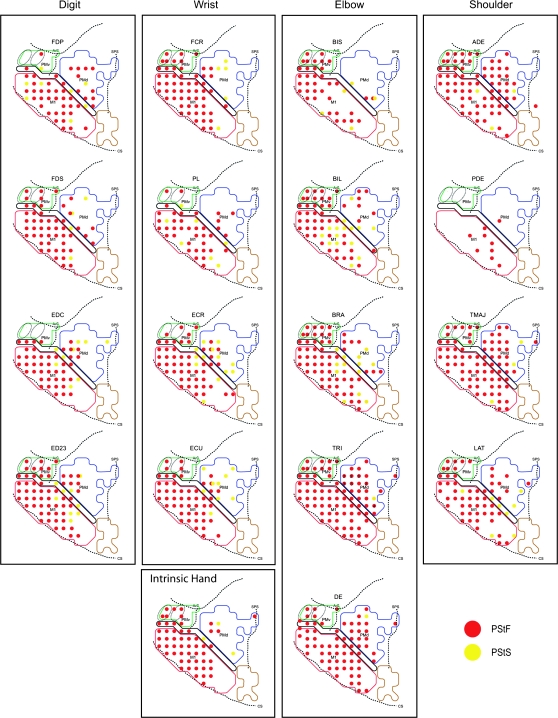
Motor output maps of individual forelimb muscles were constructed for PMd, PMv, and the anterior portion of M1 at 60 μA. Figures 11 and 12 show the individual muscle maps based on PStF and PStS effects for monkeys J and Y. We found no evidence in either monkeys to suggest segregation of areas representing different individual muscles or muscle groups. However, it was apparent that many muscles were suppressed from a core region located medially and/or rostrally to a core facilitatory region spanning the M1–PMd boundary (Figures 11 and 12). This core suppression region was present in both monkeys and involved muscles at all joints except the shoulder (monkey J: APB, FDS, ED 2, 3, ED 4, 5, EDC, FCR, ECU, ECR, BIS, and BRA; monkey Y: EDC, ED 2, 3, ECR, ECU, BIL, and BRA).
Figure 11.
Individual muscle representations for monkey J based on PStF and PStS effects obtained at 60 μA from PMd, PMv, and M1. Red dots indicate sites where PStF was elicited and yellow dots indicate sites where PStS was elicited. The outlined regions in the background are the boundaries of PMd, PMv, and M1 carried over from Figure 1.
Figure 12.
Individual muscle representations for monkey Y based on PStF and PStS effects obtained at 60 μA from PMd, PMv, and M1. Red dots indicate sites where PStF was elicited and yellow dots indicate sites where PStS was elicited. The outlined regions in the background are the boundaries of PMd, PMv, and M1 carried over from Figure 1.
Some variations existed in the representations of individual muscles between monkeys. For example, PDE was strongly represented in monkey J compared with monkey Y. This could not be easily attributed to differences in the strength of the EMG signals. Variations between monkeys also existed in the number of PStF effects from PMd. Monkey Y had more than twice the number of PStF effects from PMd (182 effects) compared with monkey J (74 effects). Differences were especially evident for the number of PStF effects obtained from distal joints. We found only 9 PStF effects in distal muscles from PMd in monkey J compared with 57 effects in monkey Y. Once again, this could not be attributed to differences in the strength of the EMG signals. However, proximal muscles were predominantly represented in PMd in both monkeys, with ADE showing the largest number of PStF effects in both monkeys (Fig. 7A). Additionally, PEC, PDE, and LAT in monkey J and TRI, TMAJ, and DE in monkey Y, were proximal muscles showing large numbers of PStF effects (Figs 11 and 12).
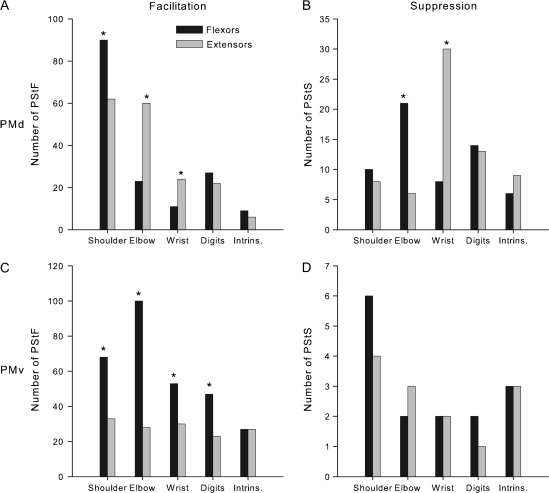
PMd and PMv showed joint-dependent differences in the representation of flexor and extensor muscles. After normalization for the number of flexor and extensor muscles recorded at each joint, PMd–PStF effects were more common in flexors of the shoulder and extensors of the elbow, whereas PStS was more common in flexors of the elbow and extensors of the wrist (Fig. 13A,B; chi-square test, P > 0.05). Overall, 57% of the PStF effects from PMd were in extensors muscles (excluding intrinsic hand muscles).
Figure 13.
Distribution of PStF (A–C) and PStS (B–D) from PMd and PMv in extensor (gray bars) and flexor muscles (black bars) of the shoulder, elbow, wrist, and digit muscles after normalizing for differences in the number of recorded flexor and extensor muscles present at each joint and for the total number of muscles recorded across all joints. Flexor–extensor differences at each joint were normalized to the muscle group (flexor or extensor) with the greater number of recorded muscles. The data were further normalized to 6 recorded muscles at each joint, which was the actual number recorded at the elbow joint. Intrinsic muscles FDI and APB are plotted as flexor and extensor, respectively. Significant differences (chi-square test, P < 0.05) are indicated with asterisks.
PStF effects from PMv were more common in flexor muscles at all joints although only the differences for the shoulder, elbow, and wrist muscles were consistent across both monkeys (chi-square test, P > 0.05). Overall, 67% of the PStF effects were in flexor muscles (excluding intrinsic hand muscles).
Discussion
There are 3 major findings from this study. First, despite the presence of some short latency PStF effects in proximal muscles, our results suggest that the bulk of corticospinal output from PMd and PMv differs fundamentally from M1 corticospinal output. The typical PStEs from PMd and PMv have longer onset latencies and are vastly weaker in magnitude than those from M1. In fact, PStEs obtained from M1 at a stimulus intensity of 15 μA were actually stronger than those from PMd and PMv obtained at 60 μA. Although there is a progressive increase in the magnitude of PStF from M1 along a proximal to distal muscle gradient (Park et al. 2004), this phenomenon was not evident for PMd or PMv. In addition, at 60 μA, a much larger number of muscles were activated from M1 compared with PMd or PMv.
Second, some elbow and shoulder muscles did have PStF effects from PMd and PMv with onset latencies as short as the shortest latency M1 effects in the same muscles. This supports the notion that at least some corticospinal neurons in PMd and PMv have linkages with proximal motoneurons that are as direct as those from M1. This was not true for distal muscles where the shortest latency effects from PMd and PMv were consistently 2–3 ms longer than the shortest latency effects from M1. The longer latency may be attributable to a less direct corticospinal linkage, connections through M1 or slower conducting corticospinal axons.
Third, the representation of distal and proximal muscles in PMd and PMv was completely overlapping with preferential representation of proximal muscles in both areas. In contrast, forelimb M1 shows an orderly somatotopic organization consisting of a core distal representation surrounded by a zone representing combinations of distal and proximal muscles and an outer zone representing only proximal muscles (Park et al. 2001). It is possible that activation of passing axons in PMd and PMv may have contributed to the lack of segregation of distal and proximal representations, but it seems that this should have also blurred the M1 distal and proximal representations.
Properties and Organization of PStEs from PMd
PMd onset latencies were longer and exhibited greater variability than those from M1. The latency of PStEs in StTAs of EMG activity reflects a combination of conduction distance, conduction velocity, and synaptic transmission in the anatomical pathway from the stimulation site to the muscle. Thus, the latencies of PMd effects reflect a more indirect coupling to motoneurons and/or slower corticospinal conduction velocity compared with M1. This suggests that a contribution of PMd corticospinal neurons to movement initiation and control may be through innervation of spinal interneurons influencing reflex and other spinal circuits rather than through direct input to the motoneurons. Lesion studies of PMd corroborate this view with most degenerating elements appearing in the intermediate zone of the spinal cord and few in the cervical motoneuron pools (Kuypers and Brinkman 1970). The vastly weaker magnitudes of PStF effects from PMd compared with those from M1 further support a largely indirect coupling from PMd to motoneurons. Our results suggest that the effects of PMd's corticospinal neurons on muscle activity are mainly achieved through innervation of interneurons in the intermediate zone of the spinal cord. Corticocortical connections with M1 may also make a significant contribution to PStEs from PMd.
The majority of the PStEs from PMd were distributed to proximal muscles. In particular, PMd effects were preferentially excitatory to extensors of the elbow, further supporting its role in reaching movements, which mainly involves muscles at the proximal joints (Kurata and Hoffman 1994; Luppino and Rizzolatti 2000). Proximal muscles were represented throughout the entire extent of PMd and showed a greater number of sites, where only PStEs in proximal muscles were obtained. The predominance of PStEs on proximal muscles agrees with previous anatomical studies (He et al. 1995) and with a recent extensive ICMS study of PMd (Stark et al. 2007).
The presence of PStEs in both proximal and distal muscles from the same cortical site agrees with anatomical data showing that corticospinal neurons in the forelimb area of PMd project to both upper and lower cervical segments of the spinal cord (He et al. 1993; Galea and Darian-Smith 1994). However, our data does not support a segregated representation of distal and proximal muscles in PMd as suggested by previous ICMS and anatomical studies (Dum and Strick 1991; He et al. 1993; Raos et al. 2003). We found that nearly all PMd sites cofacilitated distal and proximal muscles. This is in agreement with the extensive overlap of proximal- and distal-evoked movements reported by Godschalk et al. (1995) and the large overlap (31%) of high-density bins projecting to upper or lower cervical segments within PMd (He et al. 1995).
Properties and Organization of PStEs from PMv
Almost half of the PMv PStF effects obtained in our study came from distal muscles with APB showing magnitudes of PStF effects that were among the strongest ones observed from PMv. Cerri et al. (2003) and Shimazu et al. (2004) reported that PMv conditioning stimulation produces robust facilitation of stimulus-evoked M1 corticospinal output, particularly to hand and digit muscles, and this might be the primary mechanism by which it influences distal muscles. This conclusion is further supported by anatomical studies showing that PMv corticospinal neurons do not project sufficiently caudally in the cervical enlargement to reach the motor nuclei supplying hand muscles (He et al. 1993; Galea and Darian-Smith 1994). It is also supported by the finding that reversible inactivation of M1 with muscimol greatly reduces or abolishes stimulus-evoked EMG responses from PMv (Schmidlin et al. 2008). In view of these findings, it seems most likely that the PStF effects produced from PMv on distal muscles in our study are mediated predominantly through the heavy corticocortical connections that exist between the PMv and the M1 forelimb representations (Muakkassa and Strick 1979; Dum and Strick 2005; Dancause et al. 2006).
PMv contains only 2% of the total number of corticospinal neurons in the frontal lobe, and the density of its corticospinal neurons is the lowest among the secondary motor areas, although it is still 63% of the density found in M1 (Dum and Strick 1991). This seems contradictory to the fact that PMv produced the strongest output effects observed among all the secondary motor areas, particularly on elbow muscles (Boudrias et al. 2006). Our results suggest the presence of an effective linkage through M1 to motoneurons and that the facilitation of M1 output from PMv reported for hand muscles might be even more powerful for proximal muscles. In fact, PMv output to forelimb muscles had features that resembled M1 output, including the existence of a very narrow peak in the distribution of latencies with less variability than any of the other secondary cortical motor areas. PMv onset latencies were on average 2 ms longer than those from M1, which is in agreement with the transmission time of 1–3 ms from PMv to M1 reported in previous studies (Godschalk et al. 1984; Tokuno and Nambu 2000; Cerri et al. 2003). Detailed muscle- and joint-based maps did not show clear segregated representations of distal and proximal muscles. Neither was there a significant difference in the representations of individual muscles. This result is in agreement with the recent ICMS study of Stark et al. (2007), which showed a nearly equal representation of proximal and distal movements throughout PMv.
PMv is part of a corticocortical circuit that is essential for hand movements required for the manipulation of objects (Jeannerod et al. 1995; Rizzolatti et al. 1998). Our results support this functional role as the muscles involved in grasping movements are clearly represented within PMv. We found that flexor muscles of the elbow, wrist, and digits as well as intrinsic hand muscles were predominantly represented in PMv and were among the muscles showing the strongest magnitudes of PStF effects. Muscles of the elbow yielded the strongest average PStF from PMv. Proximal muscles were more commonly facilitated than distal muscles although cofacilitation of proximal and distal muscles was the predominant result at nearly all sites in PMv. Our data support a role for PMv in aspects of grasping that require multijoint coordination (Luppino and Rizzolatti 2000; Graziano et al. 2002), including both proximal and distal joints, rather than a role focused solely on distal muscles and strictly limited to grasp (Davare et al. 2006).
PStS Effects
For many distal muscles and elbow muscles, our maps based on individual muscle representations demonstrate the presence of a concentration of PStS effects around the boundary between M1 and PMd (Figs 11 and 12). This organization was particularly pronounced in monkey J. To our knowledge, this is the first evidence for a segregated core region producing PStS effects in relative isolation from PStF effects. The location of this inhibitory representation may correspond to the separate island of distal corticospinal neurons located medially within the M1 surface representation and to the segregated distal representation of corticospinal neurons located in PMd based on anatomical studies of He et al. (1993). The possible functional role of a segregated inhibitory zone is unknown. However, it might be linked to the control of excitability of motoneurons during the hold period of delayed movement tasks and/or the preparation for movements as reported in previous studies showing elevated activity of PMd neurons during these specific aspects of motor tasks (Weinrich and Wise 1982; Weinrich et al. 1984).
To date, there is no evidence for monosynaptic corticospinal inhibitory effects on motoneurons; an inhibitory neuron, interposed between the corticospinal neurons and the motoneurons, is always implicated. Latencies of PStS effects from PMd and PMv were approximately 6 ms longer than PStF latencies reflecting a less direct coupling than PStF effects (Table 3). They were also longer than the latencies of PStS from M1 suggesting a less direct synaptic linkage. The smaller soma size of PMd–PMv corticospinal neurons and potentially slower conduction velocities might also be a contributing factor (Dum and Strick 1991).
The magnitude of PStS effects from M1, selected from those present at both stimulus intensities of 15 and 60 μA, did not follow the pattern observed for PStF from M1 with steadily increasing magnitudes in going from the most proximal to the most distal muscles. The magnitude of PStS effects from PMd and PMv were half of those observed from M1. As with PStF effects on muscle activity, this suggests a more indirect coupling to inhibitory interneurons in the spinal cord and/or weaker direct input to interneurons compared with the more robust PStS effects from M1. Alternatively, PStS effects from PMv–PMd might also be mediated largely through connections with M1.
Comparison with Properties of SMA and Dorsal Cingulate Motor Area
Using the same approach as applied in this study, we have also investigated the properties of SMA and the dorsal cingulate motor area (CMAd; Boudrias et al. 2006, 2009). Table 4 is a summary comparison of the properties of the secondary motor areas relative to M1. The output properties of SMA and CMAd resembled those of PMd and PMv in that the magnitude of PStF was vastly weaker and the mean latency longer compared with PStF from M1. Unlike PMd and PMv, our CMAd data, although limited, suggested some spatial segregation of sites representing distal and proximal muscles. Spatial segregation of distal and proximal muscle representations was also evident for SMA. Unlike PMd and PMv, which preferentially represented proximal muscles, distal muscles were slightly more heavily represented in SMA output and much more heavily represented in CMAd output. All cortical motor areas including M1 showed preferential representation of flexor muscles at least at 1 joint. Note that because our sample of CMAd sites was limited, we have excluded it from this analysis. Elbow flexor muscles were preferentially represented in the output of PMv, SMA, and M1. PMd output favored shoulder flexors and elbow extensors. This pattern would be consistent with a preferential role in extending the arm forward in preparation for grasp. In comparison, PMv-favored flexor muscles at the shoulder and elbow—a pattern that would be consistent with trajectories required to move the hand toward the face. A similar pattern of flexor–extensor preference was observed for SMA except for shoulder muscles.
Table 4.
Comparison of M1 properties with those of secondary cortical motor areas
| M1 | PMd | PMv | SMA | CMAd | |
| PStF average magnitude (ppi at 60 μA) | Strong (158.8) | Weak (17.3)a | Weak (21.6) a | Weak (14.9) a | Weak (15.6) a |
| PStF average latency (ms) | 7.7 | 10.2 | 9.7 | 15.7 | 19.8 |
| Distal–proximal muscle preference (based on number of PStF obtained) b | D > P | P >> D | P > D | D > P | D > P |
| Distal–proximal muscle preference (based on magnitude of effects) | D >>> P | D = P | Variable | D = P | D > P |
| Flexor representation > extensor (based on number of PStF effects) c | Elbow | Shoulder | Shoulder, elbow, and wrist | Elbow | — |
| Extensor representation > flexor (based on number of PStF effects) c | — | Elbow | — | — | — |
| Spatially segregated distal and proximal muscle representations | Yes | No | No | Yes (?) | Yes (?) |
Note: D, distal muscles (wrist, digit, and intrinsic hand); P, proximal muscles (shoulder and elbow). Differences indicated were not only statistically significant, as indicated in Figure 13, but were also consistent in each of 2 monkeys tested. Based on this criterion, 2 significant effects in Figure 13 were omitted (PMd wrist PStF and PMv digit PStF). For CMAd, the sample size was too small to draw definitive conclusions. M1 results are based on data from Park et al. (2004). Although a simplification, PEC and ADE were categorized as shoulder flexors and PDE, TMAJ, and LAT as extensors. Comparisons across muscles are based on data normalized for differences in the number of muscles recorded.
7- to 11-fold weaker on average than M1.
Number of effects obtained = size of representation because each area was systematically mapped.
Muscle representation evaluated separately by joint.
Conclusion
Our results raise doubts about a major role of PMd–PMv corticospinal neurons in the direct control of forelimb motoneurons. PStEs from PMd and PMV have longer latencies and vastly weaker magnitudes than those from M1 suggesting the presence of additional synapses in the anatomical pathway for their actions on the motoneurons. Using the same approach as applied in this study of PMd and PMv, we came to similar conclusions regarding the output from SMA and CMAd to motoneurons (Boudrias et al. 2006, 2009). The lack of clear segregation of proximal and distal muscle representations and the absence of increasing magnitude of PStF effects in going from the most proximal to the most distal muscles are additional characteristics, shared among all secondary cortical motor areas, which stand in sharp contrast to M1. In conclusion, our results confirm the unique properties of M1 corticospinal neurons in the direct control of forelimb motoneurons. Under normal conditions, corticospinal output from secondary cortical areas is organized in a very different way from M1 corticospinal output. Whether this organization changes under pathological conditions, such as damage to M1, is unknown and remains for future studies.
Funding
National Institute of Health (NS39023, NS051825); National Institute of Health Center (HD02528); doctoral scholarship from Les Fonds de la Recherche en Santé du Québec (FRSQ6389).
Acknowledgments
We thank Dr Sang-Pil Lee of the Hoglund Brain Imaging Center for his technical assistance with acquisition and processing of imaging data. Conflicts of Interest: None declared.
References
- Asanuma H, Rosen I. Functional role of afferent inputs to the monkey motor cortex. Brain Res. 1972;40:3–5. doi: 10.1016/0006-8993(72)90098-4. [DOI] [PubMed] [Google Scholar]
- Boudrias MH, Belhaj-Saif A, Park MC, Cheney PD. Contrasting properties of motor output from the supplementary motor area and primary motor cortex in rhesus macaques. Cereb Cortex. 2006;16:632–638. doi: 10.1093/cercor/bhj009. [DOI] [PubMed] [Google Scholar]
- Boudrias MH, Sang-Pil Svojanovsky S, Cheney PD. Forthcoming 2009. Forelimb muscles representations and output properties of motor areas in the mesial wall of rhesus macaques. Cereb Cortex. doi: 10.1093/cercor/bhp136. [DOI] [PMC free article] [PubMed] [Google Scholar]
- Brodmann K. Vergleichende Lokalisationslehre der Grosshirnrinde in ihren Prinzipien dargestellt auf Grund des Zellenbaues. 1909. Leipzig (Germany): Johann A. Barth Verlag. [Google Scholar]
- Cerri G, Shimazu H, Maier MA, Lemon RN. Facilitation from ventral premotor cortex of primary motor cortex outputs to macaque hand muscles. J Neurophysiol. 2003;90:832–842. doi: 10.1152/jn.01026.2002. [DOI] [PubMed] [Google Scholar]
- Cheney PD, Fetz EE. Functional classes of primate corticomotoneuronal cells and their relation to active force. J Neurophysiol. 1980;44:773–791. doi: 10.1152/jn.1980.44.4.773. [DOI] [PubMed] [Google Scholar]
- Dancause N, Barbay S, Frost SB, Plautz EJ, Stowe AM, Friel KM, Nudo RJ. Ipsilateral connections of the ventral premotor cortex in a new world primate. J Comp Neurol. 2006;495:374–390. doi: 10.1002/cne.20875. [DOI] [PMC free article] [PubMed] [Google Scholar]
- Davare M, Andres M, Cosnard G, Thonnard JL, Olivier E. Dissociating the role of ventral and dorsal premotor cortex in precision grasping. J Neurosci. 2006;26:2260–2268. doi: 10.1523/JNEUROSCI.3386-05.2006. [DOI] [PMC free article] [PubMed] [Google Scholar]
- Dum RP, Strick PL. The origin of corticospinal projections from the premotor areas in the frontal lobe. J Neurosci. 1991;11:667–689. doi: 10.1523/JNEUROSCI.11-03-00667.1991. [DOI] [PMC free article] [PubMed] [Google Scholar]
- Dum RP, Strick PL. Frontal lobe inputs to the digit representations of the motor areas on the lateral surface of the hemisphere. J Neurosci. 2005;25:1375–1386. doi: 10.1523/JNEUROSCI.3902-04.2005. [DOI] [PMC free article] [PubMed] [Google Scholar]
- Frost SB, Barbay S, Friel KM, Plautz EJ, Nudo RJ. Reorganization of remote cortical regions after ischemic brain injury: a potential substrate for stroke recovery. J Neurophysiol. 2003;89:3205–3214. doi: 10.1152/jn.01143.2002. [DOI] [PubMed] [Google Scholar]
- Galea MP, Darian-Smith I. Multiple corticospinal neuron populations in the macaque monkey are specified by their unique cortical origins, spinal terminations, and connections. Cereb Cortex. 1994;4:166–194. doi: 10.1093/cercor/4.2.166. [DOI] [PubMed] [Google Scholar]
- Gentilucci M, Fogassi L, Luppino G, Matelli M, Camarda R, Rizzolatti G. Functional organization of inferior area 6 in the macaque monkey. I. Somatotopy and the control of proximal movements. Exp Brain Res. 1988;71:475–490. doi: 10.1007/BF00248741. [DOI] [PubMed] [Google Scholar]
- Godschalk M, Lemon RN, Kuypers HG, Ronday HK. Cortical afferents and efferents of monkey postarcuate area: an anatomical and electrophysiological study. Exp Brain Res. 1984;56:410–424. doi: 10.1007/BF00237982. [DOI] [PubMed] [Google Scholar]
- Godschalk M, Mitz AR, van Duin B, van der Burg H. Somatotopy of monkey premotor cortex examined with microstimulation. Neurosci Res. 1995;23:269–279. doi: 10.1016/0168-0102(95)00950-7. [DOI] [PubMed] [Google Scholar]
- Graziano MS, Taylor CS, Moore T. Complex movements evoked by microstimulation of precentral cortex. Neuron. 2002;34:841–851. doi: 10.1016/s0896-6273(02)00698-0. [DOI] [PubMed] [Google Scholar]
- He SQ, Dum RP, Strick PL. Topographic organization of corticospinal projections from the frontal lobe: motor areas on the lateral surface of the hemisphere. J Neurosci. 1993;13:952–980. doi: 10.1523/JNEUROSCI.13-03-00952.1993. [DOI] [PMC free article] [PubMed] [Google Scholar]
- He SQ, Dum RP, Strick PL. Topographic organization of corticospinal projections from the frontal lobe: motor areas on the medial surface of the hemisphere. J Neurosci. 1995;15:3284–3306. doi: 10.1523/JNEUROSCI.15-05-03284.1995. [DOI] [PMC free article] [PubMed] [Google Scholar]
- Hoshi E, Tanji J. Differential involvement of neurons in the dorsal and ventral premotor cortex during processing of visual signals for action planning. J Neurophysiol. 2006;95:3596–3616. doi: 10.1152/jn.01126.2005. [DOI] [PubMed] [Google Scholar]
- Jeannerod M, Arbib MA, Rizzolatti G, Sakata H. Grasping objects: the cortical mechanisms of visuomotor transformation. Trends Neurosci. 1995;18:314–320. [PubMed] [Google Scholar]
- Kurata K, Hoffman DS. Differential effects of muscimol microinjection into dorsal and ventral aspects of the premotor cortex of monkeys. J Neurophysiol. 1994;71:1151–1164. doi: 10.1152/jn.1994.71.3.1151. [DOI] [PubMed] [Google Scholar]
- Kuypers HG, Brinkman J. Precentral projections to different parts of the spinal intermediate zone in the rhesus monkey. Brain Res. 1970;24:29–48. doi: 10.1016/0006-8993(70)90272-6. [DOI] [PubMed] [Google Scholar]
- Luppino G, Rizzolatti G. The organization of the frontal motor cortex. News Physiol Sci. 2000;15:219–224. doi: 10.1152/physiologyonline.2000.15.5.219. [DOI] [PubMed] [Google Scholar]
- Maier MA, Armand J, Kirkwood PA, Yang HW, Davis JN, Lemon RN. Differences in the corticospinal projection from primary motor cortex and supplementary motor area to macaque upper limb motoneurons: an anatomical and electrophysiological study. Cereb Cortex. 2002;12:281–296. doi: 10.1093/cercor/12.3.281. [DOI] [PubMed] [Google Scholar]
- Muakkassa KF, Strick PL. Frontal lobe inputs to primate motor cortex: evidence for four somatotopically organized ‘premotor’ areas. Brain Res. 1979;177:176–182. doi: 10.1016/0006-8993(79)90928-4. [DOI] [PubMed] [Google Scholar]
- Park MC, Belhaj-Saif A, Cheney PD. Chronic recording of EMG activity from large numbers of forelimb muscles in awake macaque monkeys. J Neurosci Methods. 2000;96:153–160. doi: 10.1016/s0165-0270(00)00155-2. [DOI] [PubMed] [Google Scholar]
- Park MC, Belhaj-Saif A, Cheney PD. Properties of primary motor cortex output to forelimb muscles in rhesus macaques. J Neurophysiol. 2004;92:2968–2984. doi: 10.1152/jn.00649.2003. [DOI] [PubMed] [Google Scholar]
- Park MC, Belhaj-Saif A, Gordon M, Cheney PD. Consistent features in the forelimb representation of primary motor cortex in rhesus macaques. J Neurosci. 2001;21:2784–2792. doi: 10.1523/JNEUROSCI.21-08-02784.2001. [DOI] [PMC free article] [PubMed] [Google Scholar]
- Porter R, Lemon RN. Corticospinal function and voluntary movement. Oxford: Clarendon Press; 1993. [Google Scholar]
- Raos V, Franchi G, Gallese V, Fogassi L. Somatotopic organization of the lateral part of area F2 (dorsal premotor cortex) of the macaque monkey. J Neurophysiol. 2003;89:1503–1518. doi: 10.1152/jn.00661.2002. [DOI] [PubMed] [Google Scholar]
- Raos V, Umilta MA, Gallese V, Fogassi L. Functional properties of grasping-related neurons in the dorsal premotor area F2 of the macaque monkey. J Neurophysiol. 2004;92:1990–2002. doi: 10.1152/jn.00154.2004. [DOI] [PubMed] [Google Scholar]
- Rizzolatti G, Luppino G, Matelli M. The organization of the cortical motor system: new concepts. Electroencephalogr Clin Neurophysiol. 1998;106:283–296. doi: 10.1016/s0013-4694(98)00022-4. [DOI] [PubMed] [Google Scholar]
- Schmidlin E, Brochier T, Maier MA, Kirkwood PA, Lemon RN. Pronounced reduction of digit motor responses evoked from macaque ventral premotor cortex after reversible inactivation of the primary motor cortex hand area. J Neurosci. 2008;28:5772–5783. doi: 10.1523/JNEUROSCI.0944-08.2008. [DOI] [PMC free article] [PubMed] [Google Scholar]
- Shimazu H, Maier MA, Cerri G, Kirkwood PA, Lemon RN. Macaque ventral premotor cortex exerts powerful facilitation of motor cortex outputs to upper limb motoneurons. J Neurosci. 2004;24:1200–1211. doi: 10.1523/JNEUROSCI.4731-03.2004. [DOI] [PMC free article] [PubMed] [Google Scholar]
- Stark E, Asher I, Abeles M. Encoding of reach and grasp by single neurons in premotor cortex is independent of recording site. J Neurophysiol. 2007;97:3351–3364. doi: 10.1152/jn.01328.2006. [DOI] [PubMed] [Google Scholar]
- Tokuno H, Nambu A. Organization of nonprimary motor cortical inputs on pyramidal and nonpyramidal tract neurons of primary motor cortex: an electrophysiological study in the macaque monkey. Cereb Cortex. 2000;10:58–68. doi: 10.1093/cercor/10.1.58. [DOI] [PubMed] [Google Scholar]
- Weinrich M, Wise SP. The premotor cortex of the monkey. J Neurosci. 1982;2:1329–1345. doi: 10.1523/JNEUROSCI.02-09-01329.1982. [DOI] [PMC free article] [PubMed] [Google Scholar]
- Weinrich M, Wise SP, Mauritz KH. A neurophysiological study of the premotor cortex in the rhesus monkey. Brain. 1984;107(Pt 2):385–414. doi: 10.1093/brain/107.2.385. [DOI] [PubMed] [Google Scholar]


