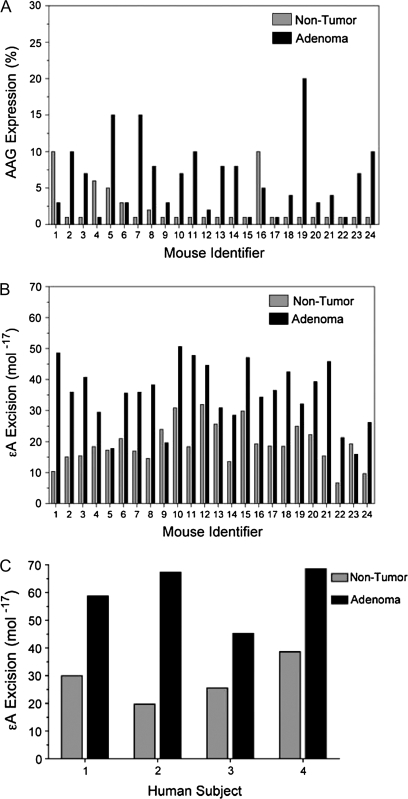
Fig. 6.
AAG expression and activity are increased in colon adenomas from ApcMin/+ mice and humans. (A) The expression of AAG was analyzed in non-tumor (gray) and adenoma (black) pairs from 24 mice by IHC. Figure shows expression of AAG as a percent of stained tissue compared with that unstained. The mean percentage of tissue staining positive (±SEM) was 6.5 ± 1.0 in adenoma tissue compared with 2.25 ± 0.56 in paired non-tumor tissue (P = 0.0007). (B) Activity of AAG for εA was analyzed in non-tumor and adenoma tissues from the same mice as above. The mean activity was 19.1 × 10⁻¹⁷ mol/mg (±6.5) of protein for non-tumor tissue and 35.2 × 10⁻¹⁷ mol/mg (±10.1) of protein for tumor tissue (P = 3.5 × 10⁻⁸). (C) Human colon adenomas have elevated AAG activity (black) compared with normal colon tissues from the same patient (gray). The mean activity (±SEM) was 28.5 × 10⁻¹⁷ mol/mg (±4.0) of protein for non-tumor tissue and 60.0 × 10⁻¹⁷ mol/mg (±5.4) of protein for tumor tissue (P = 0.003). Protein extracts (2 μg) were incubated with εA-containing DNA (50 pM) for 2 h at 37°C (Materials and Methods).

