Abstract
Background
Trauma caused by motorcycle-related injuries is extensive, expensive and increasing. Recent American literature reported that in 2004 the chance of a motorcyclist dying was 34 times greater than that for someone using any other motor vehicle for every mile travelled. In the United Kingdom a motorcyclist is killed or seriously injured every 665 894 km, compared with 18 661 626 km for cars. If this pattern is repeated in Canada, then this information should be in the public domain to support initiatives for injury prevention.
Methods
We gathered and analyzed retrospective population data on the injury patterns of adult motorcyclists and other adult motor vehicle drivers and passengers across Alberta from Apr. 1, 1995, to Mar. 31, 2006. We collected data from 3 Alberta sources: the Alberta Trauma Registry, the Alberta Office of the Chief Medical Examiners and the Government of Alberta Department of Infrastructure and Transportation. We compared the numbers and causes of crashes, injuries and deaths, as well as the acute care costs on the roads, and specifically compared motorcycle-related injuries to all other motor vehicle–related injuries.
Results
There were 70 605 registered motorcycles and 2 748 204 other registered motor vehicles in Alberta during the study period. During these 11 years, there were 286 motorcyclists killed and 712 were severely injured, representing a total of 998 injuries and deaths. There was 5386 deaths related to other motor vehicles and 6239 severe injuries, for a total of 11 625 injuries and deaths. This represents a percentage of 1.4% of all registered motorcycles and 0.4% of all other registered motor vehicles (3.5 times more motorcyclist injuries). The impact on the health care system can be measured in several ways. During the period of this study, motorcyclists accounted for 10 760 bed days. Assuming the patient was not admitted to intensive care, each admission cost Can$9200 (average in 2008).
Conclusion
Analysis of the data shows that motorcyclists are more than 3.5 times more likely to get injured or die than other motor vehicle drivers. All of the injuries in motorcyclists occurred during the summer months, leading to an adjusted risk of almost 8 times compared with that of the motor vehicle driver.
Abstract
Contexte
Les traumatismes subis lors d’accidents de la route impliquant des motocyclettes sont graves et coûteux, et leur nombre augmente. Selon la littérature américaine récente, en 2004, le risque de mourir des suites d’un accident de la route était 34 fois plus grand chez les motocyclistes que chez les occupants de n’importe quel autre type de véhicule à moteur pour chaque mille parcouru. Au Royaume-Uni, un motocycliste se tue ou se blesse grièvement à chaque 665 894 km parcouru, contre 18 661 626 km pour les occupants d’une automobile. Si l’on applique ce modèle au Canada, ce type d’information devrait appartenir au domaine public et soutenir les initiatives de prévention des accidents.
Méthodes
Nous avons recueilli et analysé des données de population rétrospectives concernant les types de blessures subies par les motocyclistes adultes et les conducteurs et passagers d’autres véhicules motorisés sur le territoire de l’Alberta entre le 1er avril 1995 et le 31 mars 2006. Nous avons recueilli les données auprès de trois sources albertaines : soit le Registre de traumatologie de l’Alberta, le Bureau des coroners en chef de l’Alberta et le ministère albertain des Infrastructures et du transport. Nous avons comparé le nombre d’accidents et leur cause, les traumatismes et les décès, de même que le coût des soins aigus associés aux accidents de la route, et plus spécifiquement, les blessures infligées lors d’accidents impliquant des motocyclettes d’une part et tous les autres véhicules motorisés, de l’autre.
Résultats
Nous avons recensé 70 605 motocyclettes et 2 748 204 autres véhicules motorisés enregistrés en Alberta au cours de la période de l’étude. Pendant ces 11 années, nous avons dénombré 286 décès et 712 blessures graves chez les motocyclistes, ce qui représente en tout 998 traumatismes et décès. Nous avons dénombré 5386 décès et 6239 blessures graves par suite d’autres accidents de la route, pour un total de 11 625 traumatismes et décès. Cela représente un pourcentage de 1,4 % de toutes les motocyclettes enregistrées et de 0,4 % de tous les autres véhicules motorisés enregistrés (3,5 fois plus de blessures chez les motocyclistes). L’impact sur le système de santé se mesure de plusieurs façons. Durant la période de cette étude, les motocyclistes ont accaparé 10 760 jourslits d’hôpital. En supposant que le patient n’est pas admis aux soins intensifs, chaque admission coûte 9200 $ CAN (moyenne pour l’année 2008).
Conclusion
L’analyse des données montre que les motocyclistes sont 3,5 fois plus susceptibles de subir une blessure ou de mourir lors d’un accident de la route, comparativement aux conducteurs d’autres types de véhicules motorisés. Toutes les blessures subies par les motocyclistes sont survenues durant les mois d’été, donnant lieu à un risque rajusté près de 8 fois plus grand comparativement aux conducteurs d’autres types de véhicules motorisés.
Trauma caused by motorcycle crashes is extensive, expensive and increasing. Recent American literature has shown that more people than ever are purchasing motorcycles, particularly more middle-aged men.1 The same study reported in 2004 (using 4 databases, including the fatality analysis reporting system and figures from the motorcycle industry in the United States) that the chance of a motorcyclist dying was 34 times greater than for someone using any other motor vehicle for every mile travelled. Motorcycle ownership in the over-40 age group has increased dramatically, and the authors cite changes in marketing practice, increased social acceptance, increasing fuel prices, increased availability of disposable income and decreased insurance rates as reasons for this.1 A recent article by Hinds and colleagues2 showed that in the United Kingdom a motorcyclist is killed or seriously injured every 665 894 km compared with 18 661 626 km for cars.
Several studies show that in Europe and Australia the peak age for injury is the late teens and early 20s, but the risk of collision decreases with increasing age.3 Zambon and Hasselberg4 looked at socio-economic groups and found that for motorcyclists aged 17–19 years, the rate of injury (both minor and severe) in lower income groups was 2.5 times greater than for those in higher socio-economic groups. Harrison and Christie5 noted that older motorcyclists tended to ride for recreation and on weekends, and that riders who do so infrequently have a higher crash risk. Nakahara and colleagues6 noted that injuries sustained while intoxicated peaked around midnight and were more prevalent in the 20–39 age group.
In a very similar study, Pang and colleagues7 found that motorcyclists formed the highest group of fatalities on Malaysian roads. The main cause of fatalities was head injury, whereas lower limb injuries accounted for most admissions to hospital. Keng8 found that female motorcyclists tended to sustain worse injuries, as did the motorcyclists colliding with stationary objects.
There is little information reported in the literature on the long-term effects of motorcycle crashes on people. In a study from Miami, Hotz and colleagues9 reported that more than 50% of patients, at 1 year postinjury, still had some degree of physical deficiency and reported significant changes in their quality of life. Just over 25% had gone back to motorcycling at 1 year postinjury, and from a helmeted rate of 56% at injury, the rate was now 92%. There is some evidence to support the theory that larger engines are more dangerous, but the relation is not consistent.10
We proposed to gather data and report on severe and fatal injuries among people injured in motor vehicle and motorcycle crashes in the province of Alberta during an 11-year period from Apr. 1, 1995, to Mar. 31, 2006. The primary objective of this study was to describe the epidemiology of severe trauma generated by motorcycle crashes compared with injuries sustained in all other motor vehicle crashes (MVCs), allowing calculation of the percentage of motorcycle crashes. We hypothesized that motorcycle riders account for a costly and greater incidence of traumatic injuries in Alberta relative to trauma associated with other MVCs, and that the crashes demonstrate a seasonal pattern.
Methods
This study was a population-based retrospective review and analysis of data gathered from 3 different databases in the province of Alberta. The focus of the data was people injured on motorcycles and those injured in other motor vehicles. Sources of data included the Alberta Trauma Registry, the Alberta Office of the Chief Medical Examiner and the Government of Alberta Department of Infrastructure and Transportation. In Alberta, major trauma data are collected in the Alberta Trauma Registry at Foothills Medical Centre, the Alberta Children’s Hospital, the Royal Alexandra Hospital and the University of Alberta Hospital. Major trauma patients are who that are admitted to hospital or who die in the emergency department. The inclusion criterion for entry into the Alberta Trauma Registry is an Injury Severity Score (ISS) of 12 or greater. The ISS is an injury coding system; the higher the number, the more severe the injuries. The Alberta Trauma Registry collated and provided the major trauma data for this project from Apr. 1, 1995, to Mar. 31, 2006. The Alberta Office of the Chief Medical Examiner provided data on deaths in the province, including fatalities outside a major trauma centre. We obtained data on the number of registered motor vehicles and licensed drivers from the Government of Alberta Department of Infrastructure and Transportation. We obtained ethical approval for the study from the review board of the University of Calgary. For this project, the inclusion criteria included drivers aged 18 years or older who were involved in a motorcycle crash or other motor vehicle crash and were fatally injured and/or had an ISS of 12 or greater. Our exclusion criteria were patients whose injuries scored less than ISS 12 and patients who were younger than 18 years.
The main outcome measurement was the number and severity of motorcycle-related injuries compared with all other motor vehicle–related injuries. We analyzed data to assess possible patterns of injury, severity of injury and physiologic consequences, percentage of the number of incidents and the injuries sustained, and the number of deaths that occurred in the motorcyclist population compared with other motor vehicle drivers. A secondary outcome measurement was a comparison of the costs in resources as a result of these crashes.
As this study was retrospective, there were no implications for recruitment rate. We collected and collated data into 3 broad groups:
Patient demographics: age, sex, driver or passenger, type of motorcycle, whether performing their job, insurance, alcohol ingestion, helmeted or wearing other protection (e.g., leathers).
Incident demographics: time, day of week, geographical location, recreational motorcycling, other vehicles involved.
Injury demographics: body systems involved, Abbreviated Injury Scale codes, blunt and penetrating trauma, significant head or chest pathology, number of long-bone fractures, days spent in intensive care, days spent in hospital and discharge destination.
Results
The data we collected were on a population of 3 million people for the province (2001 data) over 11 years. Table 1 shows the number of patients involved in severe and fatal injuries involving motorcycles and all other motor vehicles.
Table 1.
Population of patients in all motorcycle and motor vehicle crashes
| Characteristic | Severe and fatal injuries involving motorcycles, n = 998 | Severe and fatal injuries involving other motor vehicles, n = 11 625 |
|---|---|---|
| Injury severity, no. (%) | ||
| Fatal | 286 (29) | 5386 (46) |
| Severe, ISS ≥ 12 | 712 (71) | 6239 (54) |
| Dead at scene, % | ~20 | ~40 |
| Sex, % | ||
| Male | 91 | 68 |
| Female | 9 | 32 |
ISS = Injury Severity Score.
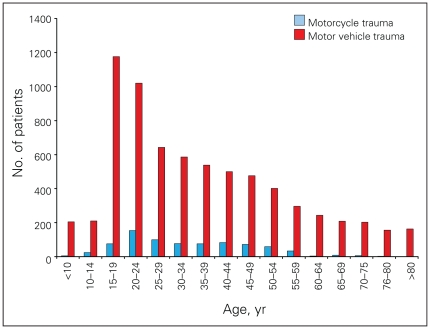
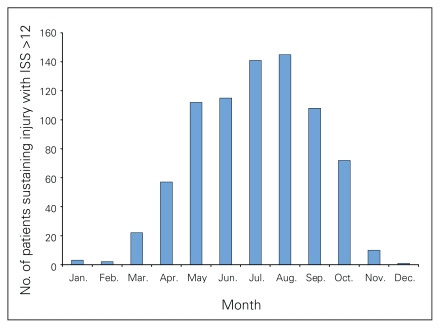
Figure 1 shows an identifiable peak noted in trauma related to other motor vehicles in patients in their late teens and early 20s. This peak diminishes in trauma related to other motor vehicles, whereas the number of injuries and deaths in the motorcyclist population remains constant until the age of 50. This trend appears to mirror the findings of the US-based National Highway Traffic Safety Administration study,1 which stated that increasing numbers of middle-aged men were purchasing motorcycles. It is important to note that 98% of the motorcycle-related injuries and deaths occur from March to October (Fig. 2).
Fig. 1.
Comparison of age among patients injured in motorcyle and other motor vehicle crashes.
Fig. 2.
Seasonal variation of motorcycle-related trauma. ISS = Injury Severity Score.
Table 2, Table 3 and Table 4 give important demographic data regarding the dead and injured. The number dead represents the number of deaths at the scene combined with the number of patients who died in the emergency department. It is notable from Table 1 that a much larger proportion of the patients involved in MVCs die at the scene of the accident compared with those involved in motorcycle crashes: about 40% compared with about 20%.
Table 2.
Demographics of patients with severe injuries related to motorcycles and other motor vehicles
| Vehicle | Variable, no.* | |||
|---|---|---|---|---|
| Patients with severe injuries | ICU† | Operating room visits | Days‡ | |
| Motorcycle | 712 | 315 | 919 | 10 680 |
| Motor vehicle | 6 239 | 3 035 | 6 412 | 93 585 |
| Motorcycle/MV, % | 11.4 | 10 | 14 | 11.4 |
ICU = intensive care unit; MV = motor vehicle.
Unless otherwise indicated.
Can$2856/d in ICU (average in 2008).
Can$1200/d in hospital (average in 2008).
Table 3.
Demographics comparing motorcycle and other motor vehicle crashes resulting in severe injuries and death
| Vehicle | No. of patients with severe injuries | No. dead | % dead of total |
|---|---|---|---|
| Motorcycle | 712 | 286 | 29 |
| Motor vehicle | 6239 | 5386 | 46 |
Table 4.
Percentage of patients with an Injury Severity Score ≥ 12 or dead, of all registered vehicles
| Vehicle | No. of patients with ISS ≥ 12 or dead | No. of registered vehicles | % dead or severely injured |
|---|---|---|---|
| Motorcycle | 998 | 70 605 | 1.4 |
| Motor vehicle | 11 625 | 2 748 204 | 0.4 |
ISS = Injury Severity Score.
Inevitably, there was a very small percentage of patients who were not picked up by the databases, and also some of the patients treated were from outside the province. Given the large numbers in each cohort, this should not significantly affect the results and would be balanced between provinces. Motorcyclists are 3.5 times more likely to be injured or to die than a belted driver. Adjusting for summer months (no winter motorcycle riders), motorcycle riders are 7 times more likely to be injured or killed.
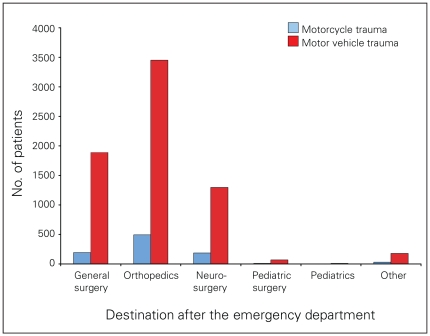
Of motorcycle crashes, 98% occur between March and October, whereas MVCs have a relatively constant rate throughout the year (Fig. 2). The majority of the trauma is treated by 3 main surgical specialties: 52% orthopedics, 28% general surgery and 20% neurosurgery (Fig. 3).
Fig. 3.
Destination of patients with motorcycle- or motor vehicle–related trauma after the emergency department.
During an 11-year period, 712 of these motorcyclists were admitted to hospital. This translates to about 65 patients each year, or 11 per month across the province during the summer months. On average, 2 of these patients required intubation and admission to the intensive care unit at a significant cost. There were 898 operating room visits for motorcyclists, which translates to 81 operating room slots per year, or 13 per month during the summer months.
Assessing the inpatient stay and using the median length of stay (i.e., 11–20 = 15 d), motorcycle-related injuries account for 10 680 days in hospital over the 11 years or 166 bed days per month during the summer months. Each admission costs about Can$8630 (average in 2005), assuming the patient doesn’t go to intensive care. This translated to 87 bed days per month for orthopedics (52%), 46 bed days for general surgery (28%) and 33 bed days for neurosurgery (20%).
The emergency departments in the province do not routinely collect data on alcohol ingestion unless there is felt to be a clinical reason to do so. The database of the medical examiner, however, showed that of the 193 motorcyclists who died at the scene, 55 were legally intoxicated, and 9 of these also had high serum levels of recreational drugs.
Discussion
A recent motorcycle epidemiology study based in the United States showed that if a 21- to 24-year-old motor-cyclist is on the road at 4:00 am on Saturday, he or she is 45 000 times more likely to be injured than if travelling in any other motor vehicle11 (Table 4).
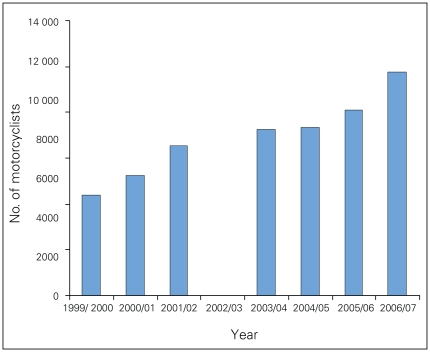
Whereas the age group 20–29 has the highest absolute death rate, the high-risk rider is now felt to be older than 40. Historically, motorcycle sales started to decline from 1985 to hit a low in about 1992. Since then, sales have risen to be higher than the 1985 figure. During the 10-year period of this study, motorcycle registration increased by 40%. Sales have increased 128% in 10 years, with a 35% increase in the proportion of more powerful motorcycles (> 749 cm3). This compares with our data from the Alberta Vehicle Registry Office in which we found that the number of motorcycles registered has more than doubled in the last 10 years, and the number of people passing the motorcycle test has increased dramatically in the last year12 (Fig. 4) (Table 5).
Fig. 4.
Number of motocyclists passing the motorcycle test per year. Note: No data were collected for the year 2002/03.
Table 5.
Alberta statistics for registered vehicles as of Mar. 31 of each year
| Registered vehicles, no. | 1998 | 1999 | 2000 | 2001 | 2002 | 2003 | 2004 | 2005 | 2006 | 2007 |
|---|---|---|---|---|---|---|---|---|---|---|
| Motorcycles* | 33 240 | 36 024 | 37 989 | 41 697 | 45 490 | 49 587 | 55 702 | 58 692 | 62 118 | 70 605 |
| Motorized vehicles | 2 038 687 | 2 099 676 | 2 154 278 | 2 219 569 | 2 296 748 | 2 341 679 | 2 379 910 | 2 459 926 | 2 589 973 | 2 748 204 |
| Licensed motorcyclists | 172 574 | 178 050 | 182 312 | 187 230 | 193 820 | 199 054 | 204 444 | 210 151 | 218 129 | 229 173 |
| Licensed operators | 2 072 831 | 2 127 437 | 2 179 779 | 2 230 082 | 2 289 828 | 2 338 469 | 2 364 402 | 2 394 917 | 2 456 906 | 2 542 094 |
Motorcycle counts are for highway use and exclude off-highway motorcycles and dirt bikes.
Along with the increase in sales, there has been a parallel increase in mortality rates: in 2003, motorcycles accounted for 8.6% of all motor vehicle–related fatalities. Interestingly, almost all of the increased mortality has involved motorcycles less than 4 years old (78.1%). The number of motorcycles sold between 2000 and 2003 accounts for 42.4% of all motorcycles registered in 2003. This implies that either the newer motorcycles are ridden more often (the “thrill of the new”) or that the riders are less experienced with their new motorcycles. The opposite has been seen with other motor vehicles.12
Riders are at greatest risk of death in the first 3 years of motorcycle riding (78% of all fatalities). In our study, 30% of fatalities involved alcohol, which is the same as data from the Office of the Medical Examiner in the United States.1
Bried and colleagues13 in 1987 looked at the demographics of motorcycle-related trauma in Tucson, Arizona. They report 71 admissions with average age 26, of which 79% were male and 24% legally intoxicated. Sixty-six percent of the patients required surgical intervention, and the average hospital stay was 13 days. The authors calculated that the overall cost of treatment was $16 408 per patient or $1 148 572 for the year. Treatment of patients with head injuries cost $21 945 per patient, and treatment of patients without head injuries cost $11 941 per patient. Stutts and colleagues14 looked at the characteristics of crashes in older motorcyclists. There are increased fatalities in patients older than 35 and less in patients aged 16–24 years.
However, as shown in Table 4, motorcycling is almost 4 times more dangerous than other forms of transport. Without adjusting the data, during the 11-year study period there were almost 4 times the number of crashes involving motorcycles than other MVCs (when considering the relative number of licenses issued). This number doubles if one considers that there are virtually no crashes during the 6 months of winter.
Finally, we acknowledge that the costs enumerated are only those of delivering health care in the trauma centre. The emotional costs, the costs of losing a family member and the costs of an injured person being unable to work for months or years are incalculable. The effects of long-term disability have not been considered.
Acknowledgement
The authors thank Barb Hinman for acquisition of data during the course of this study.
Footnotes
Competing interests: None declared.
Contributors: Drs. Monk and Buckley and Ms. Dyer designed the study, acquired and interpreted the data, wrote and reviewed the article, and approved the article for publication.
References
- 1.National Highway Traffic Safety Administration. Recent trends in fatal motorcycle crashes: an update. Washington: National Highway Traffic Safety Administration, US Department of Transportation; 2006. [(accessed 2009 Sept. 30)]. Available: www-nrd.nhtsa.dot.gov/Pubs/810606.PDF. [Google Scholar]
- 2.Hinds JD, Allen G, Morris CG. Trauma and motorcyclists: Born to be wild, bound to be injured. Injury. 2007;38:1131–8. doi: 10.1016/j.injury.2007.06.012. [DOI] [PubMed] [Google Scholar]
- 3.Elliott MA, Baughan CJ, Sexton BF. Errors and violations in relation to motorcyclists’ crash risk. Accid Anal Prev. 2007;39:491–9. doi: 10.1016/j.aap.2006.08.012. [DOI] [PubMed] [Google Scholar]
- 4.Zambon F, Hasselberg M. Socioeconomic differences and motorcycle injuries: age at risk and injury severity among young drivers. A Swedish Nationwide Cohort Study. Accid Anal Prev. 2006;38:1183–9. doi: 10.1016/j.aap.2006.05.005. [DOI] [PubMed] [Google Scholar]
- 5.Harrison WA, Christie R. Exposure survey of motorcycling in New South Wales. Accid Anal Prev. 2005;37:441–51. doi: 10.1016/j.aap.2004.12.005. [DOI] [PubMed] [Google Scholar]
- 6.Nakahara S, Chadbunchachai W, Ichikawa M, et al. Temporal distribution of motorcycle injuries and risk of fatalities in relation to age, helmet use and riding whilst intoxicated in Khon Kaen, Thailand. Accid Anal Prev. 2005;37:833–42. doi: 10.1016/j.aap.2005.04.001. [DOI] [PubMed] [Google Scholar]
- 7.Pang TY, Umar RS, Harwant S. Vulnerability of the lower limb in non-fatal motorcycle injuries. Med J Malaysia. 2001;56(Suppl D):9–11. [PubMed] [Google Scholar]
- 8.Keng SH. Helmet use and motorcycle fatalities in Taiwan. Acc Anal Prev. 2005;37:349–55. doi: 10.1016/j.aap.2004.09.006. [DOI] [PubMed] [Google Scholar]
- 9.Hotz GA, Cohn SM, Mishkin D, et al. Outcome of motorcycle riders at one year post-injury. Traffic Inj Prev. 2004;5:87–9. doi: 10.1080/15389580490269227. [DOI] [PubMed] [Google Scholar]
- 10.Langley J, Mullin B, Jackson R, et al. Motorcycle engine size and risk of moderate to fatal injury from a motorcycle crash. Accid Anal Prev. 2000;32:659–63. doi: 10.1016/s0001-4575(99)00101-3. [DOI] [PubMed] [Google Scholar]
- 11.Editorial. Calgary Herald. 2007 Jan 25;:C.4. [Google Scholar]
- 12.Paulozzi LJ. The role of sales of new motorcycles in a recent increase in motorcycle mortality rates. J Safety Res. 2005;36:361–4. doi: 10.1016/j.jsr.2005.07.002. [DOI] [PubMed] [Google Scholar]
- 13.Bried JM, Cordasco FA, Volz RG. Medical and economic parameters of motorcycle-induced trauma. Clin Orthop Relat Res. 1987;(223):252–6. [PubMed] [Google Scholar]
- 14.Stutts J, Foss R, Svoboda C. Characteristics of older motorcyclists crashes. Annu Proc Assoc Adv Automot Med. 2004;48:197–211. [PMC free article] [PubMed] [Google Scholar]


