Abstract
Background
Controversy exists about the conditions effecting the development of FOXP3 expressing T cells and their relevance in transplant recipients.
Methods
We generated CFSE-labeled CD4+CD25highFOXP3+ cells in MLRs (‘the Treg MLR’), with varying HLA disparities and cell components. Five color flow cytometry and 3H TdR uptakes were the readouts.
Results
1) Despite lower Stimulation Indices (SI) than 2 DR-mismatched MLRs, 2 DR-matched MLRs generated >2 fold higher percentages when gating on proliferating CD4+CD25highFOXP3+ cells; 2) Even with low numbers of proliferating cells, autologous and HLA identical MLRs generated the highest FOXP3+ : FOXP3- cell ratios; 3) Elimination of either non-CD3+ responding cells (resulting in ‘direct presentation’ only) or responding CD25+ (Treg generating) cells increased the SI but inhibited proliferating CD4+CD25HighFOXP3+ cell development; 4) MLR-generated CD4+CD25HighFOXP3+ cells added as third components specifically inhibited the same freshly set MLR SI and caused recruitment of new CD4+CD25HighFOXP3+ cells. As an example of the ‘Treg MLR’ immune monitoring potential, addition of third component PBMC containing high percentages of CD4+CD25highFOXP3+ cells from an HLA identical kidney transplant recipient (in a tolerance protocol) caused donor-specific Treg MLR inhibition/recruitment. This was similar to the third component MLR Tregs generated entirely in vitro.
Conclusion
In the ‘Treg MLR’, the generation of CD4+CD25High FOXP3+ cells is more pronounced in the context of self-recognition (HLA matching, indirect presentation). These cells can be assayed for MLR inhibitory and Treg recruitment functions, so as to immunologically monitor allo-specific regulation after transplantation.
Keywords: Mixed lymphocyte reaction, Immune monitoring assay, Human Tregs, FOXP3+ cells
Introduction
The detection of the intracellular transcription-like molecule, FOXP3 in experimental animals has been associated with functional (in vitro and in vivo) T immunoregulatory cell (Treg) effects (1). However, there has been a lack of clarity regarding FOXP3 expressing T cells in humans, especially in organ transplant recipients, in which their meaning in peripheral blood and in organ transplant biopsies, often during rejection episodes, is not clear. This ambiguity includes the interpretation of variable immunoregulatory effects that occur in vitro (2). For instance, in vitro generation of human FOXP3+ putative Tregs was reported to develop in the context of both anti-CD3 and alloimmune mixed lymphocyte reaction (MLR) activation (3). Also, even naïve CD4+ cells transiently express FOXP3 without activation (4). These reports have not attempted to discriminate several experimental variables affecting Treg generation.
We therefore reasoned that the in vitro generation of FOXP3 expressing CD4+ T cells after exposure to an allogeneic stimulus in the MLR would be a suitable place to understand defined conditions that might affect their appearance and function, in contrast with other reports (3,5). The assay might then be used in immune monitoring after transplantation. In this regard 1) alloimmune vs. autologous reactivity, 2) the importance of activation/mitogenesis and proliferation, 3) the degree of responder/stimulator histocompatibility, 4) direct vs. indirect antigen presentation 5) in vitro functional assessment of these MLR generated Tregs (immunophenotypically CD4+CD25+ FOXP3+ CD127-) as third components causing inhibitory allospecificity and “infectious” recruitment are all presented in this study.
Conditions affecting Treg generation in MLR and the effects of adding third components to the assay to inhibit SI and recruit Tregs were analyzed, first in HLA DR matched and mismatched unrelated healthy human volunteers, and then in HLA genotypically identical donor/recipient sibling pairs before renal transplantation. Finally, third component pre- and post- renal transplant PBMC obtained from recipients in an HLA identical tolerance protocol were tested for inhibition/recruitment in donor specific immune monitoring assays. Our goal was therefore to define conditions so as to use this novel ‘Treg MLR’ in the prospective immunological follow-up of transplant recipients.
Materials and Methods
MLR Responder and Stimulator Cell Donors and HLA Typing
The research was conducted on human subjects with the approval of the Northwestern Institutional Review Board. The peripheral blood donors selected for unidirectional MLR analysis were: 1. Twenty-two unrelated healthy laboratory volunteer pairs with molecularly defined matches or mismatches at the HLA DR loci; 2. Four pre- and one post-renal transplant donor/recipient sibling pairs with molecularly defined genotypic HLA identity. In several experiments with the volunteers the cultures were prepared in sets of three: the responding cells of one were added to stimulating cells of a 2 DR matched vs. 2 DR mismatched pair member. In the HLA identical pre- and post-transplant donor/recipient pairs, the combinations consisted of both pair members tested against each other and also vs. an indifferent 2 DR mismatched laboratory volunteer.
PBMC Isolation, Unidirectional MLR Culture Preparation and Responding Cell Subset Immunoselection
Peripheral blood mononuclear cells (PBMC) were isolated from heparinized whole blood on Ficoll-Hypaque gradients. Pairs of CFSE labeled responding and non-CFSE labeled x-irradiated stimulating PBMC (see below) were co-cultured using complete media consisting of RPMI 1640 with 15% normal human AB serum, 2 mM L-glutamine, 10 mM Hepes and 1 × pen/strep/glutamine solution (GIBCO-BRL, Gaithersburg, MD). Stimulating cells were irradiated with 3000 RADS in a Gamma cell 40 Cesium 137 source (Nordia). Three cell concentrations were utilized: 1) 1 × 10⁵ stimulating and 1×10⁵ responding cells in 0.2 ml/well using 96 well plates; 2) 5 × 10⁵ or 1 × 10⁶ responding and 5×10⁵ or 1×10⁶ stimulating cells respectively in 1 or 2 ml/well, using 48 or 24 well plates; 3) 40×106 responding and stimulating cells respectively in 40 ml cultures in T-75 flasks. Cultures were incubated at 37°C in a 5% CO2 humidified atmosphere for 1, 3, 5, 7 and 9 days before processing. In addition, autologous assays using stimulator/responder cell combinations from the same individual were performed simultaneously.
To analyze the effect of direct vs. indirect antigen presentation on MLR Treg generation, negative selection with immunobeads (Miltenyi Biotech) removed either CD3- cells, which included antigen presenting cells (APC), from the responding cell populations, thereby increasing the CD3+ purity to >98%. Also, CD25+ cells were similarly depleted from the responding cell population leaving CD25- cells with 99% purity. These selected responder cells were cocultured in similar concentrations to those described above.
Cryopreservation and Thawing of PBMC for MLR Assays
An NIH approved tolerance inducing protocol is being conducted at this center which involves storage of large quantities of recipient and donor PBMC for monitoring immune regulation post-operatively. Consequently recipient PBMC obtained by pretransplant leukopheresis, as well as the negative (or ‘bypass) fraction obtained after the isolation of mobilized CD34+ hematopoetic stem cells from the leukopheresed donor, were purified by Ficoll-Hypaque gradient centrifugation and cryopreserved in 10% Dimethyl-sulphoxide under liquid nitrogen. These cells were then thawed and used as responders, stimulators or third component modulators in MLR.
Flow Cytometry Protocols and Analyses
Cells were tested at 1, 3, 5, 7 and 9 days in culture by immunophenotyping for surface markers CD3, CD4, CD8, CD25, and CD127 with monoclonal antibodies directly conjugated with one of four fluorochromes, i.e., fluoroscein isothiocyanate (FITC), phycoerythrin (PE), phycoerythrin-cyanin 5 (PC5) and phycoerythrin-cyanin 7 (PC7) (Beckman-Coulter, Miami, FL), and intracellular FOXP3 using PE-conjugated FOXP3 kits (eBiosciences) following the manufacturers instructions. They were washed, read in a 5-color FC500 flow cytometer (Beckman-Coulter, Miami, FL) and analyzed for 1×10⁵ cellular events. Isotype controls were used to determine background fluorescence.
Assessment of Proliferation
Responding cell proliferation was measured by 3H-thymidine (3H-TdR) incorporation and by CFSE labeling (5-7). In each experiment 3H-TdR was estimated as a check on proliferation seen by CFSE. For 3H-TdR uptake, 1×10⁵ responding (CFSE labeled) cells were stimulated with 1×10⁵ irradiated cells (3000 Rads) in triplicate. On day 5, 7, and 9, 1 uCi 3H-TdR was added to each well and after 18 hr, the cultures were processed using a Tomtec cell harvester (Hamden, CT). Radioactive incorporation was measured using a Packard-Beta counter (Meriden, CT). The SI were calculated using the formula: CPM in experimental combinations / CPM in autologous control combinations. As a control for proliferative ability, 5ug of PHA (Invitrogen) was added to 1 × 10⁵ (non-irradiated) responder cells of each individual, and 3H-TdR was added 18 hours before culture processing at day 3. For CFSE labeling, this reagent was added to the cell preparations as per the manufacturer's instructions with a labeling efficiency of >99%.
Assessment of Regulatory Functions
1. MLR inhibition
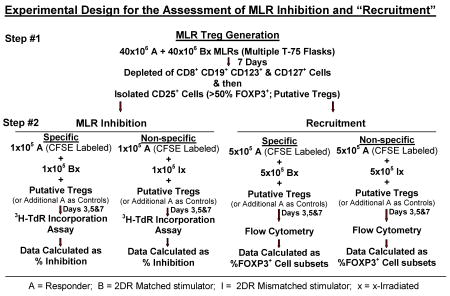
For alloantigen specific functional assessment, first Tregs were generated in bulk MLR, in which 40×106 responder cells were stimulated with 40×106 irradiated stimulator cells in multiple T-75 flasks at 1×10⁶ cells/ml concentrations. After 7 days the CD25High CD127- cells were enriched using the Regulatory T cell Isolation Kit and AutoMACS (Miltenyi Biotech), resulting in >98%CD25High CD127- cells that were >50% FOXP3+. This enriched Treg population was added as (third component) modulator cells (50,000; 20,000; 8,000; 3,200; 1,280; 512 cells) to measure specific inhibition on freshly prepared MLRs identical to the HLA matched/mismatched MLRs that initially generated this population (flow diagram below). Similar numbers of fresh x-irradiated or unirradiated autologous responder cells were added as comparative controls. After the culture times described above, 1 uCi 3H-TdR was added and 18 hr later the cultures were harvested and the radioactive incorporation was measured. The percentage inhibition by the third component Tregs was calculated using the formula: 1 - [CPM in presence of Treg modulators (unirradiated) / CPM in presence of additional (fresh) autologous responders] × 100.
2. “Infectious” Treg MLR recruitment
After isolation by AutoMACS described above, 1×10⁵ non-CFSE labeled CD4+CD25High CD127- Tregs (generated in 2 DR matched MLR) were added as third components to 5×10⁵ cells each of freshly prepared CFSE labeled responder vs. (non-labeled) specific or non-specific (2 DR matched and mismatched, respectively) x-irradiated stimulator pairs in MLR (see flow diagram above). As controls, third component modulator cells also consisted of similar numbers of freshly drawn uncultured responder cells. The percentages of newly CFSE labeled CD4+CD25High FOXP3+ (fresh) responding cells generated in culture (recruitment) were measured by flow cytometry after 3, 5 and 7 days.
When adapted as an immune monitoring assay of functional Treg assessment, step #1 of the flow diagram was substituted by third component putative Tregs added as PBMC obtained pre- and 1 year postoperatively from a kidney transplant recipient. These cells were added to cryopreserved-thawed preparations of recipient and donor cells tested in the Treg MLR readout as in step #2 of the flow diagram. The PBMC for this readout had been stored preoperatively when large cell numbers were made available from preoperative leukopheresis of donor and recipient PBMC in accordance with an NIH sponsored tolerance protocol.
Statistical Methods
Data were analyzed using univariate and graphical methods wherever applicable. Nonparametric (Wilcoxon signed rank test) statistical methods were used to compare paired groups. Statistical significance was established at a two-sided alpha level of 0.05 using SAS 9.1 statistical software (SAS Inc., Cary, NC).
Results
The Effect of Class II HLA Compatibility on Treg Generation
Representative experiments are shown in Figures 1 and 2. Figure 1A shows that dead cells were gated out by forward and side scatter. Viable cells were then analyzed. As expected, the overall number of proliferating cells was significantly lower in the 2 DR-matched vs. the 2 DR mismatched combinations, both by 3H-TdR uptake (SI) and CFSE dilution (Figure 1A, 2A and 2B). Despite this, the ratio of (total CD4+) CD25+FOXP3+ to CD25+ FOXP3- cells of the 2 DR matched MLRs was much higher than that of the 2 DR mismatched MLRs, i.e. 5.6%:2.6% vs. 10%:27% respectively (comparing the right and left upper quadrants of the dot blots on the right, Figure 1B). Also, there were many more FOXP3+ cells that were CD127+ in the 2 DR-mismatched MLRs (dot blots in the middle, Figure 1B). Moreover, when those ratios were focused on the proliferating cell fraction rather than on the entire culture, even with lower SI and cell proliferation by CFSE stain shift, there were greater overall ratios of FOXP3+ : FOXP3- and CD25+ : CD25- cells in the 2 DR matched vs. the 2 DR mismatched MLRs (Figures, 2A and 2B). This latter finding could especially be seen in the CD25HighFOXP3+ high intensity staining subset of CD4+ proliferating cells. Table 1A illustrates the peak SI and CD4+CD25High FOXP3+ cells in proliferating kinetics in each of the 8 experiments (responder vs. 2 DR matched and 2 DR mismatched). In each experiment the FOXP3+ cell subset percentage showed an inverse relationship between Class II mismatches and SIs. Even though in the Table the means ± SD of only the CD25High are depicted, the same findings occurred with each of the CD4+ FOXP3+ subpopulations (not shown).
Figure 1. Scheme of flow analysis of a representative experiment (day 7 shown here).
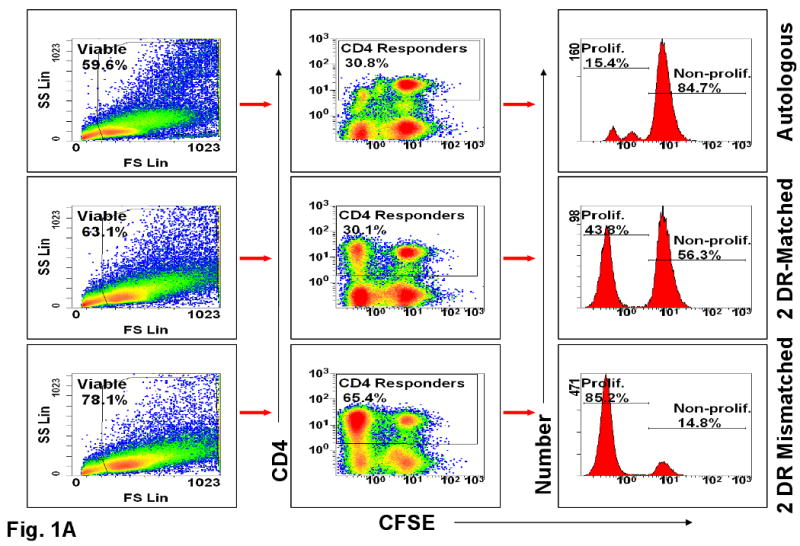
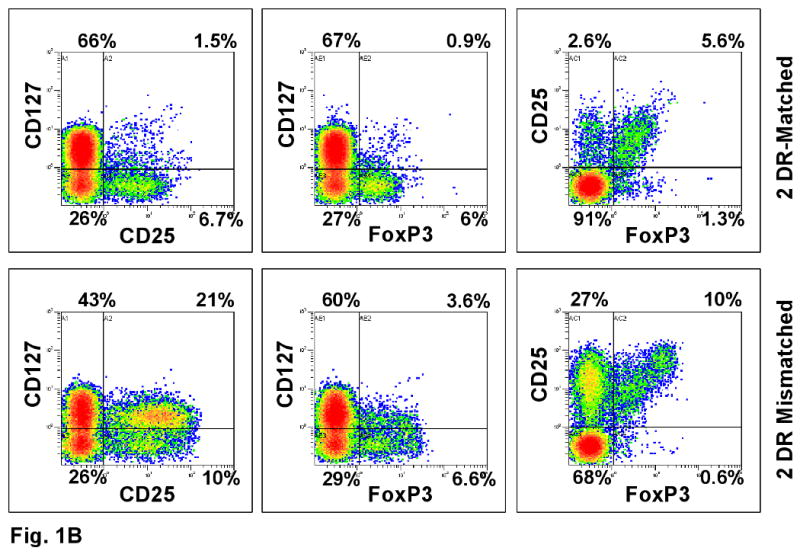
(A) Viable cells were gated again on CD4+ cells that were either non-proliferating (CFSE high cells labeled as Non-Prolif.) or proliferating (CFSE low cells labeled as Prolif.). Cells were analyzed by dot blots and histograms. CFSE negative stimulator cells were gated out. The percentages inside the boxes of the middle column represent gated fractions of cells in each culture. (B) The gated CD4 responder cells from DR-identical vs. 2 DR mismatched MLR cultures were further analyzed for their CD127, CD25 and FOXP3 expressions. Note the lower CD127 values in the 2 DR matched pairs expressing either CD25 or FOXP3 (right upper quadrant).
Figure 2. Assessment of Tregs in MLR (representative experiment of 8 performed).
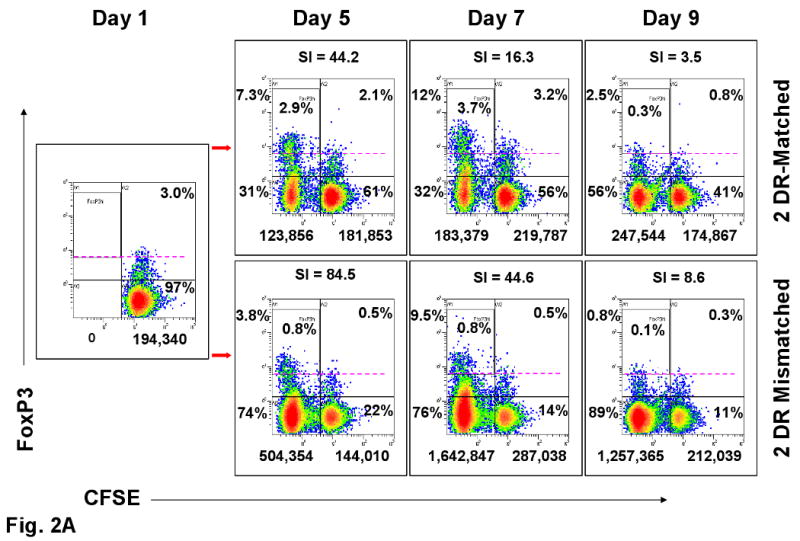
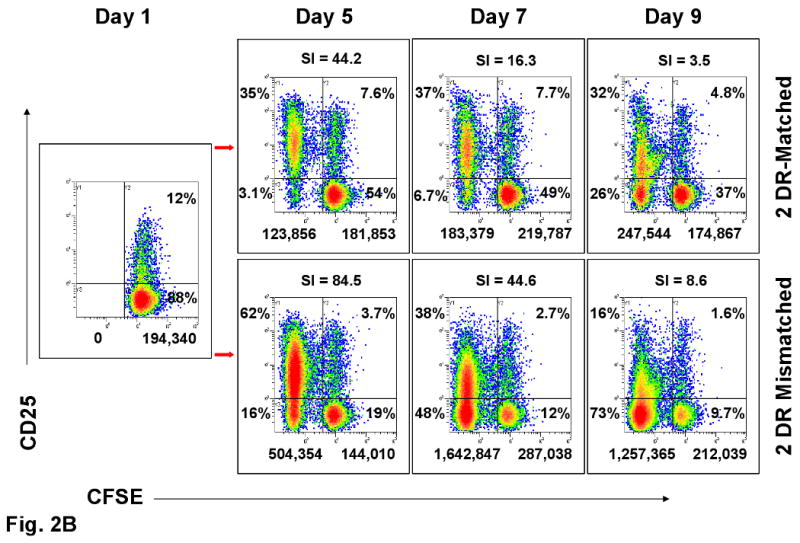
(A) FOXP3 and (B) CD25 expression in CFSE labeled proliferating and non-proliferating CD4+ responder cells (see Figure 1A) on indicated days in culture. The numbers below the dot-plots indicate the absolute cell numbers that were proliferating (left of the vertical bar) and non-proliferating (right of the vertical bar) when 1×10⁶ total responding PBMC were placed in culture on day 0. The percentages indicate the distribution within the four quadrants. The dashed lines in A and percentages within the boxes are arbitrary to aid in visualizing the high intensity FOXP3+ cells. All other dot plots are compared to day one in culture when CFSE labeling did not show any proliferation (far left box with arrows directed to the other panels). On top of the dot-plots are the SIs obtained when calculated in parallel using the baseline triplicate CPM ± SD of the autologous cultures. The 2 DR mismatched responses had higher SI and overall numbers of CFSE labeled proliferating cells (left upper and lower quadrants of each dot blot), but there were either consistently lower percentages or positive : negative ratios of FOXP3+ and CD25+ cells than with the DR-identical responses.
Table 1.
Peak Proliferation (SI) and Generation of the Percentage of CD4+CD25HighFOXP3+ Cells in MLR.
| SI d | % CD4+CD25High FOXP3+e | |||
|---|---|---|---|---|
| A. Effect of DR Matching (n=8)a |
2 DR Matched |
2 DR Mismatched |
2 DR Matched |
2 DR Mismatched |
| Mean ± SD f | 21.4 ±24.8 | 41.0 ±36.1 | 14.5% ± 7.2% | 4.8% ± 3.9% |
| B. Effect of APC Depletion from Responding Cells (n=8)b | PBMC | CD3+ | PBMC | CD3+ |
| Mean ± SD f | 17.1 ±14.9 | 52.0 ±64.2 | 12.2% ± 7.5% | 4.6% ± 4.6% |
| C. Effect of 25+ Depletion from Responding Cells (n=6) c | PBMC | CD25- | PBMC | CD25- |
| Mean ± SD f | 32.7 ±21.7 | 98.4 ±85.7 | 9.5% ± 7.1% | 2.4% ± 2.1% |
Responder PBMC were stimulated with 2 DR matched and 2 DR mismatched irradiated PBMC.
The responses of PBMC were compared against the responses of purified CD3+ cells when stimulated with allogeneic irradiated PBMC.
The responses of PBMC were compared against the responses of CD25- cells when stimulated with allogeneic irradiated PBMC.
SI = Stimulation Index depicted as the peak in the 5, 7 or 9 day kinetics in each MLR
The % of CD4+CD25HighFOXP3+ cells gated on the proliferating population (please see Fig. 1A) is depicted as the peak of the kinetics seen in each MLR (usually 7 days)
All comparisons p<0.01 (sign test)
Direct Vs. Indirect Antigen Presentation
As shown in Table 1B, lymphoproliferation by 3H-TdR uptake (SI) was significantly augmented but CD4+CD25High FOXP3+ T cell generation in proliferating (and non-proliferating, not shown) populations was significantly decreased in the MLRs involving CD3+ selected (direct presentation only) vs. unselected PBMC responding cells (both direct and indirect presentation) (p <.01). These observations were similar between 2 DR matched or mismatched pairs (not shown). This was consistent with the notion that indirect antigen presentation involving self-recognition, i.e. alloantigen presentation by autologous APCs, was a major influence in the generation of such CD4+CD25High FOXP3+ cells in MLR.
Removal of CD25+ Cells
As depicted in Table 1C, when CD25+ cells were removed from the responding cell preparation there was a marked reduction in the resulting percentages of CD4+CD25High FOXP3+ cells generated in proliferating (and non-proliferating, not shown) populations, again despite a notable increase in SI. This supports the notion that the presence of CD25+ cells at baseline is important in Treg MLR generation.
Treg Generation in Autologous and HLA Identical MLRs
The autologous and HLA identical MLRs, i.e. of 4 pairs of (healthy) donor siblings HLA identically matched with their ESRD recipients, were then studied pre-transplant to determine the relationship between proliferation and the generation of CD4+CD25+ FOXP3+ expression (Figure 3). As expected, the overall percentages of proliferating cells in the CD25+ and FOXP3+ fractions in both autologous and HLA-identical MLRs were equivalently low. In addition, there were only low intensity CD25+ and FOXP3+ proliferating cells that were generated (either autologous or between pair members). However, despite the low proliferation, the overall ratio of FOXP3+:FOXP3- proliferating cells in these MLRs was higher than either of the non-HLA identical groups. This predominantly dim pattern was seen in each of the four HLA identical pairs studied pre-operatively (donor vs. recipient and vice versa). Nevertheless, the ratio of the overall percentages of FOXP3+:FOXP3- cells in the HLA identical groups were 3.8±1.9 : 1.7±0.1 (n=8, donor and recipient tested reciprocally) vs. 6.3±1.6 : 34.2±8.2 (n=8) (p=0.01) in the 2 DR matched groups and 6.2±0.5 : 42.4±7.6 (n=8) (p=0.002) in the 2 DR mismatched groups.
Figure 3. CD4+CD25+FOXP3+ cell generation in HLA-Identical vs. autologous MLRs (representative of 4 similar experiments-donor vs. recipient and recipient vs. donor).
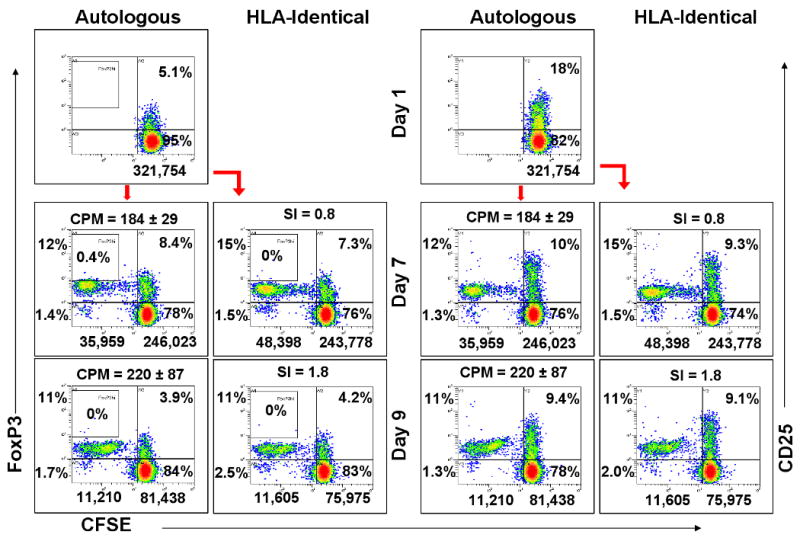
1×10⁶ CFSE labeled responding PBMC from the pre-renal transplant recipient were cultured with 1×10⁶ autologous or HLA-identical donor irradiated stimulator cells. On indicated days the expression of FOXP3+ (left boxes) or CD25+ (right boxes) was measured in the responder CD4+ cells by flow cytometric analysis using the scheme shown in Fig. 2A. Note the overall low number of proliferating cells (left of the vertical bars) but the higher FOXP3 positive to negative ratios generated compared with the 2 DR matched or mismatched pairs (Figure 2).
In Vitro (Functional) Treg Effects
The CD4+CD25High cells generated on day +7 in 2 DR matched MLRs were enriched to >98% CD25High by using the Regulatory T cell Isolation Kit (which resulted in >50% FOXP3+ and <2% CD127+ cells). These were then added to freshly prepared MLRs as third components. Both specific (2 DR matched) and nonspecific (2 DR mismatched) inhibition occurred at the higher cell numbers of the added Tregs (Figure 4). However, inhibition of the non-specific MLR was lost at ∼10 fold higher “regulator” : responder ratios compared to that of the specific (original) 2 DR matched MLRs (p<0.001). This latter specific inhibition occurred in ratios as low as 1 Treg : 100 responder cells. By contrast, when fresh (uncultured) responder cells were added as third components to either the original 2 DR matched or mismatched MLRs, there was no effect on the SI (not shown). Of note, the inhibition in SI seen in these 3 component MLRs was not due to rapid killing of the stimulator cell population by 3rd component effector/cytotoxic cells rather than Treg effects. This was determined by demonstrating a similar decline in CFSE labeled x-irradiated stimulating cells with or without the addition of putative Tregs (data not shown). Moreover, the number of dead cells seen in each of the combinations was no different by forward or side scatter (not shown). Also, if the third component cells came from HLA identical or autologous MLRs, this non-specific inhibition could only be detected in 2 DR matched or mismatched MLRs when added in high concentrations, i.e., no less than one-half that of the responding and stimulating cells (not shown).
Figure 4. Assessment of inhibitory functions of putative Tregs in MLR.
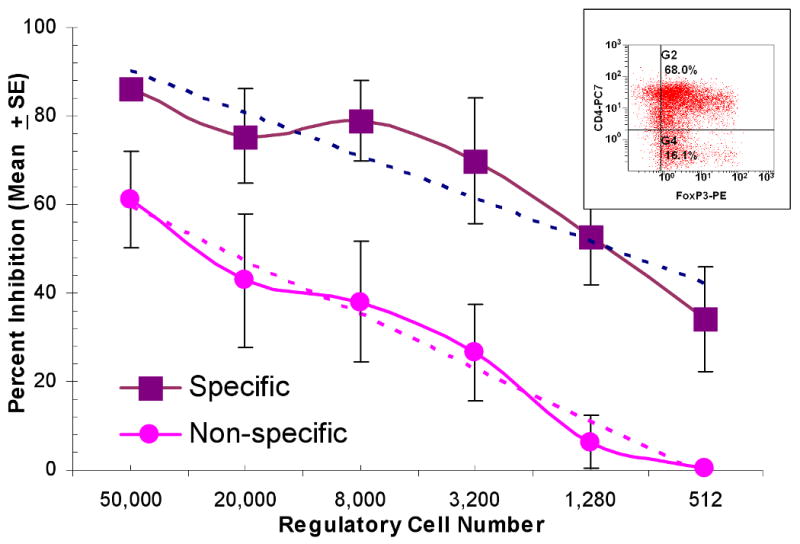
Bulk cultures of 4 pairs of responder cells stimulated with DR-matched x-irradiated stimulator cells were prepared as described in the Methods section. The insert shows that the purified CD127- CD25+ cells were predominantly FOXP3+. These were added to 1×10⁵ autologous fresh responding and x-irradiated stimulator PBMC, the latter from the original 2 DR matched (specific) or a 2 DR-mismatched (non-specific) volunteer donor. Control cultures were prepared as described in the Methods section with fresh autologous total PBMC from the responder (rather than the Tregs). After another seven days, 3H-TdR assays demonstrated significant differences between the specific vs. non-specific inhibition (p<0.001) in that inhibition disappeared at lower modulator numbers in the non-specific combinations. There was equivalent (lack of) inhibition using either unirradiated (n=2) or x-irradiated (n=2) fresh PBMC as the third component controls.
In two additional experiments in normal volunteers similarly isolated CD4+CD127-CD25High cells were tested that were directly obtained from fresh PBMC rather than generated in MLR. Indeed a similar inhibitory (non-specific) effect occurred but with >10 fold higher numbers of these third component Tregs (not shown).
“Infectious” MLR Treg Recruitment Using MLR Generated Third Component Tregs
When the 2 DR matched MLR-generated non-CFSE labeled putative Tregs (CD4+CD25High FOXP3+ CD127-) were added as third components to fresh responder/stimulator MLRs, there was an accelerated and amplified peak (at day 5) in the generation of new (CFSE labeled) proliferating CD4+CD25High FOXP3+ cells (Table 2A). This was in contrast to control MLRs in which an equal number of fresh (uncultured) autologous responder cells were added. This ‘recruitment’ effect did not appear to differ between reactions against specific (2 DR matched) or non-specific (2 DR mismatched) stimulating cells, at least in the dilutions used.
Table 2.
“Infectious” Recruitment of CD4+CD25HighFOXP3+ Cells
| % Proliferating (CFSE labeled) CD4+CD25HighFOXP3+ Cells (from A or R)c | |||
|---|---|---|---|
| Cell Combinations | Days in Culture | ||
| A. By MLR Generated Putative Tregs a | Day 3 | Day 5 | Day 7 |
| A + Bx + (1×10⁵ A cells-control) | 2.4% | 6.8% | 14.5% |
| A + Bx + (1×10⁵ A+Bx Tregs) | 7.5% | 14.5% | 8.2% |
| A + Ix + (1×10⁵A+Bx Tregs) | 7.2% | 20.9% | 10.9% |
| B. By Post-operative PBMC from Renal Recipientb | Day 5 | Day 7 | Day 9 |
| R + Dx + 5×10⁴ R PBMC Pre-op | 1.3% | 0.8% (SI=3.1) | 0.5% |
| R + Dx + 5×10⁴ R PBMC Post-op | 7.7% | 7.9% (SI=0.8) | 0.2% |
| R + Ix + 5×10⁴ R PBMC Pre-op | 3.4% | 4.8% (SI=6.8) | 0.1% |
| R + Ix + 5×10⁴ R PBMC Post-op | 5.3% | 5.8% (SI=6.5) | 0.1% |
A = CFSE labeled responder (5×10⁵); Bx = x-irradiated stimulator (2 DR matched to responder A; 5×10⁵); Ix: X-irradiated stimulator (2 DR mismatched to responder A; 5×10⁵); A+Bx Tregs = Purified CD25High cells generated in a 7-day A+Bx MLR (1×10⁵).
R = HLA-Identical renal recipient pre-transplant PBMC-cryopreserved (5×10⁵); Dx = HLA identical donor x-irradiated PBMC – cryopreserved (5×10⁵); Ix = fresh x-irradiated PBMC from 2 DR mismatched volunteer; R preop = Recipient PBMC cryopreserved preoperatively and used here as third component; R postop = Recipient PBMC obtained & cryopreserved 1 year postoperatively and used here as third component (5×10⁴).
Inhibition/Recruitment as a Monitoring Tool Using Pre- and Post-Transplant PBMC as Third Components in the Treg MLR
Finally we asked whether CFSE labeled Treg generation in MLR might also be augmented by the addition of third component PBMC from transplant recipients to functionally assess allospecific Treg generation after transplantation, i.e., putatively similar to testing in vitro [MLR] generated Tregs as depicted in the Flow Diagram Step#1 and Figure 4 and Table 2A. The example chosen as a first test of this assay involved patients receiving HLA identical donor renal transplants, alemtuzimab induction and donor hematopoetic stem cell infusions in an NIH funded tolerance protocol. By protocol, immunosuppression is to be gradually withdrawn between 1-2 years postoperatively. Sequential PBMC immunophenotyping by flow cytometry showed a 3 fold increase of CD4+CD25high FOXP3+ PBMC from preoperative values (not shown). Preoperative recipient and donor PBMC aliquots had been obtained in large quantities by leukopheresis and cryopreserved. Recipient post-operative PBMC as third component cells were also cryopreserved to be equivalent to the cryopreserved third component [control] recipient preoperative PBMC. At one year, these post-operative recipient PBMC were added as third components to the Treg MLR (pre-operative recipient PBMC + pre-operative donor x-irradiated PBMC). This caused a markedly accelerated and amplified expression (recruitment) of new CD4+CD25highFOXP3+ cells in CFSE labeled recipient responders (Table 2B) as well as a reduced SI of 0.8. This was in contrast to the baseline effect seen when the pre-operative cryopreserved recipient third component PBMC were added, i.e. no amplification of Tregs (Table 2B) and a higher baseline SI of 3.1. Treg generation (recruitment) also only minimally occurred if the CFSE labeled recipient cells were tested as responding to a (non-specific) 2 DR mismatched stimulating cell population (R+Ix, Table 2B). In addition, there was no effect on the SI when these cells were added to responding recipient cells cocultured with 2 DR mismatched stimulating cells, in that the SI with pre-transplant PBMC was 6.8 compared to 6.5 when post-transplant PBMC were added. This assay is representative of 3 such recipients who reached the 1 year post-transplant interval in this protocol.
Discussion
Naturally occurring CD4+CD25High Tregs are a small but important subset of CD4+ lymphocytes that help maintain self-tolerance (8). Across species they appear active in regulating by cell-cell contact, alteration of antigen presentation, production of a regulatory cytokine profile, and even recruiting the generation of more Tregs (“infectious” tolerance) (9). In mice this has been thought to be dependent on the intracellular expression of forkhead/winged helix transcription factor (FOXP3) (1, 4). Controversy exists, however, regarding the role of FOXP3+ expression in humans, also found in CD25- cells and CD8+ T cells (10, 11) and during activation in vitro (3). Moreover, organ transplant recipients have demonstrated FOXP3+ cells in high percentages in the peripheral blood, urine and allograft in rejection as well as in operational tolerance (12-17). Therefore, the diagnostic utility of Treg and FOXP3 detection in humans requires understanding these mechanisms more definitively. The defined conditions described in the Treg MLR experiments in this report appear to clarify a few of them. As such, HLA Class II compatibility, indirect vs. direct antigen presentation, specific vs. non-specific inhibition/recruitment are important aspects of the assay not previously as clearly defined in humans (18, 19).
We thus first compared the effect of DR matching and direct vs. indirect antigen presentation on MLR Treg generation. HLA DR matching of stimulator/responder cell populations was associated with lower proliferation but significantly increased percentages of CD4+CD25High FOXP3+ CD127- Tregs, compared to 2 DR mismatched MLRs (Table 1A), perhaps somewhat similar to previous reports (20). When non-T cells (APCs) were removed from the responder cell population i.e. limiting the response to direct presentation by the stimulating cells but augmenting the proportion of responding T cells, more lymphoproliferation but significantly lower percentages of putative Tregs were generated (Table 1B). This suggests the importance of indirect presentation in alloregulation. This has also in part been previously reported (21, 22), but not in the elementary context of these defined MLR assays, all of which support the notion that self-recognition may be essential in Treg generation.
Also appearing to facilitate Treg generation in MLR was the presence of CD25+ cells in the responding cell population at culture initiation, rather than being newly induced from CD25- cells (Table 1C). This may not be as reflective of what occurs in vivo since Tregs are also thought to be peripherally inducible from CD25- cells (23-25).
As expected, in both HLA identical and autologous MLRs, lymphoproliferation was low. However, even in these assays a small but noteworthy percentage of the proliferating cells became FOXP3+. These low intensity FOXP3+ staining cells caused only a mild non-specific regulatory effect when added in high numbers as third components to fresh allogeneic MLRs. As yet, no attempt has been made to amplify Treg generation by using purified stimulating HLA identical immunoselected CD3- APCs in which self-MHC recognition might be amplified (26).
We then sought to determine their functional regulatory effects by adding MLR generated Tregs as third components to the same freshly prepared HLA 2 DR matched MLR in which they were generated (specific inhibition) vs. to 2 DR mismatched cultures (non-specific inhibition). It might have been argued that FOXP3 generation may simply have occurred with immune activation (3). However, specificity in inhibition occurred. This not only indicated that this immunophenotype generated in MLR was enhanced by MHC Class II matching, but was functionally MLR inhibitory. This was notably at much lower concentrations i.e. as low as 512 cells inhibited by 40% the SI produced by 1×10⁵ responding cells (Figure 4) than with non-specific 2DR mismatched stimulators. It cannot be absolutely concluded, however, that the MLR inhibition was not caused by an unidentified sub-population in the added third components, or by non-proliferating cells generating FOXP3. We consider such an inference less likely because of the marked amplification of inhibition not previously reported in MLR generated non-selected cell populations. This supports the notion that Tregs have greater suppressive capacity when functioning in an antigen-specific manner (27), perhaps related to amplified (specific) TCR priming of these third component modulators and/or recruitment of more antigen-specific Tregs (i.e. “infectious tolerance”), as next described.
Similar to previous observations (28, 29), MLR engendered CD4+CD25High FOXP3+ cells were able to induce and amplify newly developed CFSE labeled CD4+CD25High FOXP3+ cells in freshly prepared MLRs (Table 2A), while causing the SI inhibition (Figure 4). Thus, a discrete phenotypic and functional measurement of “recruitment” could be demonstrated with this assay. This recruitment/inhibition function was first demonstrated with totally in vitro MLR generated Tregs. However, to develop a functional monitoring assay for transplant recipients, we tested this recruitment/inhibition (donor specific vs. non-specific) in Tregs isolated from an HLA identical transplant recipient one year postoperatively. In this investigational protocol, Treg generation was to be expected as a result of infusion of donor hematopoetic stem cell infusions after alemtuzimab induction. Compared to preoperative immunophenotyping, there were 3-fold higher CD4+CD25highFOXP3+ cells in the PBMC at 1 year post-transplant. Addition of these post-transplant cells specifically inhibited the pre-operative recipient vs donor proliferation and generated (recruited) new Tregs, compared to when these cells were added to non-specific MLRs or when pre-transplant recipient cells were added. This finding is representative of 3 such recipients who have reached the 1 year interval post-operatively. To examine similar regulatory effects in other protocols requires using pre-operative cryopreserved donor/recipient MLR assays in which sequential post-operative recipient PBMC can be assessed. We would emphasize the importance of such studies in the future. It should be noted that HLA identical donor/recipient pairs have historically been difficult to monitor functionally in vitro, particularly in testing for Treg effects, because of their low baseline reactivity. What has not been demonstrated is if this process was brought about by cell to cell contact or specific cytokines (in the supernatants) or both. These experiments are currently in progress.
Such a unique platform in which Tregs are actually generated in MLR and are functionally donor-specific could potentially assess the “tolerogenic” influence of immunomodulation (i.e. stem cell infusion, immunosuppressive induction/maintenance agents) and the cellular and humoral events occurring before and after organ transplantation. Ultimately, our goal would be to utilize the Treg MLR to provide donor specific, functional immunological monitoring during clinical events, i.e. rejection vs. infection, and to predict the ability to minimize and/or withdraw immunosuppressive therapy in tolerance protocols.
Supplementary Material
Acknowledgments
Grant Support: Funding for this study was provided by NIH Grant #2R01DK25243-25A2 and a VA Merit Review Award (J. Miller)
We gratefully acknowledge Selma Marie Siddiqui for her technical contributions.
Abbreviations
- 3H-TdR
Tritiated Thymidine
- APC
Antigen presenting cells
- CFSE
Carboxyfluorescein succinimidyl ester
- CPM
Counts per minute
- FOXP3
Forkhead/winged helix transcription factor P3
- HLA
Human leukocyte antigen
- MHC
Major Histocompatibility Complex
- MLR
Mixed lymphocyte reaction
- PBMC
Peripheral blood mononuclear cells
- SI
Stimulation Index
- TREG
T-regulatory cells
- TCR
T cell receptor
Footnotes
1) Josh Levitsky MD MS: Participated in research design, research performance, data analysis and the writing of the paper. No conflict of interest. Current Address: Division of Hepatology, Department of Medicine, Northwestern University Feinberg School of Medicine, 675 N St. Clair St., Chicago, IL 60611.
2) Joseph Leventhal MD PhD: Participated in research design, data analysis and the writing of the paper. No conflict of interest. Current Address: Division of Organ Transplantation, Department of Surgery, Northwestern University Feinberg School of Medicine, 201 E Huron St., Chicago, IL 60611
3) Joshua Miller MD: Participated in research design, research performance, data analysis and the writing of the paper. Obtained funding through NIH Grant #2R01DK25243-25A2 and a VA Merit Review Award for the study. No conflict of interest. Current Address: Division of Organ Transplantation, Department of Surgery, Northwestern University Feinberg School of Medicine, 300 E Superior St., Chicago, IL 60611
4) Xuemei Huang MD: Participated in research performance and data analysis. No conflict of interest. Current Address: Division of Organ Transplantation, Department of Surgery, Northwestern University Feinberg School of Medicine, 300 E Superior St., Chicago, IL 60611
5) Cathy Flaa MA: Participated in research performance and data analysis. No conflict of interest. Current Address: Division of Organ Transplantation, Department of Surgery, Northwestern University Feinberg School of Medicine, 300 E Superior St., Chicago, IL 60611
6) Edward Wang PhD: Participated in statistical data analysis and the writing of the paper. No conflict of interest. Current Address: Division of Biostatistics and Epidemiology, Department of Preventive Medicine, Northwestern University Feinberg School of Medicine, 676 N. St. Clair St. Suite 6-104, Chicago, IL 60611.
7) Anat Tambur PhD: participated in research design, data analysis and the writing of the paper. No conflict of interest. Current Address: Division of Organ Transplantation, Department of Surgery, Northwestern University Feinberg School of Medicine, 300 E Superior St., Chicago, IL 60611
8) Richard K. Burt MD: participated in research design and the writing of the paper. No conflict of interest. Current Address: Division of Hematology & Oncology, Northwestern University Feinberg School of Medicine, 750 N. Lakeshore Dr., Chicago, IL 60611.
9) Lorenzo Gallon MD: participated in research design, data analysis and the writing of the paper. No conflict of interest. Current Address: Division of Organ Transplantation, Department of Surgery, Northwestern University Feinberg School of Medicine, 300 E Superior St., Chicago, IL 60611
10) James M. Mathew PhD: participated in research design, research performance, data analysis and the writing of the paper. No conflict of interest. Current Address: Division of Organ Transplantation, Department of Surgery, Northwestern University Feinberg School of Medicine, 300 E Superior St., Chicago, IL 60611.
References
- 1.Sakaguchi S. Naturally arising Foxp3-expressing CD25+CD4+ regulatory T cells in immunological tolerance to self and non-self. Nat Immunol. 2005;6(4):345. doi: 10.1038/ni1178. [DOI] [PubMed] [Google Scholar]
- 2.Battaglia M, Stabilini A, Migliavacca B, Horejs-Hoeck J, Kaupper T, Roncarolo MG. Rapamycin promotes expansion of functional CD4+CD25+FOXP3+ regulatory T cells of both healthy subjects and type 1 diabetic patients. J Immunol. 2006;177(12):8338. doi: 10.4049/jimmunol.177.12.8338. [DOI] [PubMed] [Google Scholar]
- 3.Pillai V, Ortega SB, Wang CK, Karandikar NJ. Transient regulatory T-cells: a state attained by all activated human T-cells. Clin Immunol. 2007;123(1):18. doi: 10.1016/j.clim.2006.10.014. [DOI] [PMC free article] [PubMed] [Google Scholar]
- 4.Tang Q, Bluestone JA. The Foxp3+ regulatory T cell: a jack of all trades, master of regulation. Nat Immunol. 2008;9(3):239. doi: 10.1038/ni1572. [DOI] [PMC free article] [PubMed] [Google Scholar]
- 5.Fathman CG, Collavo D, Davies S, Nabholz M. In vitro secondary MLR. I. Kinetics of proliferation and specificity of in vitro primed responder cells. J Immunol. 1977;118(4):1232. [PubMed] [Google Scholar]
- 6.Weston SA, Parish CR. New fluorescent dyes for lymphocyte migration studies. Analysis by flow cytometry and fluorescence microscopy. Journal of Immunological Methods. 1990;133(1):87. doi: 10.1016/0022-1759(90)90322-m. [DOI] [PubMed] [Google Scholar]
- 7.Lyons AB. Divided we stand: tracking cell proliferation with carboxyfluorescein diacetate succinimidyl ester. Immunology & Cell Biology. 1999;77(6):509. doi: 10.1046/j.1440-1711.1999.00864.x. [DOI] [PubMed] [Google Scholar]
- 8.Sakaguchi S, Sakaguchi N, Asano M, Itoh M, Toda M. Immunologic self-tolerance maintained by activated T cells expressing IL-2 receptor alpha-chains (CD25). Breakdown of a single mechanism of self-tolerance causes various autoimmune diseases. J Immunol. 1995;155(3):1151. [PubMed] [Google Scholar]
- 9.Mays LE, Chen YH. Maintaining immunological tolerance with Foxp3. Cell Res. 2007;17(11):904. doi: 10.1038/cr.2007.84. [DOI] [PubMed] [Google Scholar]
- 10.Bisikirska B, Colgan J, Luban J, Bluestone JA, Herold KC. TCR stimulation with modified anti-CD3 mAb expands CD8+ T cell population and induces CD8+CD25+ Tregs. J Clin Invest. 2005;115(10):2904. doi: 10.1172/JCI23961. [DOI] [PMC free article] [PubMed] [Google Scholar]
- 11.Nishioka T, Shimizu J, Iida R, Yamazaki S, Sakaguchi S. CD4+CD25+Foxp3+ T cells and CD4+CD25-Foxp3+ T cells in aged mice. J Immunol. 2006;176(11):6586. doi: 10.4049/jimmunol.176.11.6586. [DOI] [PubMed] [Google Scholar]
- 12.Demirkiran A, Baan CC, Kok A, Metselaar HJ, Tilanus HW, van der Laan LJ. Intrahepatic detection of FOXP3 gene expression after liver transplantation using minimally invasive aspiration biopsy. Transplantation. 2007;83(6):819. doi: 10.1097/01.tp.0000258597.97468.88. [DOI] [PubMed] [Google Scholar]
- 13.Dijke IE, Caliskan K, Korevaar SS, et al. FOXP3 mRNA expression analysis in the peripheral blood and allograft of heart transplant patients. Transpl Immunol. 2008;18(3):250. doi: 10.1016/j.trim.2007.08.001. [DOI] [PubMed] [Google Scholar]
- 14.Veronese F, Rotman S, Smith RN, et al. Pathological and clinical correlates of FOXP3+ cells in renal allografts during acute rejection. Am J Transplant. 2007;7(4):914. doi: 10.1111/j.1600-6143.2006.01704.x. [DOI] [PubMed] [Google Scholar]
- 15.Muthukumar T, Dadhania D, Ding R, et al. Messenger RNA for FOXP3 in the urine of renal-allograft recipients. N Engl J Med. 2005;353(22):2342. doi: 10.1056/NEJMoa051907. [DOI] [PubMed] [Google Scholar]
- 16.Li Y, Zhao X, Cheng D, et al. The Presence of Foxp3 Expressing T Cells Within Grafts of Tolerant Human Liver Transplant Recipients. Transplantation. 2008;86(12):1837. doi: 10.1097/TP.0b013e31818febc4. [DOI] [PubMed] [Google Scholar]
- 17.Louis S, Braudeau C, Giral M, et al. Contrasting CD25hiCD4+T cells/FOXP3 patterns in chronic rejection and operational drug-free tolerance. Transplantation. 2006;81(3):398. doi: 10.1097/01.tp.0000203166.44968.86. [DOI] [PubMed] [Google Scholar]
- 18.Jiang S, Camara N, Lombardi G, Lechler RI. Induction of allopeptide-specific human CD4+CD25+ regulatory T cells ex vivo. Blood. 2003;102(6):2180. doi: 10.1182/blood-2003-04-1164. [DOI] [PubMed] [Google Scholar]
- 19.Game DS, Hernandez-Fuentes MP, Chaudhry AN, Lechler RI. CD4+CD25+ regulatory T cells do not significantly contribute to direct pathway hyporesponsiveness in stable renal transplant patients. J Am Soc Nephrol. 2003;14(6):1652. doi: 10.1097/01.asn.0000067411.03024.a9. [DOI] [PubMed] [Google Scholar]
- 20.Hernandez A, Burger M, Blomberg BB, et al. Inhibition of NF-kappa B during human dendritic cell differentiation generates anergy and regulatory T-cell activity for one but not two human leukocyte antigen DR mismatches. Human Immunology. 2007;68(9):715. doi: 10.1016/j.humimm.2007.05.010. [DOI] [PMC free article] [PubMed] [Google Scholar]
- 21.Mirenda V, Berton I, Read J, et al. Modified dendritic cells coexpressing self and allogeneic major histocompatability complex molecules: an efficient way to induce indirect pathway regulation. J Am Soc Nephrol. 2004;15(4):987. doi: 10.1097/01.asn.0000119575.98696.1d. [DOI] [PubMed] [Google Scholar]
- 22.Jiang S, Herrera O, Lechler RI. New spectrum of allorecognition pathways: implications for graft rejection and transplantation tolerance. Curr Opin Immunol. 2004;16(5):550. doi: 10.1016/j.coi.2004.07.011. [DOI] [PubMed] [Google Scholar]
- 23.Reichardt P, Dornbach B, Rong S, et al. Naive B cells generate regulatory T cells in the presence of a mature immunologic synapse. Blood. 2007;110(5):1519. doi: 10.1182/blood-2006-10-053793. [DOI] [PubMed] [Google Scholar]
- 24.Feng G, Wood KJ, Bushell A. Interferon-gamma conditioning ex vivo generates CD25+CD62L+Foxp3+ regulatory T cells that prevent allograft rejection: potential avenues for cellular therapy. Transplantation. 2008;86(4):578. doi: 10.1097/TP.0b013e3181806a60. [DOI] [PubMed] [Google Scholar]
- 25.Xu Q, Lee J, Jankowska-Gan E, et al. Human CD4+CD25low adaptive T regulatory cells suppress delayed-type hypersensitivity during transplant tolerance. J Immunol. 2007;178(6):3983. doi: 10.4049/jimmunol.178.6.3983. [DOI] [PubMed] [Google Scholar]
- 26.Jin Y, Hernandez A, Fuller L, et al. A novel approach to detect donor/recipent immune responses between HLA-identical pairs. Hum Immunol. 2007;68(5):350. doi: 10.1016/j.humimm.2006.11.005. [DOI] [PubMed] [Google Scholar]
- 27.Huter EN, Stummvoll GH, DiPaolo RJ, Glass DD, Shevach EM. Cutting Edge: antigen-specific TGFbeta-induced regulatory T cells suppress Th17-mediated autoimmune disease. J Immunol. 2008;181(12):8209. doi: 10.4049/jimmunol.181.12.8209. [DOI] [PMC free article] [PubMed] [Google Scholar]
- 28.Yamazaki S, Inaba K, Tarbell KV, Steinman RM. Dendritic cells expand antigen-specific Foxp3+ CD25+ CD4+ regulatory T cells including suppressors of alloreactivity. Immunol Rev. 2006;212:314. doi: 10.1111/j.0105-2896.2006.00422.x. [DOI] [PubMed] [Google Scholar]
- 29.Nishimura E, Sakihama T, Setoguchi R, Tanaka K, Sakaguchi S. Induction of antigen-specific immunologic tolerance by in vivo and in vitro antigen-specific expansion of naturally arising Foxp3+CD25+CD4+ regulatory T cells. Int Immunol. 2004;16(8):1189. doi: 10.1093/intimm/dxh122. [DOI] [PubMed] [Google Scholar]
Associated Data
This section collects any data citations, data availability statements, or supplementary materials included in this article.


