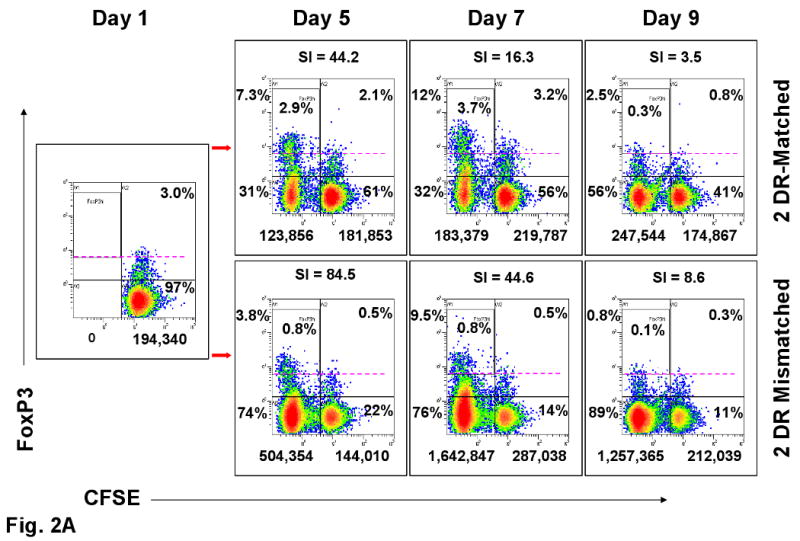
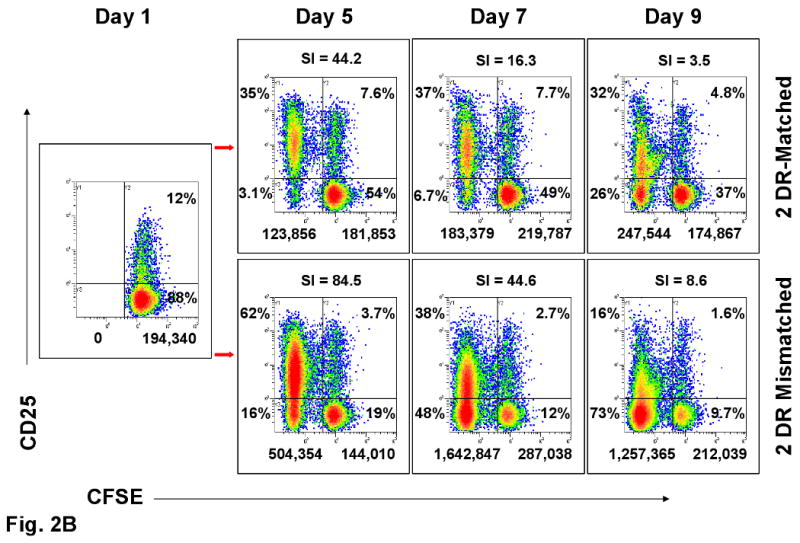
Figure 2. Assessment of Tregs in MLR (representative experiment of 8 performed).


(A) FOXP3 and (B) CD25 expression in CFSE labeled proliferating and non-proliferating CD4+ responder cells (see Figure 1A) on indicated days in culture. The numbers below the dot-plots indicate the absolute cell numbers that were proliferating (left of the vertical bar) and non-proliferating (right of the vertical bar) when 1×10⁶ total responding PBMC were placed in culture on day 0. The percentages indicate the distribution within the four quadrants. The dashed lines in A and percentages within the boxes are arbitrary to aid in visualizing the high intensity FOXP3+ cells. All other dot plots are compared to day one in culture when CFSE labeling did not show any proliferation (far left box with arrows directed to the other panels). On top of the dot-plots are the SIs obtained when calculated in parallel using the baseline triplicate CPM ± SD of the autologous cultures. The 2 DR mismatched responses had higher SI and overall numbers of CFSE labeled proliferating cells (left upper and lower quadrants of each dot blot), but there were either consistently lower percentages or positive : negative ratios of FOXP3+ and CD25+ cells than with the DR-identical responses.
