

Abstract
The Escherichia coli biotin repressor, BirA, is an allosteric transcription regulatory protein to which binding of the small ligand corepressor, biotinyl-5’-AMP, promotes homodimerization and subsequent DNA binding. Structural data indicate that the apo- or unliganded repressor is characterized by four partially disordered loops that are ordered in the ligand-bound dimer. While three of these loops participate directly in the dimerization, the fourth, consisting of residues 212-234 is distal to the interface. This loop, which is ordered around the adenine ring of the adenylate in the BirA adenylate structure, is referred to as the adenylate binding loop or ABL. Although residues in the loop do not directly interact with the ligand, a hydrophobic cluster consisting of a tryptophan and two valine side chains assembles over the adenine base. Results of previous measurements suggest that folding of the ABL is integral to the allosteric response. This idea and the role of the hydrophobic cluster in the process were investigated by systematic replacement of each side chain in the cluster with alanine and analysis of the variant proteins for small ligand binding and dimerization. Isothermal titration calorimetry measurements indicate defects in adenylate binding for all ABL variants. Additionally, sedimentation equilibrium measurements reveal that coupling between adenylate binding and dimerization is compromised in each mutant. Partial proteolysis measurements indicate that the mutants are defective in ligand-linked folding of the ABL. These results indicate that the hydrophobic cluster is critical to the ligand-induced disorder-to-order transition in the ABL and that this transition is integral to the allosteric response in the biotin repressor.
Keywords: Allostery, ligand-induced folding, transcription regulation
Introduction
Allostery is ubiquitous in cellular processes including metabolism, signal transduction, and transcription regulation(1,2). Consequently, allosteric control operates in a broad range of macromolecules including oligomeric metabolic enzymes (aspartate transcarbamylase)(3) chaperonin machines (GroEL)(4), transcription regulatory proteins (lactose repressor)(5), multi-domain signal transduction proteins (N-WASP)(6), and small molecule-activated riboswitches (Adenine riboswitch)(7). Understanding allostery requires elucidation of the mechanism(s) by which a signal associated with small ligand binding or post-translational modification is relayed through the macromolecule to effect functional changes. In many cases this signal is transmitted over a large distance. One route to understanding allostery in biological macromolecules is experimental determination of the significance of structural and dynamic changes in the macromolecule for the functional response.
The Escherichia coli repressor protein, BirA, is the central component of the biotin regulatory system and serves as an excellent model for the study of allostery. BirA is a bifunctional protein that is both a key metabolic enzyme and a repressor of transcription initiation(8,9). As an enzyme, BirA, or biotin holoenzyme ligase, catalyzes the two-step biotinylation of the Biotin Carboxylase Carrier Protein (BCCP), a subunit of the acetyl-CoA carboxylase, which catalyzes the first committed step of fatty acid biosynthesis. BirA first catalyzes synthesis of biotinyl-5’-AMP (bio-5’-AMP) from its substrates biotin and ATP(10) and then transfers the biotin moiety of the intermediate to the ε-amino group of a specific lysine residue on BCCP. Biotin, when linked to BCCP, is the transient carrier of a carboxylate group in its transfer from the donor, bicarbonate, to the acceptor, acetyl-CoA, and thus plays the role of an essential cofactor in the first committed step of fatty acid biosynthesis. As a transcription repressor, the BirA homodimer binds the biotin operator, bioO, thereby preventing transcription initiation at the biotin biosynthetic operon(11-13). It is not the apoBirA monomer, but rather the holo-or adenylate-bound dimer that is the active species in biotin operator binding. Hence, bio-5’-AMP is both the corepressor of BirA in its transcription repression function and the intermediate in its catalysis of biotin transfer to the BCCP subunit of acetyl-CoA carboxylase.
ApoBirA, the unliganded form of BirA, is monomeric, as evidenced by its crystal structure and gel filtration and sedimentation equilibrium studies(14). The protein is composed of three domains. The N-terminal DNA binding domain adopts a winged-helix-turn-helix motif that directly contacts the DNA in the repression complex. The central domain is organized into a 7-stranded mixed β-sheet packed against 5 α-helices, and five surface loops of which four are partially disordered. This domain contains the catalytic site and biochemical data indicate its direct role in dimerization and indirect role in DNA binding. The C-terminal domain contains a β-sandwich motif and structural studies indicate its involvement in repressor dimerization(15).
The mechanism of allosteric activation of BirA involves corepressor-linked repressor dimerization. Binding of bio-5’-AMP to apoBirA is positively coupled to repressor dimerization (Figure 1). This mechanism of allosteric activation of BirA has been studied extensively using equilibrium thermodynamic and kinetic techniques(11,14,16-19). Sedimentation equilibrium measurements indicate that adenylate binding enhances BirA dimerization energetics by -4 to -5 kcal/mol(17,20). Kinetic and equilibrium thermodynamic measurements of repression complex assembly reveal a two-step process of dimerization followed by DNA binding(16). Finally, comparison of apoBirA and holoBirA in dimerization and the two-step assembly of the repression complex indicates that allosteric activation is thermodynamically centered in the dimerization step(20). Therefore, elucidation of the allosteric mechanism in BirA requires determination of the structural and dynamic changes in the BirA monomer that accompany activation of dimerization by bio-5’-AMP.
Figure 1.
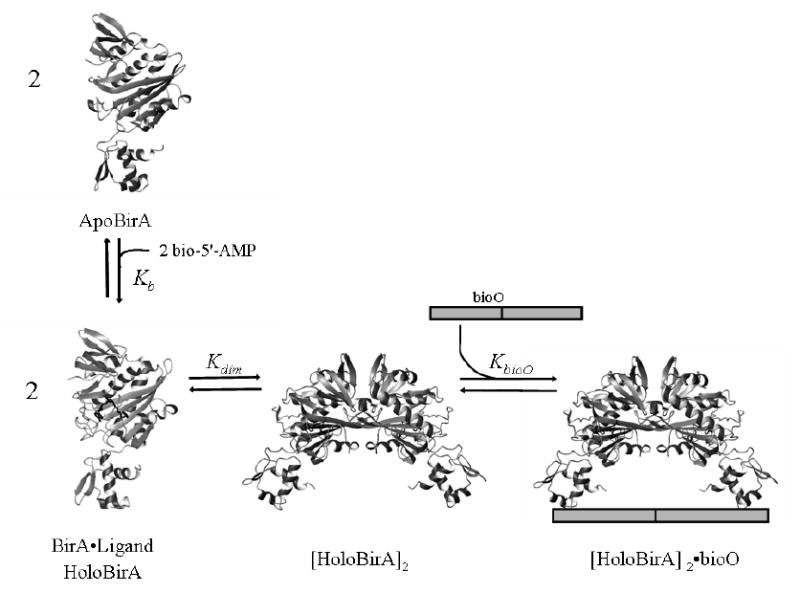
Allosteric activation of the biotin repressor by its physiological corepressor, bio-5’-AMP. Binding of the ligand is positively coupled to repressor dimerization. The resulting dimer subsequently binds site-specifically to the biotin operator sequence, bioO. ApoBirA refers to the unliganded protein and holoBirA is the bio-5’-AMP-bound species. Kb, Kdim, and KbioO refer to the equilibrium constants governing bio-5’-AMP binding, holoBirA dimerization, and holoBirA dimer binding to bioO, respectively.
The magnitude of the allosteric response in BirA can be modulated using analogues of the physiological effector, bio-5’-AMP. Based on their ligand binding properties and abilities to promote repressor dimerization and bioO binding, these small ligands are categorized as weak and strong allosteric activators. Bio-5’-AMP and its analog biotinol-AMP (btnOH-AMP) are strong allosteric activators while d-biotin, a substrate in bio-5’-AMP synthesis, and the sulfamoyl analog of bio-5’-AMP (btn-SA) are weak activators of BirA dimerization. While biotin binding results in no enhancement of dimerization, btnSA binding affords an enhancement of -1 kcal/mol(21). The designation of weak effector for biotin is based on its modest (-1 kcal/mole) enhancement of bioO binding. High resolution structures of the repressor bound to the weak activator, biotin, and strong activator, btnOH-AMP, have been determined by x-ray crystallography(15,22). In both structures the repressor is dimeric, with the dimerization interface located at the central domain of each monomer and formed by side-by-side alignment of β-sheets to form an extended β sheet.
Comparison of the structures of apoBirA, and the BirA-biotin and BirA-btnOH-AMP complexes provides clues about conformational changes that may be important for allosteric activation of the BirA monomer. In both dimer structures, 3 of the 4 partially disordered loops in apoBirA are ordered and form part of the dimer interface. One of these three interface loops, referred to as the biotin-binding loop or BBL, is folded over the biotin moiety in both structures. While the dimer interface of the BirA-biotin and the BirA-btnOH-AMP complexes bear these similarities, the energetic difference between a weak and strong activator-induced dimerization, is large (-3 kcal/mol). Further comparison of the two dimers reveals some differences. For example, consistent with its greater stability, the dimer interface in the adenylate-bound species is larger and extends to the C-terminal domain. However, the greatest structural difference is not found at the dimer interface. Rather, it is the ordering of a fourth flexible loop in the adenylate-bound dimer, which remains disordered in the BirA-biotin dimer structure. This loop, consisting of residues 212-234, is distal to the dimer interface and is folded over the purine ring of the adenylate moiety(15). It is therefore referred to as the adenylate binding loop or ABL (Figure 2A).
Figure 2.
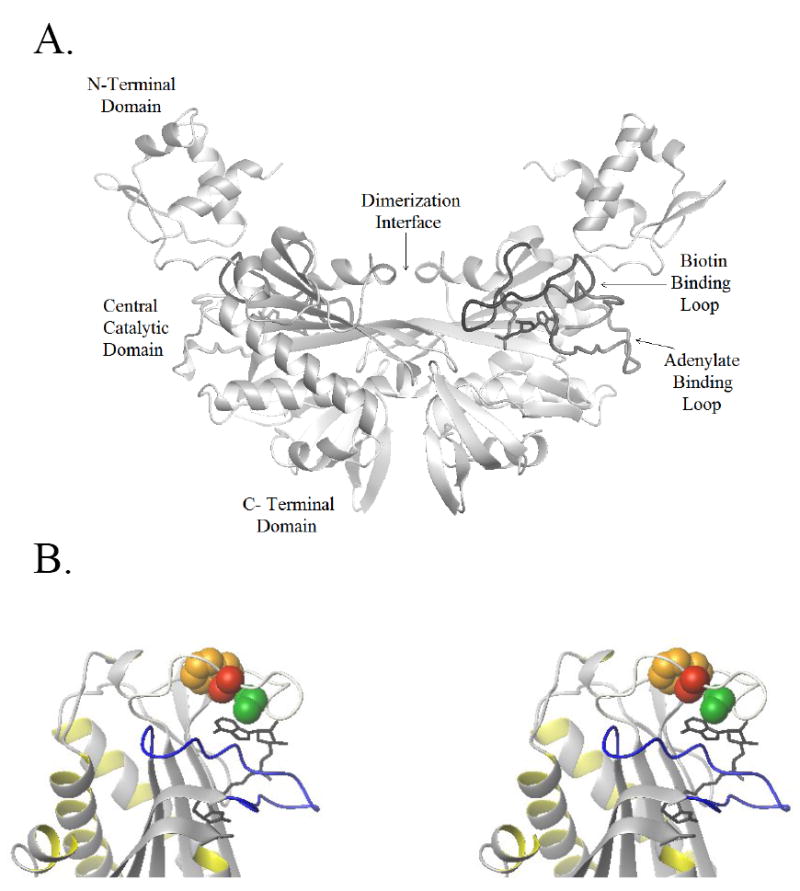
(A) Structure of the BirA: btnOH-AMP complex. The ligand-bound dimer complex is formed with the dimerization interface located at the central domain of each monomer. The biotin binding loop is located at the dimer interface, while the adenylate binding loop is distal to this interface and folds over the adenylate moiety of btnOH-AMP. (B) Stereo view of the ligand binding site with the hydrophobic cluster highlighted: the biotin binding loop (BBL) is shown in blue and is ordered over the biotin moiety. Represented in grey is the ABL folded over the adenylate moiety. The side chains of the hydrophobic cluster, V214 (green), V219 (red) and W223 (yellow), are shown as space filling models. The figures were generated using MolMol(42) with PDB file 2EWN as the input.
Details of the ABL structure in the adenylate-bound dimer provide insight into one structural feature that may be pivotal to the allosteric response. Despite the nomenclature, residues in the loop form no direct interactions with the adenylate portion of the corepressor. With the exception of residue E228, the hydrophilic side chains of ABL residues interact with solvent. Hydrogen bonding interactions are observed between E228 and the R182 side chain. One striking structural feature is a hydrophobic cluster formed by side chains of three loop residues, V214, V219, and W223, which is assembled on one face of the adenine ring (Figure 2B). Given that formation of the cluster is linked to binding of the adenylate it is logical to infer that it may be integral to the disorder-to-order transition that accompanies adenylate binding. Moreover, since binding of the weak activator, biotin, is not coupled to this folding process, it is reasonable to hypothesize that the full allosteric response requires the formation of the cluster. In this study detailed thermodynamic analyses were performed to determine the contribution of the cluster to the allosteric activation process in BirA. Single amino acid replacements of residues in the hydrophobic cluster were constructed and resulting purified variant proteins were analyzed for ligand binding and corepressor-induced dimerization. The variant proteins were also subjected to structural probing using subtilisin-mediated partial proteolysis. The combined results indicate that disruption of the hydrophobic cluster compromises effector-induced folding of the ABL and that the folding is critical to allosteric response in the biotin repressor.
Results
Biotin binding to BirA variants
Structural data indicate that the biotin binding (BBL) and the adenylate binding (ABL) loops undergo a disorder-to-order transition upon small ligand binding(15). Previous studies reveal that amino acid substitutions in the biotin binding loop can lead to decreased affinity for both biotin and bio-5’-AMP(18). Isothermal titration calorimetry was used to investigate the functional effects of mutations in the adenylate binding loop on small ligand binding. Biotin binding measurements were performed to investigate the possible interaction between the BBL and ABL in substrate binding. Titrations with both bio-5’-AMP as well as its analogue btnOH-AMP were also performed. While the structural data available for the latter ligand allows correlation of functional effects with structure, the former ligand is the physiological effector.
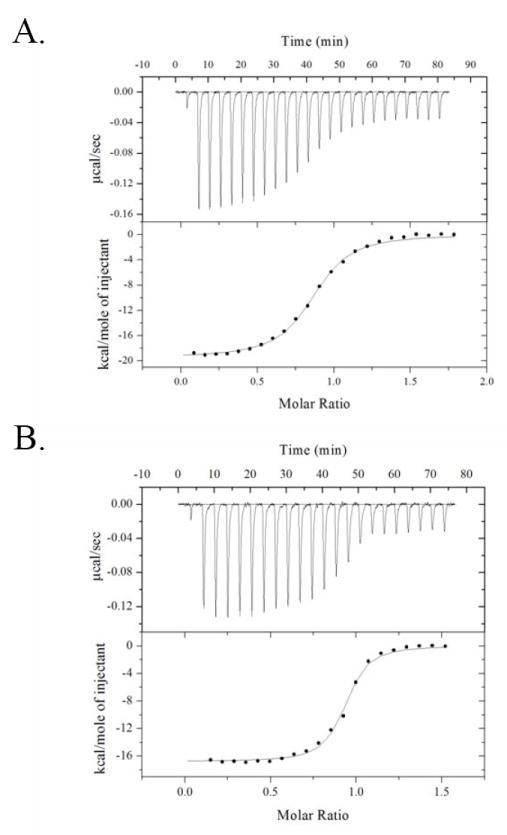
Titrations of variant repressors with biotin were performed using the standard direct calorimetric titration method. Since dimerization of the biotin-bound repressor occurs in the millimolar range of concentration, no contribution of coupled dimerization to the measurements need be considered. Calorimetric data were obtained from titrations in which 25-10 μl injections of a 20 μM concentrated biotin stock were injected into a 2 μM protein sample. A typical ITC profile for biotin binding to BirA in standard buffer (10 mM Tris-HCl (pH 7.50 ± 0.02 at 20.0 ± 0.1 °C), 200 mM KCl, 2.5 mM MgCl2) is shown in Figure 3A. Data of similar quality were obtained from titrations of each variant with biotin. The best-fit curve was obtained from nonlinear least-squares analysis of the data using a single-site binding model (Origin 7.0). Consistent with previously published data, the equilibrium dissociation constant for the wild type BirA biotin interaction is 4.2 (± 0.3) × 10-8 M(23). Moreover, the binding is characterized by a large favorable enthalpy and an opposing unfavorable entropy (Table 1 and Figure 4A). As shown in Figure 4A and Table 1, the biotin binding properties of the ABL variants are similar to those measured for the wild type protein.
Figure 3.
Calorimetric titrations of BirA.
(A) Direct titration of V214A with biotin. 25-10 μl volumes of 20 μM biotin solution were injected into 2 μM BirA. (B) Direct titration of BirA variant V214A with bio-5’-AMP. 21 10 μL volumes of 20 μM bio-5’-AMP solution is injected into 2 μM BirA variant V214A. These experiments were performed at 20 °C in standard buffer [10 mM Tris-HCl (pH 7.50 ± 0.02 at 20.0 ± 0.1 °C), 200 mM KCl, 2.5 mM MgCl2]. The best-fit curves obtained from non-linear least-squares analysis of these data using a single-site binding model (Origin 7.0) are also shown.
Table 1.
Thermodynamics of Ligand Binding to the BirA ABL Variants
| Ligand | Protein | Kb (M)a | ΔGo (kcal/mol)b | ΔHo (kcal/mol)a | -TΔSo (kcal/mol)b | na |
|---|---|---|---|---|---|---|
| biotin | WT | 4.3 (± 0.3) × 10-8 | -9.84 ± 0.04 | -19.4 ± 0.2 | 9.4 ± 0.2 | 0.91 ± 0.01 |
| W223A | 4.7 (± 0.4) × 10-8 | -9.8 ± 0.1 | -19.6 ± 0.2 | 9.8 ± 0.2 | 0.83 ± 0.01 | |
| V214A | 3.8 (± 0.8) × 10-8 | -9.9 ± 0.1 | -19.5 ± 0.2 | 9.6 ± 0.2 | 0.85 ± 0.01 | |
| V219A | 3.8 (± 1.0) × 10-8 | -10.0 ± 0.2 | -19.4 ± 0.5 | 9.3 ± 0.2 | 0.91 ± 0.01 | |
| btnOH-AMP | WT | 1.5 (± 0.2) × 10-9 | -11.8 ± 0.1 | -9.9 ± 0.1 | -2.1 ± 0.1 | 0.89 ± 0.01 |
| W223A | 3.8 (± 0.6) × 10-8 | -10.0 ± 0.1 | -8.0 ± 0.1 | -2.05 ± 0.04 | 0.85 ± 0.01 | |
| V214A | 6.9 (± 1.1) × 10-9 | -10.9 ± 0.1 | -13.1 ± 0.9 | 2.2 ± 0.7 | 0.88 ± 0.01 | |
| V219A | 5.8 (± 1.0) × 10-9 | -11.0 ± 0.1 | -13.3 ± 0.9 | 2.3 ± 0.8 | 0.82 ± 0.01 | |
| bio-5’-AMP | WT | 3.9 (± 1.9) × 10-11 | -13.9 ± 0.4 | -12.3 ± 0.9 | -1.6 ± 0.9 | 0.91 ± 0.01 |
| W223A | 1.4 (± 0.9) × 10-8 | -10.5 ± 0.5 | -9.4 ± 0.9 | -1.0 ± 1.0 | 0.93 ± 0.01 | |
| V214A | 9.7 (± 1.6) × 10-9 | -10.7 ± 0.1 | -15.9 ± 1.1 | 6.1 ± 1.5 | 0.88 ± 0.01 | |
| V219A | 6.9 (± 2.0) × 10-9 | -10.9 ± 0.2 | -15.1 ± 2.0 | 4.2 ± 1.8 | 0.90 ± 0.01 | |
All measurements were performed in Standard Buffer (10 mM Tris-HCl pH 7.50 ± 0.02 at 20.0 ± 0.1 °C. 200 mM KCl, 2.5 mM MgCl2) as described in the Materials and Methods section. The reported values represent the average of at least two independent titrations.
Values of Kb, ΔHo, and n were the best-fit values obtained from nonlinear least squares analysis of the titration data to a simple binding model using Origin.
The values of the Gibbs free energy, ΔGo, were calculated using the expression ΔGo=RTlnKb and those of -TΔSo were calculated using the relationship ΔGo=ΔHo-TΔSo.
Figure 4.
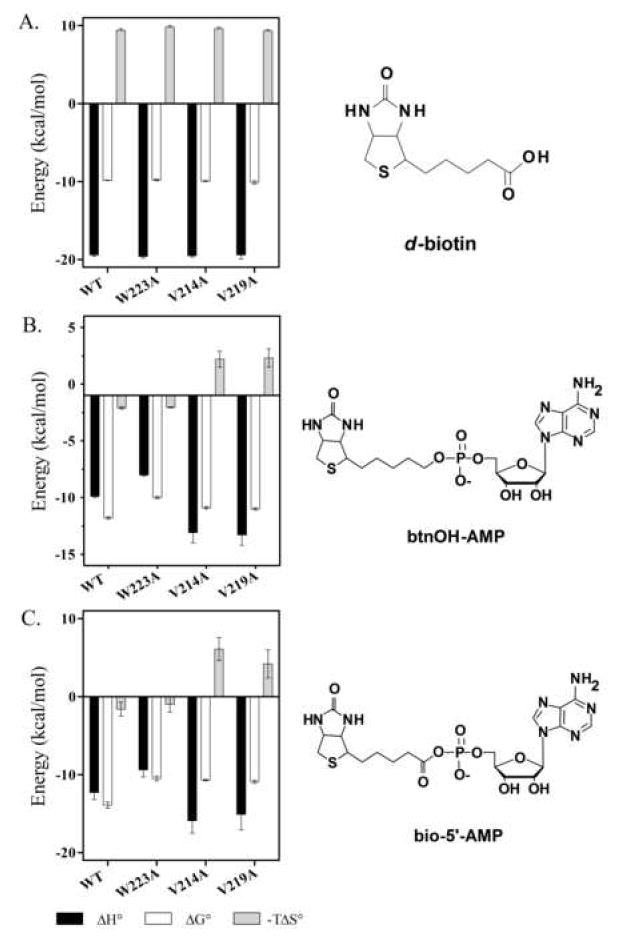
Thermodynamic profiles for binding of (A) biotin, (B) btnOH-AMP, and (C) bio-5’-AMP to WT-BirA and ABL variants. Each panel (left) shows enthalpic, ΔHo, and entropic, -TΔSo, contributions to and Gibbs free energies of, ΔGo binding. Ligand structures are also shown (right). Note that the scale is different for btnOH-AMP than for the other two ligands.
Bio-5’-AMP and BtnOH-AMP Binding to the ABL Variants
Titrations of BirA variant proteins with adenylate ligands were performed to determine effects of single amino acid replacements of the hydrophobic cluster on adenylate binding. Binding of both the physiological corepressor, bio-5’-AMP, and its analogue, btnOH-AMP, was measured. Previous studies revealed that both bio-5’-AMP and btnOH-AMP bind very tightly to the wild type repressor with equilibrium dissociation constants of 4 (± 2) × 10-11 M and 1.5 (± 0.2) × 10-9 M (21), respectively. These tight interactions necessitated use of the displacement titration method for measurement (Sigurskjold)(24) in which the protein is first titrated to saturation with the weaker binding ligand, biotin, followed by its displacement with the ligand that binds more tightly, either bio-5’-AMP of btnOH-AMP. By contrast, the affinities of the ABL variants for the two adenylate ligands are sufficiently weak to allow use of the direct titration method for determining the thermodynamic parameters governing the binding processes. In all cases the protein concentration used for the titration was sufficiently low to avoid any contribution of coupled dimerization to the binding process. A representative titration is shown in Figure 3B. The data were analyzed using a single site model and the results are shown in Table 1 and Figures 4B (btnOH-AMP) and 4C (bio-5’-AMP). Each ABL variant exhibited adenylate binding properties distinct from those measured for the wild type repressor. All three ABL variants exhibited lower affinities for the adenylate ligands than does the wild type repressor with energetic penalties (ΔΔGo) for btnOH-AMP binding ranging from 0.8 to 1.8 kcal/mole. By contrast, the magnitudes of the ΔΔGo for bio-5’-AMP are all approximately 3 kcal/mole. Thus, while the defects measured for bio-5’-AMP and btnOH-AMP binding are not identical, they parallel one another. The partitioning of the ΔΔGo into enthalpic and entropic penalties is distinct for the three variants. For W223A the less favorable free energy associated with binding either ligand reflects only a loss in binding enthalpy. Replacement of Val 214 or Val 219 with alanine resulted in more favorable binding enthalpy for each ligand and a sizable opposing entropy (-TΔSo).
Heat Capacity Changes Associated with Small Ligand Binding
In order to determine the heat capacity changes associated with small ligand binding to the ABL variants, the temperature dependence of the binding enthalpy was measured. These measurements were accomplished using the Total Association at Partial Saturation (TAPS) technique in which the protein is placed in the sample cell and, following the initial 2 μL control injection, five injections of ligand are made under conditions in which all ligand associates with protein (Figure 5)(25). These five injections are followed by a large volume injection that is sufficient to saturate the protein with ligand. Finally, several post saturation injections are made in order to determine the heat of ligand dilution. Since the amount of ligand added in the final injections is identical to that used in the first five, subtraction of the average integrated signal associated with these final injections from the heat associated with each of the first five yields the corrected heat of binding of the ligand to the protein. These measurements were made for binding of wild type and the ABL variant proteins to biotin, biotinol-5’-AMP and bio-5’-AMP at temperatures ranging from 5-20 °C. Dimerization of holoBirA becomes more favorable with increasing temperature (Zhao & Beckett, unpublished observations). Therefore, in order to avoid any contribution of protein-protein interactions to the measured enthalpy, the temperature range at the high end was limited to 20 °C. The results are shown in Figure 6 along with the best-fit lines obtained from linear regression of the dependence of the measured heat on temperature. The resolved values of the heat capacity associated with the ligand binding processes are shown in Table 2. Consistent, with the results of the full titrations, the heat capacity associated with biotin binding to the variants is identical to that measured for the wild type repressor (Figure 6, Table 2). However, differences are observed for the two adenylate ligands. As evidenced by the shallower slopes in the enthalpy versus temperature profiles, the negative heat capacity changes measured for btnOH-AMP binding to the BirA variants are consistently smaller in magnitude than those measured for the wild type protein (Table 2). The results obtained for bio-5’-AMP are more complex with the enthalpy change associated with the W223A variant binding exhibiting a nonlinear dependence on temperature (Figure 6). However, as observed with btnOH-AMP, bio-5’-AMP binding to the V214A and V219A variants is accompanied by a negative heat capacity change that is smaller in magnitude than that measured for the wild type repressor (Figure 6, Table 2).
Figure 5.
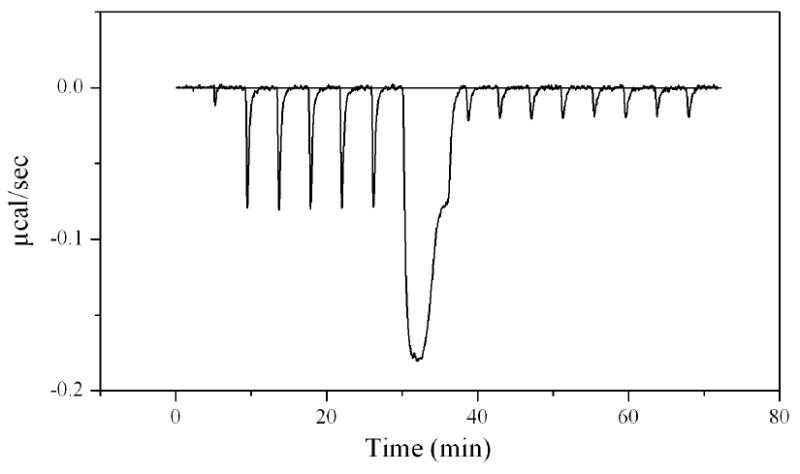
Titrations of BirA V214A with bio-5’-AMP under conditions of total association at partial saturation. The experiment was performed in standard buffer at 15 °C. A 2 μM protein solution was titrated with a 20 μM bio-5-AMP solution. The first 2 μL injection was followed by 5 × 5 μL injections, one 150 μL injection, and finally, 8 × 5 μL injections. The averaged integrated heat of the last eight injections provide the enthalpy of ligand dilution and was subtracted from the integrated heat of injections 2 through 6 to obtain five measures of corrected binding enthalpy of the process in a single experiment.
Figure 6.
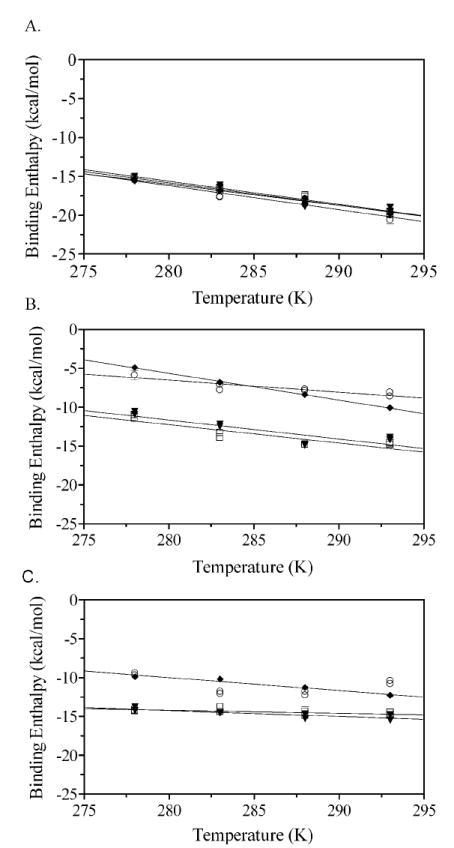
Heat capacity changes for binding of (A) biotin, (B) btnOH-AMP, and (C) bio-5’-AMP to WT-BirA and ABL variants. A plot of the temperature dependence of the binding enthalpy for (◆) WT-BirA, (□) V219A, (▼) V214A and (○) W223A with each ligand. Experiments were performed under conditions of total association at partial saturation as described in Figure 5.
Table 2.
Heat Capacity Changes Associated with Ligand Binding to the ABL Variants.
| Ligand | BirA Variant | ΔCop (cal-mol/K) |
|---|---|---|
| biotin | Wild Type | -270 (± 30) |
| W223A | -310 (± 30) | |
| V214A | -290 (± 40) | |
| V219A | -296 (± 23) | |
| btnOH-AMP | Wild Type | -340 (± 8) |
| W223A | -150 (± 30) | |
| V214A | -240 (± 50) | |
| V219A | -240 (± 50) | |
| bio-5’-AMP | Wild Type | -170 (± 30) |
| W223A | N.Da | |
| V214A | -80 (± 20) | |
| V219A | -40 (± 20) | |
All measurements were performed using the TAPS method in Standard Buffer adjusted to pH 7.50 ± 0.02 at the working temperature. The reported heat capacity changes were obtained from linear least squares analysis of the temperature-dependence of the binding enthalpy, ΔHo.
The heat capacity change for this binding reaction was not determined (see text).
Dimerization of Adenylate-bound Repressor Variant Proteins
Bio-5’-AMP binding promotes binding of BirA to the biotin operator by enhancing repressor dimerization. Results of previous studies indicate that while apoBirA dimerizes weakly in the millimolar concentration range, the BirA-bio-5’-AMP complex exhibits relatively tight dimerization with a KD in the micromolar range of concentration. Thus the coupling free energy for dimerization associated with bio-5’-AMP binding to apoBirA is −4.0 kcal/mole. As indicated in the Introduction, structures of both the BirA:biotin and BirA:btnOH-AMP complexes are dimeric. However, while biotin is a weak allosteric activator, btnOH-AMP is nearly equivalent to bio-5’-AMP in its ability to drive repressor dimerization. For the wild type repressor dimerization of the btnOH-AMP complex is energetically more favorable than that of the biotin complex by approximately -3 kcal/mole(23). Indeed, the energetic enhancement of dimerization associated with biotin binding is, within error, zero. A major difference between the two structures is the folding of the ABL around the adenylate moiety in the adenylate-bound species. The ITC results presented above indicate that all three ABL variants are defective in adenylate binding. The dimerization properties of each variant bound to btnOH-AMP and bio-5’-AMP were measured by sedimentation equilibrium in order to determine the effects of the mutations on the coupling of small ligand binding to dimerization.
Sedimentation equilibrium measurements were performed at three loading concentrations of each complex and the samples were subjected to centrifugation at three rotor speeds. In all cases the concentrations of both ligand and protein were sufficiently high to ensure saturation of the protein with ligand. Figure 7A shows results of data obtained for the BirA btnOH-AMP complex. The data were first analyzed using a single species model in order to obtain the average molecular weight of the complex. In all cases single species analysis indicated protein self-association. The data were then subjected to global analysis using a monomer-dimer self-association model to resolve the dimerization constants. The quality of each fit was assessed from the magnitude of the square root of the variance of the fit and the residual plots. The dimerization free energy of the wild-type repressor bound to each of the adenylates is in excellent agreement with previously reported values(17,23). Results obtained with the ABL variants indicate in all cases defects in dimerization relative to the wild type repressor. The resolved equilibrium dissociation constants for dimerization of the btnOH-AMP-bound variants differ from those measured for the wild type protein by 1.8 to 2.7 fold (Table 3). Defects in dimerization of the bio-5’-AMP-bound variants are greater in magnitude and the equilibrium dissociation constants for dimerization differ from 4.7 to 10.7 fold (Table 3). As shown in Figure 7B, while the magnitude of ΔΔGDim for the btnOH-AMP-bound variants ranges from 0.4 to 0.6 kcal/mole, it ranges from 0.9 to 1.5 kcal/mole for the bio-5’-AMP-bound species.
Figure 7.
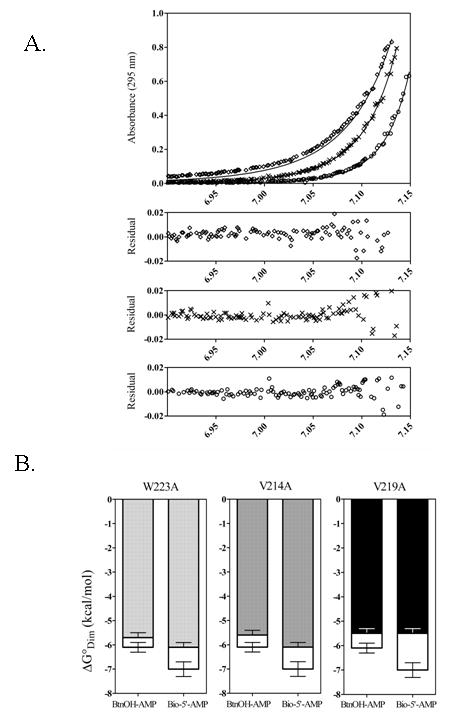
Sedimentation Equilibrium.
(A) Absorbance versus radial position for 45 μM W223A btnOH-AMP at 22,000 (◊), 26,000 (×) and 30,000 (○) rpm obtained in standard buffer at 20 °C. The best-fit curves were generated from global analysis using a monomer-dimer model of six data sets acquired at multiple loading concentrations and centrifuged at three speeds. The residuals of the fit for each data set shown are provided in the bottom panels.
(B) Free energy of dimerization, ΔGoDim, of each ABL variant complexed with btnOH-AMP or bio-5’-AMP (dark bars) compared to that measured for the wild type repressor (white bars).
Table 3.
Dimerization Properties of Complexes of the BirA ABL Variants
| Ligand | BirA Variant | Kdim (M) | ΔGodim (kcal/mol) |
|---|---|---|---|
| btnOH-AMP | WT | 2.7 (± 0.8) × 10-5 | -6.1 ± 0.2 |
| W223A | 5 (± 1) × 10-5 | -5.7 ± 0.2 | |
| V214A | 6 (± 2) × 10-5 | -5.6 ± 0.2 | |
| V219A | 8 (± 1) × 10-5 | -5.5 ± 0.2 | |
| bio-5’-AMP | WT | 6 (± 2) × 10-6 | -7.0 ± 0.3 |
| W223A | 3 (± 1) × 10-5 | -6.1 ± 0.2 | |
| V214A | 3 (± 1) × 10-5 | -6.1 ± 0.2 | |
| V219A | 8 (± 1) × 10-5 | -5.5 ± 0.2 | |
All measurements were performed in Standard Buffer (10 mM Tris-HCl pH 7.50 ± 0.02 at 20.0 ± 0.1 °C. 200 mM KCl, 2.5 mM MgCl2) as described in Materials & Methods. The reported values represent the average of at least two independent measurements performed by subjecting samples prepared at multiple loading concentrations of the relevant complex and centrifuged at multiple rotor speeds. Each resulting data set was subjected to global analysis using a monomer-dimer model.
Probing Structural Consequences of the Mutations by Partial Proteolysis
The BirA btnOH-AMP structure reveals that the ABL undergoes a disorder-to-order transition concomitant with adenylate binding. A striking feature of the folded ABL is the hydrophobic cluster formed by residues V214, V219, and W223. We have hypothesized that folding of the ABL and the associated formation of this cluster is important for the allosteric response in BirA. Results of ligand binding and dimerization measurements performed on the ABL variants indicate functional defects. These defects in dimerization are consistent with reduced allosteric responses in the variants. Partial proteolysis measurements were performed to determine if these functional defects are correlated with defective ligand-induced folding of the ABL.
Previously, the kinetics of subtilisin-catalyzed proteolysis of WT BirA were measured in the absence and presence of ligands to investigate ligand-linked conformational changes in the adenylate binding loop. Initial subtilisin cleavage occurs between residues 217 and 218 in the ABL and gives rise to two products of 25 and 10 kDa(26). The time dependence of the cleavage can be measured by subjecting the cleavage products to SDS-polyacrylamide gel electrophoresis. The amount of intact BirA present at specific time points after addition of protease is quantitated by densitometry of a Coomassie brilliant blue-stained gel as shown in Figure 8A. The apparent rate of cleavage of the protein is obtained from analysis of the densitometry data using a pseudo first-order kinetic model for the reaction. A graphical representation of the data and analysis are shown in Figure 8B. The apparent rates of proteolysis of each repressor ABL variant were measured in the absence of ligand and in the presence of bio-5’-AMP. The results shown in Table 4 indicate differences in the cleavage rate for each variant in the absence of ligand relative to that measured for the wild-type repressor. Since subtilisin is not, strictly speaking, a nonspecific protease, the structural basis of these differences is not known. More significantly, replacement of residues in the hydrophobic cluster resulted in decreased levels of adenylate-linked protection of the adenylate binding loop from proteolysis.
Figure 8.

(A) Proteolytic time course of BirA variant V219A complexed with bio-5’-AMP shows decreasing amount of intact protein (35 KDa) as a function of time after addition of the protease subtlisin. (B) Kinetic time course of pseudo-first order cleavage of 2 μM BirA variant V219A (□) and 2 μM BirA variant V219A + 20 μM bio-5’-AMP (○). All measurements were performed in standard buffer at 20 °C.
Table 4.
Pseudo-first Order Rates of Proteolytic Cleavage of ABL Variant Proteins
| BirA variant | No ligand (apo) (min-1) | bio-5’-AMP (holo) (min-1) | kapo/kholo |
|---|---|---|---|
| Wild Type | 0.026 ± 0.003 | 0.004 ± 0.001 | 6.5 ± 0.3 |
| V219A | 0.032 ± 0.007 | 0.013 ± 0.004 | 2.5 ± 0.4 |
| V214A | 0.018 ± 0.006 | 0.007 ± 0.002 | 2.6 ± 0.4 |
| W223A | 0.041 ± 0.010 | 0.008 ± 0.001 | 5.1 ± 0.3 |
All measurements were performed in Standard Buffer (10 mM Tris-HCl pH 7.50 ± 0.02 at 20.0 ± 0.1 °C. 200 mM KCl, 2.5 mM MgCl2) as described in Materials & Methods. The reported rates represent the average of at least two independent determinations and the errors represent the 95% confidence intervals.
Discussion
In the biotin regulatory system, allosteric activation occurs through ligand-linked dimerization of the biotin repressor, BirA. The repressor binds substrates biotin and ATP to catalyze synthesis of biotinyl-5’-adenylate or bio-5’-AMP(10). The adenylate-bound or activated holo-monomer self-associates and the resulting dimer then binds to the biotin operator sequence, bioO, to repress transcription initiation at the biotin biosynthetic operon(11,13). Bio-5’-AMP binding initiates the allosteric signal that is propagated through the BirA monomer to enhance dimerization. Elucidation of the allosteric mechanism in BirA therefore requires determination of the ligand-linked structural and dynamic changes in the monomer that are important for promoting dimerization.
Combined structural and equilibrium thermodynamic data suggest the importance of folding of the adenylate binding loop for the allosteric response. High-resolution structures are available for the apoBirA monomer and two dimers in which the repressor is complexed with biotin or an analogue of bio-5’-AMP, btnOH-AMP(15,22). While enhancement of dimerization energetics upon biotin binding is in effect zero, binding of btnOH-AMP results in an enhancement nearly as large as that associated with physiological corepressor binding(23). Comparison of the apoBirA monomer with the two ligand-bound dimer structures reveals that three loops, which are disordered in the unliganded protein, are ordered and participate directly in the intersubunit interface of each ligand-bound structure. However, although the two dimers share this structural similarity, a major difference is localized to the adenylate binding loop. While in the biotin (weak effector)-bound structure the ABL remains disordered, in the btnOH AMP (strong effector)-bound structure it is folded. Close inspection of this loop in the BirA-btnOH-AMP structure reveals that it is folded over the adenine ring with side chains of residues V214, V219, and W223 forming a hydrophobic cluster(15). While these three residues do not directly interact with the adenylate, formation of the core may be important for allosteric activation. Single amino acid substitutions of hydrophobic cluster residues were made to assess contributions of the core to the functional properties of BirA.
Biotin binding measurements indicate that all ABL variants bind the substrate with thermodynamics identical to those measured for the wild type repressor. Therefore, biotin binding is independent of perturbations in the adenylate binding loop. These results contrast with previous studies of BirA variants with single amino acid substitutions in the biotin binding loop, which result in defects in both biotin and adenylate binding. The structure of the biotin-bound dimer indicates that while the BBL is folded over the biotin molecule, the ABL is not folded. However, in the adenylate-bound dimer both loops are folded with the ABL arranged around the adenylate moiety. These structural results support the known catalytic mechanism of BirA in which an ordered mechanism operates with biotin binding first followed by ATP. Biotin binding to apo-BirA induces folding of the BBL, which creates the ATP binding site. In the absence of biotin no ATP binding site exists. Taken together these data explain the insensitivity of biotin binding to mutations in the adenylate binding loop.
Since the ABL is ordered around the adenylate moiety in the BirA:btnOH-AMP structure the consequences for adenylate binding of altering loop residues were investigated. Measurements of both bio-5’-AMP and btnOH-AMP binding were performed because, while the former is the physiological effector, structural data are available for BirA bound to the latter. Binding measurements for all ABL variants indicate the importance of the hydrophobic core residues for adenylate binding. Results indicate that both adenylate ligands bind to each variant with affinities significantly lower than they do to the wild type repressor. The energetic penalties (ΔΔGo) for binding btnOH-AMP ranged from +1.5 to +2 kcal/mole and those associated with bio-5’-AMP ranged from +1 to +3 kcal/mole. In addition, partitioning of the energetic penalty between enthalpy (ΔΔHo) and entropy (TΔΔSo) differed for the variants. While for the W223A it was centered in the binding enthalpy, for the V214A and V219A variants the energetic penalty was solely in the entropic component of binding. Finally, the effects on binding were consistently larger for the physiological effector than for the analogue. This suggests that while the analogue is a reasonable mimic of bio-5’-AMP, there are differences in the structural details of the repressor’s interaction with the two ligands. In conclusion, the adenylate binding results indicate that integrity of the cluster is required for tight binding of BirA to bio-5’-AMP.
Results of sedimentation equilibrium measurements indicate that single amino acid replacements in the hydrophobic cluster result in defective dimerization. In their adenylate-bound complexes the three variants exhibit less favorable dimerization energetics as compared to the wild type repressor. The defects in dimerization can be considered in terms of the effects of the amino acid replacements on the coupling free energy associated with adenylate binding. This coupling free energy, ΔGC, is defined as the “extra” favorable Gibbs free energy of dimerization that results from binding of the adenylate to apoBirA. As indicated previously, the magnitudes of ΔGC for bio-5’-AMP and btnOH-AMP binding to wild type BirA are -4 and -3 kcal/mole, respectively. Assuming that dimerization of the apo-form of each ABL variant is identical to that measured for wild type BirA, the coupling free energy can be calculated for each variant. The assumption is justified by the fact that no residues that are directly involved in the monomer-monomer interface are perturbed in any of the ABL variants. Results of the calculation, which are shown in Figure 9, indicate losses in coupling free energy of +0.3 to +0.6 kcal/mole for the analogue and +0.8 to +1.4 kcal/mole for the physiological effector, bio-5’-AMP. Thus, although mutations in the hydrophobic cluster do not directly alter the dimerization interface, disruption of the cluster distal to this interface perturbs the allosteric response associated with adenylate binding.
Figure 9.

Coupling free energies, ΔGoC, for linkage of btnOH-AMP or bio-5’-AMP binding to WT BirA and each ABL variant were calculated from the difference between the free energy of apoBirA self-association and the free energy of dimerization of the ligand bound species measured for each of the proteins in the work. In this calculation the ΔGoDim for all apo-species are assumed to be identical.
Measurements of the heat capacity changes associated with ligand binding and the kinetics of subtlisin-mediated proteolysis are consistent with the conclusion that alanine substitutions in the hydrophobic cluster compromise ligand-linked folding of the ABL. The negative heat capacity changes associated with btnOH-AMP binding to all three mutants and bio-5’-AMP binding to V214A and V219A are smaller in magnitude than those measured for binding of wild type repressor to the two ligands. These results are consistent with the burial of less hydrophobic surface area in binding of the mutants to the two ligands (27-29). Bio-5-AMP binding to the W223A variant exhibits a nonlinear dependence of binding enthalpy on temperature. Although this phenomenology has been observed in other systems, the explanation for the observation in this instance is beyond the scope of this work (30-33). Partial proteolysis with subtilisin provides a low-resolution measure of the ligand-induced folding of the ABL with bio-5’-AMP binding to wild type BirA resulting in a 6.5-fold decrease in the pseudo-first order cleavage rate. By contrast, the bio-5’-AMP-linked decreases in proteolysis rates measured for the ABL variants ranged from 2.5 to 5.1 fold. Although the degree of bio-5’-AMP-linked protection observed for the W233A mutant is less than that observed for the other mutants, the reduced level of protection observed when the hydrophobic core is altered is consistent with disruption of ligand-linked folding. These results when combined with ITC measurements of ligand binding and the dimerization measurements support the conclusion that formation of the hydrophobic cluster is integral to adenylate-induced folding of the ABL and that this folding is critical for the allosteric response in BirA.
While formation of the ABL hydrophobic cluster is clearly important for the allosteric response it is likely that additional structural and dynamic changes in BirA are integral to allosteric activation. Although residues 212-223 undergo the disorder-to-order transition upon adenylate binding, ABL residues other than the hydrophobic cluster do not appear to function in the allosteric response. Site-directed mutagenesis has been employed to change residues R213, E216, E228 to alanine and none of the purified proteins are altered in ligand-linked dimerization (S. Naganathan, unpublished observations). In addition, examination of the structure of the btnOH-AMP-bound repressor reveals that the majority of the charged or polar side chains of ABL residues are projected toward solvent. Comparison of the biotin-bound and btnOH-AMP-bound dimers reveals several structural differences outside of the ABL that may be coupled to adenylate-linked folding of the loop, and thus the allosteric response. For example, in the adenylate-bound structure the dimer interface is larger and extends to the C-terminal domains of the two subunits. Comparison of the structures of the biotin-bound and adenylate-bound monomers indicates a difference in the relative orientations of the C-terminal and central domains, a difference that may be linked to adenylate-induced folding of the ABL. Additionally, in the btnOH-AMP-bound repressor monomer the N-terminal DNA binding domain is rotated closer to the central catalytic domain than it is in the biotin-bound protein. This difference may also be linked to ABL folding. Currently hydrogen-deuterium exchange coupled to mass spectrometric analysis is being employed to further investigate these corepressor-linked structural changes in the repressor monomer.
Comparison of biotin protein ligases (BPLs) from different species highlights the importance of the adenylate binding loop for bio-5’-AMP-linked dimerization associated with the transcription repression function. Biotin protein ligases all catalyze the same reaction and their sequences are highly conserved across evolution. However, sequence comparison of bacterial BPLs, including those from eubacteria and archaebacteria, reveals that only a subset are both enzymes and transcriptional repressors(34). For example, Pyrococcus horikoshii encodes a monofunctional ligase, which does not contain an N-terminal DNA binding domain and therefore does not bind to DNA. High-resolution structures of this ligase reveal significant structural homology between it and the C-terminal and central domains of BirA(35). Nonetheless, two striking differences are observed. First, although the PhBPL is dimeric, the interface is formed by completely different segments of the protein than those utilized by BirA for dimerization. Second, and more relevant to this study, the adenylate binding loop is significantly truncated in the PhBPL relative to EcBirA. Highly divergent bacteria encode bifunctional ligases, and the bifunctionality is, thus, considered an ancient feature. As such, organisms such as Pyrococcus horikoshii are thought to have lost the DNA binding function. The lack of the adenylate binding loop suggests that it too is dispensable because it is not required for the ligand-linked dimerization associated with repression of transcription initiation.
The role of protein dynamics in transmitting allosteric signals in proteins is well documented. One view focuses on the coupling of changes in flexibility, as determined primarily by NMR dynamics measurements, to the allosteric mechanism(36). For example in the transcription factor Catabolite Repressor Protein changes in dynamics, both picosecond-nanosecond and microsecond-millisecond, are correlated with the negative cooperativity associated with cAMP binding to the protein (37). Another view of Freire and colleagues is that low stability regions of a protein play a central role in allosteric responses (38). In the biotin repressor ligand-induced folding of such a low stability region appears to nucleate the allosteric response. The mechanism by which this initial response percolates through the remainder of the protein remains to be determined.
Materials and Methods
Chemicals and Biochemicals
All chemicals used in the preparation of buffers were obtained commercially and were at least reagent grade. The d-biotin, isopropyl β-D-thiogalactoside (IPTG), polyethyleneimine (PEI), and subtilisin A were obtained from Sigma. The bio-5’-AMP was synthesized and purified in the laboratory using a published procedure(11). The biotinol- adenylate (btnOH-AMP) was synthesized as described in Brown et al. (23).
Expression and Purification of BirA variants
The BirA variants were expressed in the E. coli strain JM109 transformed with the plasmid pBtac2 carrying the E. coli birA gene (wild type or mutant) under transcriptional control of the tac promoter. The gene was altered to encode a C-terminal (His)6 tag, which does not interfere with the wild type protein’s function(18). Cells were grown at 30°C in LB media and protein expression was induced by addition of IPTG at O.D.600 of 0.6-0.9 for 11 hours. The cells were lysed by sonication. After separation of the cell debris from the lysate by centrifugation, nucleic acids were removed by addition of PEI to a final concentration of 0.2% (vol/vol). The separation and purification of BirA from other cellular proteins was carried out in two chromatography steps. The protein mixture was applied to a NiNTA (Qiagen) column (150 mm × 15 mm) equilibrated with 20 mM imidazole, 50 mM (NaH)PO4, 300 mM NaCl, 5% glycerol, 0.1 mM DTT, pH 8.0 and eluted with a step gradient of increasing imidazole concentration from 20 mM to 175 mM in the same buffer. With the exception of BirA V219A, fractions containing BirA were pooled and dialyzed against SP-Sepharose Starting Buffer (50 mM Tris-HCl (pH 7.5 at 4 °C), 50 mM KCl, 5% glycerol, 0.1 mM DTT) and loaded onto a SP-Sepharose (GE Healthcare) column (150 mm × 15 mm) equilibrated with the same buffer. Protein was eluted in a linear KCl gradient (0.05 M to 0.8 M) in 50 mM Tris-HCl (pH 7.5 at 4 °C), 5% glycerol, 0.1 mM DTT. The fractions containing pure BirA were pooled and dialyzed against Storage Buffer (50 mM Tris-HCl (pH 7.5 at 4 °C), 200 mM KCl, 5% glycerol) and stored at −70 °C. Fractions containing BirA for purification of BirA variant V219A were pooled, dialyzed against SP-Sepharose Starting Buffer and loaded onto a Q-Sepharose (GE Healthcare) column (150 mm × 15 mm) and flow through containing the protein was collected. The pure protein was exchanged into Storage Buffer and stored at −70 °C. The yield for each protein was > 12 mg/L of culture. The concentration of each protein stock was determined spectrophotometrically using a molar extinction coefficient at 280 nm calculated for each BirA histag variant(39). The pooled protein sample for each BirA histag variant was >95% pure as judged by SDS-PAGE followed by Coomassie brilliant blue staining. Binding activity was determined to be >90% for all variants as determined by stoichiometric titrations with bio-5’-AMP monitored by fluorescence spectroscopy(11).
Isothermal Titration Calorimetry
All titrations were performed using a VP-ITC microcalorimeter with a 1.44 mL sample cell volume, a 250 μL syringe, and equipped with a thermovac degasser (MicroCal, Inc., Northampton, MA.). The protein sample was dialyzed several times against standard buffer (10 mM Tris-HCl (pH 7.50 ± 0.02 at 20.0 ± 0.1 °C), 200 mM KCl, 2.5 mM MgCl2). The sample was filtered through a 0.22 μm PTFE syringe filter and the concentration determined spectrophotometrically using the ε280 calculated for each variant. The dialysis buffer was filtered and used for protein and ligand sample preparation and degassed prior to use in the calorimeter. Titrations were performed by addition of ligand to protein in the sample cell. The heat of binding for each injection was obtained after subtracting the average of heat of dilution obtained from multiple injections after the saturation of protein. The binding data were analyzed using Origin 7.0 software to obtain binding isotherms and thermodynamic parameters.
Total Association at Partial Saturation Titrations
Titrations under conditions of total association at partial saturation were used to obtain measurements of the enthalpy of each binding process used in calculation of the heat capacities. In this method, 15 injections of a concentrated ligand solution are introduced into the protein solution under stoichiometric binding conditions. A 2 μM BirA (wild type or variant) solution is titrated with 5 × 5 μL injections of a 20 μM ligand (biotin, bio-5’-AMP or btnOH-AMP) in standard buffer at 20.0 ± 0.1 °C, followed by a 150 μL injection that saturates the protein, and finally followed by 8 × 5 μL injections. The first five injections provide measurements of the uncorrected binding enthalpies (binding + ligand dilution), while the 8 injections post-protein saturation provide the enthalpy of ligand dilution. The enthalpy of binding is calculated using the equation,
In each experiment five measurements of the binding enthalpy are obtained.
Equilibrium Binding Titrations
With the exception of bio-5’-AMP and btnOH-AMP binding to wild type BirA, direct titrations were employed for measurement of ligand binding to all proteins. A 2 μM BirA (wild type or variant) solution was titrated with 25 10 μl injections of 20 μM ligand (biotin, bio-5’-AMP or btnOH-AMP) in standard buffer at 20.0 ± 0.1 °C. In all titrations the c value (KMtotn where K is the equilibrium association constant for the binding processes, Mtot is the total molar protein concentration in monomer units, and n is the stoichiometry of the binding interaction) fall within the range of 100-330. This range is below the upper limit of 500 recommended for measuring equilibrium constants.
The signals were integrated and non-linear least squares analysis of binding data was performed using a single site binding model to obtain the equilibrium association constant, Ka, the binding enthalpy, ΔHo, the stoichiometry, n. The Gibbs free energy, ΔGo and entropic contribution to each binding process, -TΔSo, were calculated using these relationships,
| (i) |
| (ii) |
The tight binding of bio-5’-AMP and btnOH-AMP to wild type BirA necessitated use of the displacement titration method for measuring these interactions. Details of this method are provided in (21,24).
Heat Capacities of Ligand Binding
Heat capacity changes associated with formation of the protein-ligand complexes were determined by measuring the temperature dependence of the binding enthalpy for the processes. Measurements were performed using the TAPS method (see above) to obtain enthalpies of binding for wild type BirA and the three ABL variants with biotin, bio-5’-AMP and btnOH-AMP at temperatures from 5-20 °C. The pH of the standard buffer was adjusted to 7.50 ± 0.02 at each working temperature. The change in heat capacity upon binding was obtained by linear regression of the ΔHo versus T data for each binding interaction.
Sedimentation Equilibrium
The dimerization properties of each BirA variant-ligand complex bound to btnOH-AMP or bio-5’-AMP were determined by analytical ultracentrifugation using a Beckman Optima XL-I Analytical Ultracentrifuge equipped with a four-hole An-60 Ti rotor (Beckman Coulter). Double-sector cells with charcoal-filled epon centerpieces with sapphire windows and optical pathlengths of 3 mm and 12 mm were employed(17). The protein was exchanged into and preequilibrated with standard buffer (10 mM Tris-HCl (pH 7.50 ± 0.02 at 20.0 ± 0.1 °C), 200 mM KCl, 2.5 mM MgCl2) using a MicroBiospin 6 Chromatography column (BioRad). The concentration of the protein sample is determined spectrophotometrically using the ε280 calculated for each BirA variant. The complex was prepared in standard buffer at stoichiometric conditions with a ratio of 1:1.5 of protein to ligand. The buffer density (1.007 g/ml) was determined pycnometrically and the partial specific volume of BirA monomer is 0.755 ml/g as reported previously(17). Scans of absorbance versus radial position were obtained at 295 nm at three protein loading concentrations from 15 μM to 75 μM and rotor speeds of 18,000, 22,000, 26,000, and 30,000 rpm for 12 hours each. Five measurements were acquired at each radial position with 0.001 cm spacing. The resulting data were subjected to non-linear least squares analysis using the programs MacNonLin(40) and WinNonLin. The σ-values were obtained for each scan individually and related to the molecular weight using the following equation:
| (iii) |
in which M is the molecular weight, ν̄ is the partial specific volume of the protein, ρ is the density of the buffer, ω is the angular velocity of the rotor, R is the gas constant and T is the temperature in Kelvin. Data were also analyzed globally to a monomer-dimer association model(41) to obtain the monomer-dimer association constant, Ka.
| (iv) |
where δc is the baseline offset, ct is the total concentration at each radial position, r, cm(ro) is the monomer concentration at ro, ro is the reference radial position (at the first data point), σmon is the reduced molecular weight of the monomer determined by sedimentation of the aporepressor, and Ka is the equilibrium association constant governing assembly of the dimer from the monomers. In the analysis, the reduced molecular weight of the dimer is assumed to be twice that of the monomer. The quality of each global analysis was evaluated by the magnitude of square root of variance of fit and distribution of residuals.
Proteolysis
All BirA histag WT and variant samples were subjected to subtilisin-catalyzed proteolytic digestion following a 30 minute incubation at 20 °C in standard buffer (10 mM Tris-HCl (pH 7.50 ± 0.02 at 20.0 ± 0.1 °C), 200 mM KCl, 2.5 mM MgCl2) either in the absence or presence of saturating concentrations of biotin or bio-5’-AMP. The apparent rates of subtilisin-catalyzed cleavage were measured by addition of subtilisin prepared freshly in standard buffer, to a BirA solution to obtain a final weight ratio of repressor:subtilisin of 33 to 50:1 and incubation was continued at 20 °C. All experiments were performed at a BirA concentration at which the protein is 100% monomeric in the absence and presence of ligand. A 10 μL aliquot was removed at 15 minute time intervals and the reaction was quenched into 1 μL of 100 mM PMSF freshly prepared in absolute ethanol. Six microliters of Laemmli gel sample buffer were added and the proteolytic digestion products were separated by electrophoresis on a 15% SDS-polyacrylamide gel. Protein bands were stained with Coomassie Brilliant Blue and the amount of intact BirA for each time point of proteolytic cleavage was quantified using a Molecular Dynamics Laser Scanning Personal Densitometer (GE Healthcare). Control experiments have shown that high concentrations of the ligands do not affect the catalytic activity of subtilisin (26). The rates of subtilisin- catalyzed cleavage of BirA were obtained by relating the time-dependent decrease of intact BirA to a pseudo-first order process. The apparent rates of proteolysis were estimated from linear least-squares analysis using the following equation:
| (v.) |
where [BirAOD]t and [BirAOD]t=0 are the integrated optical densities for the bands corresponding to intact BirA at time t and the zero time point, respectively, t is time in minutes and k is the rate or slope of the line.
Acknowledgments
Supported by NIH Grants R01-GM46511 and S10-RR15899.
Footnotes
Publisher's Disclaimer: This is a PDF file of an unedited manuscript that has been accepted for publication. As a service to our customers we are providing this early version of the manuscript. The manuscript will undergo copyediting, typesetting, and review of the resulting proof before it is published in its final citable form. Please note that during the production process errors may be discovered which could affect the content, and all legal disclaimers that apply to the journal pertain.
References
- 1.Beckett D. Regulated assembly of transcription factors and control of transcription initiation. J mol Biol. 2001;314:333–352. doi: 10.1006/jmbi.2001.5134. [DOI] [PubMed] [Google Scholar]
- 2.Lim WA. The modular logic of signalling proteins: building allosteric switches from simple binding domains. Curr Opin Struct Biol. 2002;12:61–68. doi: 10.1016/s0959-440x(02)00290-7. [DOI] [PubMed] [Google Scholar]
- 3.Gerhart JC, Pardee AB. Aspartate Transcarbamylase, an Enzyme Designed for Feedback Inhibition. Fed Proc. 1964;23:727–735. [PubMed] [Google Scholar]
- 4.Horwich AL, L K, Fenton WA, Hirshfield IN, Furtak K. Folding in vivo of bacterial cytoplasmic proteins: role of GroEL. Cell. 1993;74:909–917. doi: 10.1016/0092-8674(93)90470-b. [DOI] [PubMed] [Google Scholar]
- 5.Jobe A, Bourgeois S. Lac repressor-operator interaction. 8. Lactose is an anti-inducer of the lac operon. J Mol Biol. 1973;75:303–313. doi: 10.1016/0022-2836(73)90023-5. [DOI] [PubMed] [Google Scholar]
- 6.Torres E, Rosen MK. Protein-tyrosine kinase and GTPase signals cooperate to phosphorylate and activate Wiskott-Aldrich syndrome protein (WASP)/neuronal WASP. J Biol Chem. 2006;281:3513–3520. doi: 10.1074/jbc.M509416200. [DOI] [PubMed] [Google Scholar]
- 7.Wickiser JK, Cheah MT, Breaker RR, Crothers DM. The kinetics of ligand binding by an adenine-sensing riboswitch. Biochemistry. 2005;44:13404–13414. doi: 10.1021/bi051008u. [DOI] [PubMed] [Google Scholar]
- 8.Cronan JE., Jr The E.coli bio operon:transcriptional repression by an essential protein modification enzyme. Cell. 1989;58:427–429. doi: 10.1016/0092-8674(89)90421-2. [DOI] [PubMed] [Google Scholar]
- 9.Barker DF, Campbell AM. The birA gene of Escherichia coli encodes a biotin holoenzyme synthetase. J Mol Biol. 1981;146:451–467. doi: 10.1016/0022-2836(81)90042-5. [DOI] [PubMed] [Google Scholar]
- 10.Lane MD, Rominger KL, Young DL, Lynen F. The enzymatic synthesis of holotranscarboxylase from apotranscarboxylase and (+)-biotin. J Biol Chem. 1964;239:2865–2871. [PubMed] [Google Scholar]
- 11.Abbott J, Beckett D. Cooperative binding of the Escherichia coli repressor of biotin biosynthesis to the biotin operator sequence. Biochemistry. 1993;32:9649–9656. doi: 10.1021/bi00088a017. [DOI] [PubMed] [Google Scholar]
- 12.Otsuka A, Abelson J. The regulatory region of the biotin operon in Escherichia coli. Nature. 1978;276:689–694. doi: 10.1038/276689a0. [DOI] [PubMed] [Google Scholar]
- 13.Prakash O, Eisenberg MA. Biotinyl 5’- adenylate: corepressor role n the regulation of the biotin genes of Escherichia coli K-12. Proc Natl Acad Sci U S A. 1979;76:5592–5595. doi: 10.1073/pnas.76.11.5592. [DOI] [PMC free article] [PubMed] [Google Scholar]
- 14.Wilson KP, Shewchuk LM, Brennan RG, Otsuka AJ, Matthews BW. Escherichia coli biotin holoenzyme ynthetase/bio repressor crystal structure delineates the biotin- and DNA- binding domains. Proc Natl Acad Sci U S A. 1992;89:9257–9261. doi: 10.1073/pnas.89.19.9257. [DOI] [PMC free article] [PubMed] [Google Scholar]
- 15.Wood Z, Weaver LH, Brown PH, Beckett D, Matthews BW. Corepressor induced order and biotin repressor dimerization: a case for divergent followed by convergent evolution. J Mol Biol. 2006;357:509–523. doi: 10.1016/j.jmb.2005.12.066. [DOI] [PubMed] [Google Scholar]
- 16.Streaker ED, Beckett D. Coupling of protein assembly and DNA binding:biotin repressor dimerization preceeds biotin operator binding. J Mol Biol. 2003;325:937–948. doi: 10.1016/s0022-2836(02)01308-6. [DOI] [PubMed] [Google Scholar]
- 17.Eisenstein E, Beckett D. Dimerization of the Escherichia coli biotin repressor:corepressor function in protein assembly. Biochemistry. 1999;38:13077–13084. doi: 10.1021/bi991241q. [DOI] [PubMed] [Google Scholar]
- 18.Kwon K, Streaker ED, Ruparelia S, Beckett D. Multiple disordered loops function in corepressor-induced dimerization of the biotin repressor. J Mol Biol. 2000;304:821–833. doi: 10.1006/jmbi.2000.4249. [DOI] [PubMed] [Google Scholar]
- 19.Streaker ED, Beckett D. Ligand - linked structural changes in the Escherichia coli biotin repressor: the significance of surface loops for binding and allostery. Biochemistry. 1999;292:619–632. doi: 10.1006/jmbi.1999.3086. [DOI] [PubMed] [Google Scholar]
- 20.Streaker ED, Gupta A, Beckett D. Th biotin repressor: thermodynamic coupling of corepressor binding, protein assembly, and sequence-specific DNA binding. Biochemistry. 2002;41:14263–14271. doi: 10.1021/bi0203839. [DOI] [PubMed] [Google Scholar]
- 21.Brown P, Beckett D. Use of binding enthalpy to drive an allosteric response. Biochemistry. 2005;44:3112–3121. doi: 10.1021/bi047792k. [DOI] [PubMed] [Google Scholar]
- 22.Weaver LH, Kwon K, Beckett D, Matthews BW. Corepressor-induced organization and assembly of the biotin repressor:a model for allosteric activation of a transcriptional regulator. Proc Natl Acad Sci U S A. 2001;98:6045–6050. doi: 10.1073/pnas.111128198. [DOI] [PMC free article] [PubMed] [Google Scholar]
- 23.Brown P, Cronan JE, Grotli M, Beckett D. The biotin repressor: Modulation of allostery by corepressor analogs. J Mol Biol. 2004;337:857–869. doi: 10.1016/j.jmb.2004.01.041. [DOI] [PubMed] [Google Scholar]
- 24.Sigurskjold BW. Exact analysis of competition ligand binding by displacement isothermal titration calorimetry. Anal Biochem. 2000;277:260–266. doi: 10.1006/abio.1999.4402. [DOI] [PubMed] [Google Scholar]
- 25.Bains G, Freire E. Calorimetric determination of cooperative interactions in high affinity binding processes. Anal Biochem. 1991;192:203–206. doi: 10.1016/0003-2697(91)90207-a. [DOI] [PubMed] [Google Scholar]
- 26.Xu Y, Nenortas E, Beckett D. Evidence for distinct ligand-bound conformational states of the multifunctional Escherichia coli repressor of biotin biosynthesis. Biochemistry. 1995;34:16624–16631. doi: 10.1021/bi00051a010. [DOI] [PubMed] [Google Scholar]
- 27.Sturtevant JM. Heat capacity and entropy changes in processes involving proteins. Proc Natl Acad Sci U S A. 1977;74:2236–2240. doi: 10.1073/pnas.74.6.2236. [DOI] [PMC free article] [PubMed] [Google Scholar]
- 28.Baldwin RL. Temperature dependence of the hydrophobic interaction in protein folding. Proc Natl Acad Sci U S A. 1986;83:8069–8072. doi: 10.1073/pnas.83.21.8069. [DOI] [PMC free article] [PubMed] [Google Scholar]
- 29.Spolar RS, Ha JH, Record MT., Jr Hydrophobic effect in protein folding and other noncovalent processes involving proteins. Proc Natl Acad Sci U S A. 1989;86:8382–8385. doi: 10.1073/pnas.86.21.8382. [DOI] [PMC free article] [PubMed] [Google Scholar]
- 30.Bruzzese FJ, Connelly PR. Allosteric properties of inosine monophosphate dehydrogenase revealed through the thermodynamics of binding of inosine 5’-monophosphate and mycophenolic acid. Temperature dependent heat capacity of binding as a signature of ligand-coupled conformational equilibria. Biochemistry. 1997;36:10428–10438. doi: 10.1021/bi9708040. [DOI] [PubMed] [Google Scholar]
- 31.Kumaran S, Grucza RA, Waksman G. The tandem Src homology 2 domain of the Syk kinase: a molecular device that adapts to interphosphotyrosine distances. Proc Natl Acad Sci U S A. 2003;100:14828–14833. doi: 10.1073/pnas.2432867100. [DOI] [PMC free article] [PubMed] [Google Scholar]
- 32.Keramisanou D, Biris N, Gelis I, Sianidis G, Karamanou S, Economou A, Kalodimos CG. Disorder-order folding transitions underlie catalysis in the helicase motor of SecA. Nat Struct Mol Biol. 2006;13:594–602. doi: 10.1038/nsmb1108. [DOI] [PubMed] [Google Scholar]
- 33.Kozlov AG, Lohman TM. Effects of monovalent anions on a temperature-dependent heat capacity change for Escherichia coli SSB tetramer binding to single-stranded DNA. Biochemistry. 2006;45:5190–5205. doi: 10.1021/bi052543x. [DOI] [PMC free article] [PubMed] [Google Scholar]
- 34.Rodionov DA, Mironov AA, Gelfand MS. Conservation of the biotin regulon and the BirA regulatory signal in Eubacteria and Archaea. Genome Res. 2002;12:1507–1516. doi: 10.1101/gr.314502. [DOI] [PMC free article] [PubMed] [Google Scholar]
- 35.Bagautdinov B, Kuroishi C, Sgahara M, Kunishima N. Crystal Structure of biotin protein ligase from Pyrococcus horikoshii OT3 and its complexes: Structural Basis of Biotin Activation. J Mol Biol. 2005;353:322–333. doi: 10.1016/j.jmb.2005.08.032. [DOI] [PubMed] [Google Scholar]
- 36.Kern D, Zuiderweg ER. The role of dynamics in allosteric regulation. Curr Opin Struct Biol. 2003;13:748–757. doi: 10.1016/j.sbi.2003.10.008. [DOI] [PubMed] [Google Scholar]
- 37.Popovych N, Sun S, Ebright RH, Kalodimos CG. Dynamically driven protein allostery. Nat Struct Mol Biol. 2006;13:831–838. doi: 10.1038/nsmb1132. [DOI] [PMC free article] [PubMed] [Google Scholar]
- 38.Luque I, Freire E. Structural stability of binding sites: consequences for binding affinity and allosteric effects. Proteins. 2000;(Suppl 4):63–71. doi: 10.1002/1097-0134(2000)41:4+<63::aid-prot60>3.3.co;2-y. [DOI] [PubMed] [Google Scholar]
- 39.Gill SC, von Hippel PH. Calculation of protein extinction coefficients from amino acid sequence data. Anal Biochem. 1989;182:319–326. doi: 10.1016/0003-2697(89)90602-7. [DOI] [PubMed] [Google Scholar]
- 40.Johnson ML, Correia JJ, Yphantis DA, Halvorson HR. Analysis of data from the analytical ultracentrifuge by nonlinear least-squares techniques. Biophys J. 1981;36:575–588. doi: 10.1016/S0006-3495(81)84753-4. [DOI] [PMC free article] [PubMed] [Google Scholar]
- 41.Laue TM. Sedimentation equilibirum as a thermodynamic tool. Methods Enzymol. 1995;259:427–452. doi: 10.1016/0076-6879(95)59055-2. [DOI] [PubMed] [Google Scholar]
- 42.Koradi R, Billeter M, Wuthrich K. MOLMOL: a program for display and analysis of macromolecular structures. J Mol Graph. 1996;14:51–55. 29–32. doi: 10.1016/0263-7855(96)00009-4. [DOI] [PubMed] [Google Scholar]