Abstract
Objective
The increasing concentration of proteoglycans from the surface to the deep zone of articular cartilage produces a depth-dependent gradient in fixed charge density, and therefore extracellular osmolarity, which may vary with loading conditions, growth and development, or disease. In this study we examine the relationship between in situ variations in osmolarity on chondrocyte water transport properties. Chondrocytes from the depth-dependent zones of cartilage, effectively preconditioned in varying osmolarities, were used to probe this relationship.
Design
First, depth variation in osmolarity of juvenile bovine cartilage under resting and loaded conditions was characterized using a combined experimental/theoretical approach. Zonal chondrocytes were isolated into two representative “baseline” osmolarities chosen from this analysis to reflect in situ conditions. Osmotic challenge was then used as a tool for determination of water transport properties at each of these baselines. Cell calcium signaling was monitored simultaneously as a preliminary examination of osmotic baseline effects on cell signaling pathways.
Results
Osmotic baseline exhibits a significant effect on the cell membrane hydraulic permeability of certain zonal subpopulations but not on cell water content or incidence of calcium signaling.
Conclusions
Chondrocyte properties can be sensitive to changes in baseline osmolarity, such as those occurring during OA progression (decrease) and de novo tissue synthesis (increase). Care should be taken in comparing chondrocyte properties across zones when cells are tested in vitro in non-physiologic culture media.
Keywords: Chondrocyte volume, finite element analysis, ion exchangers
Introduction
The osmotic environment in which cartilage tissue cells (chondrocytes) reside is dictated by the local concentrations of proteoglycan (PG) molecules trapped within the extracellular matrix. The highly negatively-charged PG molecules create a fixed charge density (FCD) that attracts positively-charged counter-ions and water according to Donnan osmotic equilibrium, giving rise to local tissue osmolarity (32). As tissue volume decreases and recovers under physiologic loading, the fixed charge density and osmolarity are simultaneously altered. In the chondrocyte environment, therefore, time-varying osmotic perturbations are superimposed on a static osmotic baseline. Both baseline conditions and temporal alterations may have important implications for tissue maintenance through cell mechanotransduction pathways, as indicated by several studies on isolated, mixed-zone cell populations (13, 23, 24, 40, 46).
The static osmotic baseline varies spatially through the depth of cartilage, due to a gradient in PG molecules, whose content increases from the articular surface to the bony interface. Changes to the chondrocyte osmotic environment that persist for longer timescales than those of physiologic loading cycles (i.e., seconds) may temporarily shift or permanently reset this baseline. These variations may result from various factors such as loss of PG with progressing osteoarthritis (OA) (33, 47); prolonged static loading which results in significant interstitial fluid volume loss and concomitant increase in FCD (8, 45); or relatively rapid PG synthesis as may occur in cartilage growth and tissue engineering (11, 19, 35).
To date, the majority of studies on baseline culture osmolarity have focused on its influence on chondrocyte metabolic activities. Specifically, these studies demonstrate differential cellular regulation of various points in the PG production pathway, including aggrecan gene expression (24), aggrecan-associated promoter activity (40), and sulfate incorporation (46), with cell culture in media of different osmolarities. Very few studies, however, have examined the effect of baseline osmolarity on the cell material properties that characterize their physical response to alterations in their physico-chemical and mechanical environments. Knowledge of how these properties that govern “upstream” stages of cell mechanotransduction pathways vary with baseline osmolarity may aid in understanding the differences in “downstream” stages, such as gene expression and ECM production exhibited by cells that experience loading conditions from different baseline culture osmolarities (i.e., cells from different depths of cartilage) (5). One study has noted a dependence of chondrocyte viscoelastic properties on the media osmolarity in which the cells are cultured (21). Clearly, given the ubiquitous nature of the osmotic environment in cartilage tissue, and the potential impacts of alterations in this environment, further study in this area is warranted.
Chondrocyte material properties related to water transport, namely hydraulic membrane permeability and intracellular content of osmotically active water, have not been sufficiently explored. An understanding of these properties may explain how chondrocyte volume is regulated under resting and loaded tissue conditions, where cell volume changes in conjunction with tissue volume (2, 22). In the current study, we hypothesize that osmotic baseline affects chondrocyte water transport properties. To study this effect, we use distinct cell populations isolated from three locations (zones) within the depth-varying gradient in FCD, and therefore osmolarity, that characterize this tissue (47). Because of this osmotic gradient, the populations are effectively preconditioned at different osmotic baselines.
Previous work has indirectly examined the influence of osmotic baseline on zonal cell properties, examining their equilibrium volume change in response to short-term osmotic loading in situ (9). Due to concomitant swelling of the charged extracellular matrix, the results of that study cannot tease out the specific response of the chondrocytes. The current study on isolated zonal cells not only avoids this confounding factor, but expands knowledge on zonal cell equilibrium properties to measures of cell material properties previously reported only for mixed or middle zone chondrocytes (21, 36).
Information provided by the current study of baseline osmotic effects on chondrocyte properties is also intended to provide deeper understanding of existing literature that provides comparison of zonal cell properties characterized in vitro (14, 44), where cells are routinely isolated into media conditions that are hypotonic relative to the in situ environment, prior to testing.
To test the baseline osmolarity hypothesis, we isolate zonal chondrocytes from cartilage into culture media of two osmolarities that reflect the in situ tissue environment near the articular surface or closer to the bony interface. To estimate osmolarity through the tissue depth under resting (baseline) and loaded (perturbed) tissue conditions, which has not been reported previously for this commonly used juvenile explant tissue model, we perform a finite element analysis with input parameters of tissue proteoglycan and water content obtained from biochemical analysis.
From the two baselines we apply an osmotic perturbation, leading to transient cell volume change that, combined with the assumption of passive cell water transport, can be fit with the Kedem-Katchalsky equations relating cell volume to extracellular osmolarity to yield hydraulic membrane permeability and intracellular fractional water content (25). Osmotic loading has been used similarly to extract these properties for mixed zone chondrocytes and other cell types in the context of cryopreservation studies (15, 36).
A fluorescent dye with excitation/emission properties that reflect intracellular calcium concentrations is used to measure cell volume, allowing simultaneous observation of the changes in cell volume and concentrations of this well-known secondary messaging molecule that has been previously implicated in cell response to osmotic loading (13, 16, 26, 43, 48). While osmotic loading is used in the current study primarily for extraction of cell transport properties, comparison of calcium signaling response to osmotic loading from the two baselines provides a preliminary look at the effects of baseline osmolarity on latter time points in chondrocyte mechanotransduction pathways.
Materials and Methods
Part A: Tissue Osmolarity through the Depth
Due to the significant difference in thickness between juvenile and adult tissue, we refer to the tissue zones through the depth studied here as upper, middle, and lower instead of the superficial, middle, and deep zone terminology traditionally used for adult tissue (also see Discussion). The osmolarity of the extracellular environment through the depth of the tissue under free-swelling conditions, and in the short and long-term response to step compressive loading, was estimated theoretically from experimentally measured tissue fixed charge density.
A 3 mm diameter punch was used to core full-depth cartilage explants from the femoral condyles and patellofemoral grooves of 3 juvenile (4–6-month-old) bovine knees (n=10 samples, average thickness 6.8±1.2 mm). A freezing-stage microtome (Leica) was used to cut ten 160 µm thick slices starting from the articular surface of the tissue, followed by 320 µm thick slices through the remaining tissue depth, for a total of 17–28 slices per sample.
Samples were weighed wet, freeze-dried, weighed dry, then digested overnight with proteinase K (Fisher Scientific) using an established protocol.(42) GAG mass in the digest was determined using the 1,9 dimethylmethylene blue (Sigma Chemicals) dye-binding assay, adapted for use with a microtiter plate reader. Shark chondroitin sulfate (0–50 µg/mL) was used as a standard.(18) Water weight of each tissue sample was calculated as wet weight minus dry weight. Water volume fraction, , was determined from the ratio of water weight to tissue wet weight, under the reasonable assumption that the tissue density is similar to that of water. Water mass was converted to water volume, and along with GAG mass was used to determine the tissue fixed charge density through the depth using
Since chondroitin sulfate (CS) was used as the standard, GAG charge number was taken as 2 and molecular weight as 513 g/mol, that of the disaccharide CS molecule.(47) The resulting and distributions through the depth of the articular layers were averaged over all samples, and fit to a curve to produce continuous depth-varying distributions employed in the assignment of finite element properties in the theoretical modeling component of this study.
The osmolarity of the interstitial fluid of cartilage depends on the fixed charge density contributed by the negatively charged proteoglycans. This osmolarity c̅ can be estimated from use of the Donnan equilibrium theory.(29, 39) Assuming that ideal physico-chemical conditions prevail, and that cartilage is bathed in a solution comprised of NaCl as the only solute, the theoretical analysis yields where cF is the local fixed charge density and c̅* is the external bath osmolarity. Since the proteoglycans are enmeshed within the porous-permeable solid matrix of cartilage, their associated fixed charge density changes as the pore volume changes, thus bringing the charges closer together (when fluid is exuded) or further apart (when fluid is imbibed). From the equation of conservation of mass, the relation between cF and the tissue relative volume J is given by where and are, respectively, the fixed charge density and porosity in the reference configuration (where J = 1) (20). This relation derives from the fact that charge concentration is given as number of charges per interstitial fluid volume, and that the fluid and solid volume fractions add to unity when mixture constituents are assumed incompressible. Given and through the depth of cartilage from experimental measurements, these equations may be used to estimate the depth-dependent osmolarity under various tissue deformation histories.
The tissue deformation is evaluated with a finite element analysis as described in (4), using the biphasic theory (38) adapted to finite deformation(3) and accounting for tissue swelling conditions.(7) The collagenous matrix is modeled using a continuous fiber distribution (30) where fibers can only sustain tension.(1) Two analyses representative of cartilage explants studies are performed; in each, a cylindrical plug Ø4 mm × 8 mm, modeled with inhomogeneous and based on the experimental measurements, is loaded in unconfined compression between two impermeable rigid platens. In the first analysis, a platen-to-platen nominal engineering strain of 25% is applied in 0.5 s, representing a physiological loading rate, and the interstitial fluid osmolarity is evaluated as a function of the applied strain. In the second analysis, the equilibrium response of the cartilage plug is similarly evaluated for nominal strain increments between 0 and 25%, representing the long-term response of cartilage to static loading.
Part B: Measurement of Cell Properties
Baseline media preparation
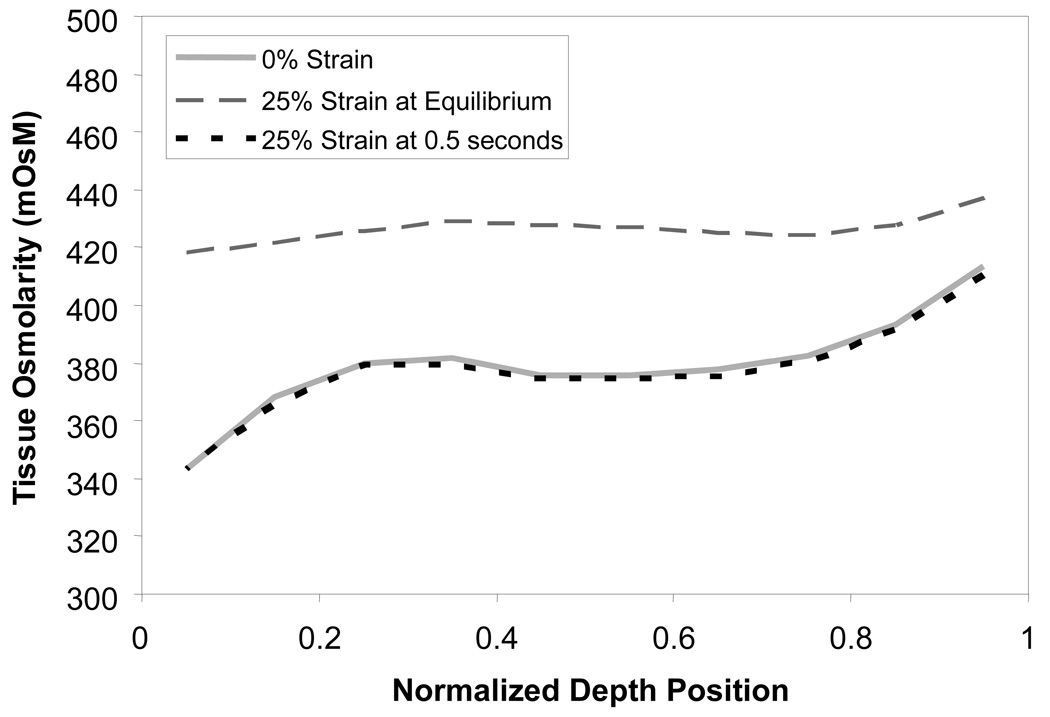
Culture medium for studies on isolated cells (Study B1: cell size change and intrinsic property characterization and Study B2: calcium signaling measurements) was high-glucose Dulbecco’s Modified Essential Medium, supplemented with 10% fetal bovine serum (FBS), amino acids (1× minimal essential amino acids, 1× non-essential amino acids), buffering agents (10 mM HEPES, 10 mM sodium bicarbonate, 10 mM TES, 10 mM BES), and antibiotics (100 U/ml penicillin, 100 µg/ml streptomycin). Medium was prepared and diluted to 300 mOsM with deionized water (300 media). 400 mOsM medium was prepared from this medium by addition of sucrose (400 media). Use of both hyper-osmotic media was to determine whether any observed differences between osmolarities was due solely to osmotic effects, as chondrocytes have previously demonstrated in short-term culture a metabolic sensitivity to sodium levels in culture media.(46) Media pH was adjusted to 7.25, and osmolarities for all media formulations were confirmed using a freezing point osmometer (Advanced Instruments, Inc.). Baseline media osmolarities were chosen based on the theoretical modeling of tissue osmolarity through the depth described above. 300 mOsM was chosen as the hypoosmotic osmolarity, as it is close to that of several commonly used culture media, and close to the resting osmolarity seen by chondrocytes in the tissue region near the articular surface (see Results Part A below and in Figure 3). 400 mOsM was chosen for the more hyperosmotic baseline condition, as it reflects osmolarities seen by chondrocytes in the tissue region near the bony interface under resting tissue conditions and by chondrocytes throughout the depth when the tissue is under the static loading conditions often used for in vitro studies of explants.
Figure 3.
Results of finite element modeling of juvenile cartilage tissue osmolarity under resting and strained conditions. Solid line represents tissue osmolarity under resting conditions. Dotted line represents osmolarity when tissue is under 25% engineering strain applied in 0.5 seconds. Dashed line represents osmolarity under 25% engineering strain applied in nominal increments, where tissue was allowed to equilibrate after each increment.
Cell isolation
Full-depth articular cartilage slices (n=70) were harvested from the femoral heads and patellofemoral grooves of 6 juvenile (4–6-month-old) bovine knees and placed into either 300 or 400 media. Zonal tissue pieces were harvested according to a protocol verified to yield three distinct cell populations.(28) Here, the top 10% was taken as upper zone (UZ), middle 10% was taken as middle zone (MZ), and the 10% above the bony interface surface was taken as lower zone (LZ). Zonal tissue pieces were pooled from all joints and digested in media of appropriate osmolarity, supplemented with 390 U/ml collagenase type V (Sigma Chemicals, St. Louis, MO) at 37 °C for 11 hours. Filtered cell digests were maintained in media of appropriate osmolarity and used within six hours of digestion.
Measurement of cell size, calcium signaling, and intrinsic property characterization of plated chondrocytes
Osmotic challenge solutions for the suspended zonal cell experiments were prepared to 200, 300, 400, and 500 mOsM from 300 mOsM Hank’s Buffered Salt Solution with calcium (Sigma) by adding sucrose or diluting with deionized water, respectively. Cells were plated on poly-L-lysine (Sigma) in custom microfluidic devices for 30 minutes at 37 °C.(12) As demonstrated previously (12), this transparent device consists of two inlet wells and one outlet well that allow complete exchanges in extracellular solution while cell volume changes are recorded. Cells were then loaded with 1 nM iso-osmotic (to baseline) fura-2AM (Molecular Probes), a calcium indicator dye, for 30 minutes at 37 °C.
The device was placed on an Olympus IX-70 inverted fluorescence microscope and the fura-2AM was replaced with baseline media. Microscope experiments were conducted at room temperature (21 °C) to minimize compartmentalization of the fura-2AM dye(31) and to ensure that volume responses were due to passive mechanisms only, favoring volume change responses that could be accurately modeled using transport equations. Baseline cell volume was recorded, after which hypo- or hyperosmotic loading solution (± 100 mOsM from baseline osmolarity) was introduced into the channel. This load magnitude provided clearly resolved cell size change from which intrinsic cell properties could be reliably extracted.
Images of fluorescent cells were obtained every five seconds for a total of five minutes from 340/380nm and 360nm wavelengths using the MetaFluor program (Universal Imaging Corporation, Malvern, PA). A custom MATLAB program was used to segment the cell areas from the images taken at the 360nm wavelength and, based on the assumed spherical shape, to convert cell area to cell volume at each time point (Study B1). Confocal microsopy confirmed that our plating protocol indeed yielded spherical cell shape. For Study B2, a custom MATLAB program was used to calculate the normalized concentration of intracellular calcium ([Ca2+]i) in each cell over time, by ratiometric analysis of images obtained at the 340/380nm wavelengths. The program then identified a Ca2+ peak (or transient) in the cells as a [Ca2+]i increase of more than three times the standard deviation above baseline level.
For Study B1, equations based on the Kedem-Katchalsky model of passive volume response to osmotic loading were also used to fit volume change data from hyperosmotic loading experiments.(3, 15) This yielded parameters of cell hydraulic membrane permeability and water content for each zone at each baseline condition. Water content of zonal cells for each baseline was confirmed by construction of Ponder’s plots, based on the Boyle-van’t Hoff relation between equilibrium cell volume (normalized to its baseline osmolarity volume) and reciprocal of bath osmolarity (scaled with the baseline osmolarity).(13, 22, 29, 32) The best-fit line and R2 values were determined from linear regression.
Two-way ANOVA was performed on baseline cell volume, water content (obtained from Kedem-Katchalsky model), and hydraulic membrane permeability data for factors of zone (3 levels) and baseline osmolarity (2 levels) to determine significance (p<0.05) of the main effect of each factor and interaction of the factors. If ANOVA showed that a factor had a significant main effect, a post-hoc least significant difference test was performed to assess significance (p<0.05) between each zonal-baseline group. Calcium signaling data were analyzed with χ2 tests between each zonal-baseline group at each osmotic loading condition (6 zonal-baseline groups, 2 loading conditions each) to determine significant differences (p<0.05).
Results
Part A: Tissue Osmolarity through the Depth
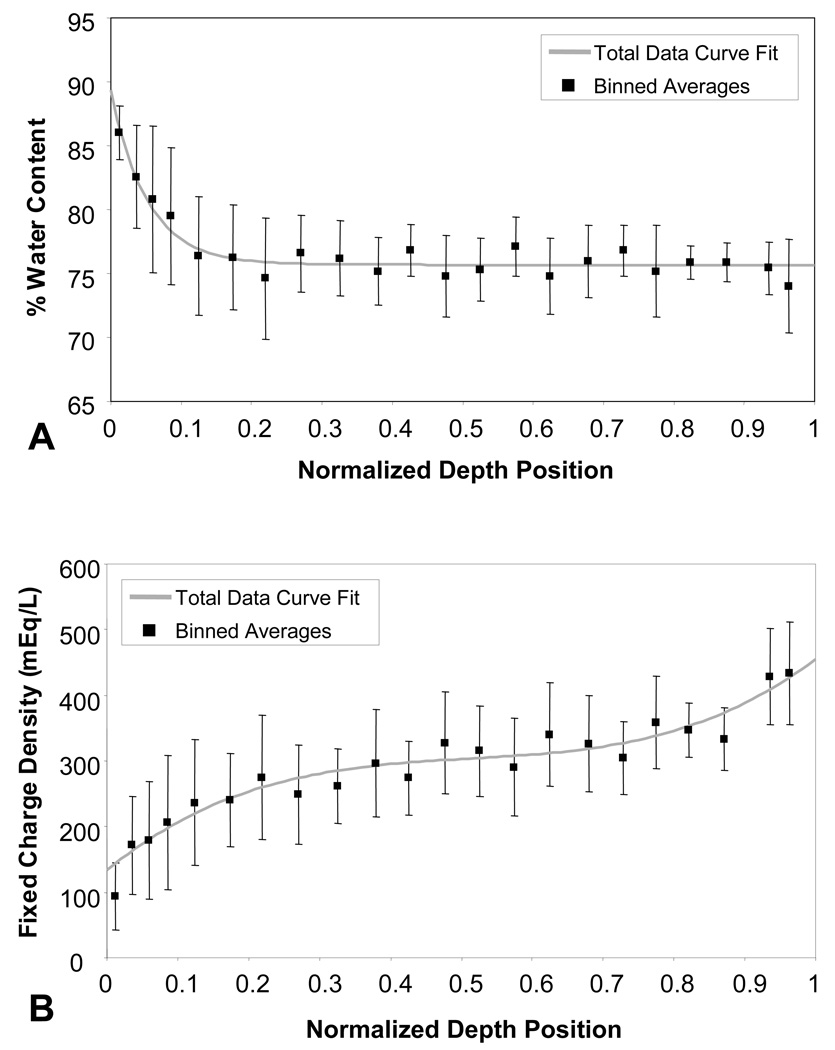
Tissue fixed charge density and percent water content through the depth are presented in Figure 2. Tissue water content was observed to decrease exponentially within the top 20% of the articular layer, from nearly 90% down to 75%, then to hold constant through the remainder of the depth. Fixed charge density increased from 100 mEq/L near the articular surface to 300 mEq/L in the middle zone, rising further to over 400 mEq/L in the lower zone.
Figure 2.
Percent water content (A) and fixed charge density (B) through the juvenile bovine cartilage tissue depth (0=cartilage surface, 1=bone) as determined by biochemical assaying. Solid lines represent (A) exponential decay and (B) third-degree polynomial curve fits through the total data set. Symbols represent average values (accompanied by standard deviation bars) obtained from binning data in 0.025 increments for normalized tissue depth positions 0–0.1; 0.05 increments were used thereafter.
The equations from curve fitting of and data were used along with finite element modeling to determine tissue osmolarity under resting and loaded conditions. The results of this analysis (Figure 3) demonstrate that, in the free-swelling configuration, when the external bath osmolarity is 300 mOsM, the interstitial fluid osmolarity increases from the upper zone (342 mOsM) to the lower zone (414 mOsM), consistent with the corresponding increase in proteoglycan content and decrease in water content. Upon physiological loading, as the nominal engineering compressive strain rises from 0 to 25% in 0.5 s, the interstitial osmolarity shows negligible change, due to the negligible fluid loss in the early-time response.
In contrast, the equilibrium response analysis shows a marked increase in interstitial fluid osmolarity with increasing strain, due to the exudation of interstitial fluid and reduction in pore volume. In the upper zone, which exhibits the greatest volume decrease, the osmolarity increases from 342 to 418 mOsM; in the lower zone, it increases from 414 to 437 mOsM.
Part B: Measurement of Cell Properties
Study B1 (Baseline cell volume and intrinsic property characterization of plated chondrocytes)
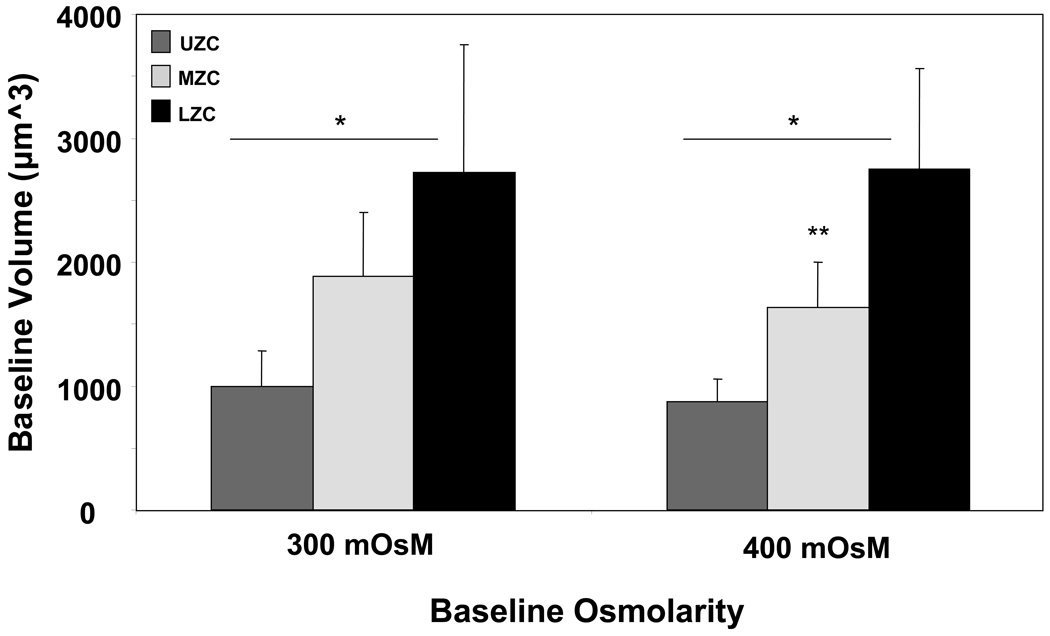
Baseline cell volume (Figure 4, n=70–100 cells per zone, each baseline): Both zone and baseline showed significant effects on cell volume (p<0.01 for both factors), while there was no significant interaction between zone and baseline (p=0.61). Each zone exhibited a significantly different cell volume than the other two zones at either baseline (p<0.01), with volumes measured for LZC > MZC > UZC. There was no significance (p>0.05) between baselines for UZC and LZC, while MZC were significantly smaller at 400 mOsm (p<0.05).
Figure 4.
Baseline cell volume of zonal cells isolated during digestion into 300 or 400 mOsM media (*p<0.05 with other zones, same baseline; **p<0.05 with MZC at 300 mOsM baseline; n=70–100 cells per zone, each baseline).
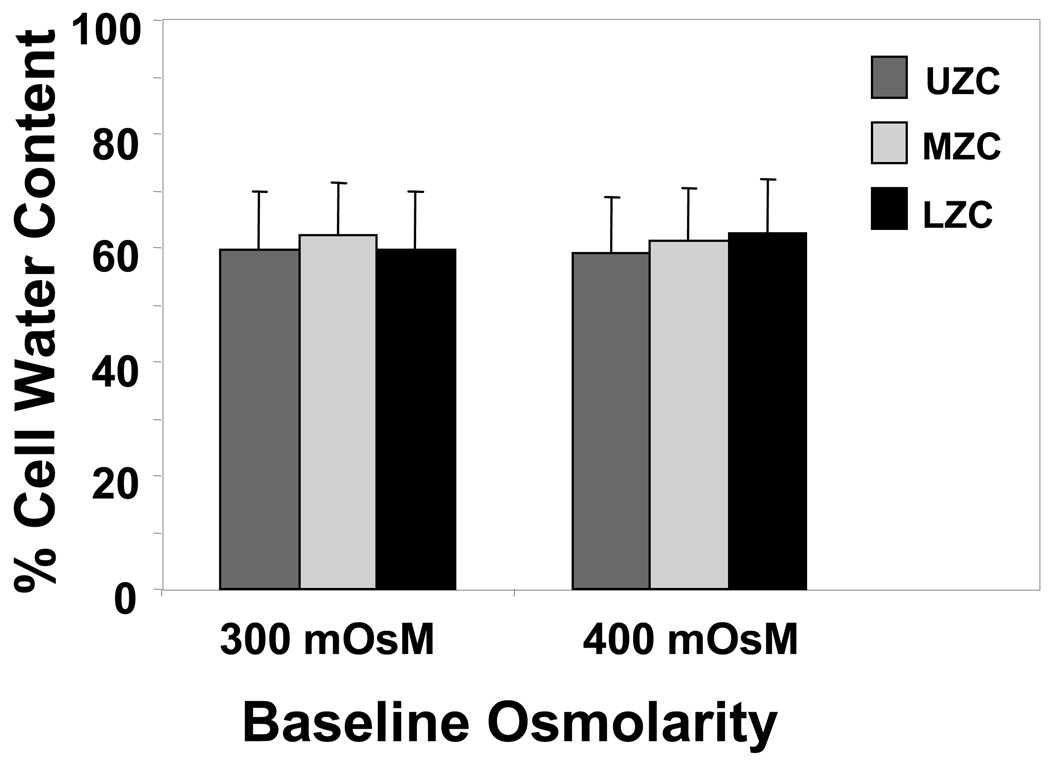
Cell water content (Figure 5, Table 1, n=37–65 cells per zone, each baseline): When Ponder’s plots using average Veq values were performed for each zone at each baseline, the plots from all zones showed very linear behavior (R2>0.98 in all cases, Table 1). Water content values measured from the transient volume response (Figure 5) were in good agreement with results from the Ponder’s plots: percentage osmotically active baseline water content falls within the narrow range of 58–62% for all zones. ANOVA returned no significant effect for either zone (p=0.23) or baseline (p=0.71), and no significant interaction between zone and baseline (p=0.31) for cell water content data.
Figure 5.
Zonal cell water content at each osmotic baseline, obtained from application of Kedem-Katchalsky equations to transient change in cell volume response to step osmotic loading. (all groups average 61 ± 1%, n=37–65 cells per zone, each baseline).
Table 1.
Zonal cell water content at each osmotic baseline, obtained from least-squares liner fit to Ponder’s plot, for cells subjected to ±100 mOsM step osmotic load from 300 or 400 mOsM baseline media. R2 presented are those of the linear curve-fit through the three points graphed for each zone, each baseline condition (n=38–95 cells per zone, each baseline).
| Zone | 300 mOsM | 400 mOsM |
|---|---|---|
| Upper | 62% (R2=0.9998) | 62% (R2=0.9982) |
| Middle | 61% (R2=1.0000) | 59% (R2=0.9986) |
| Lower | 61% (R2=0.9998) | 58% (R2=0.9884) |
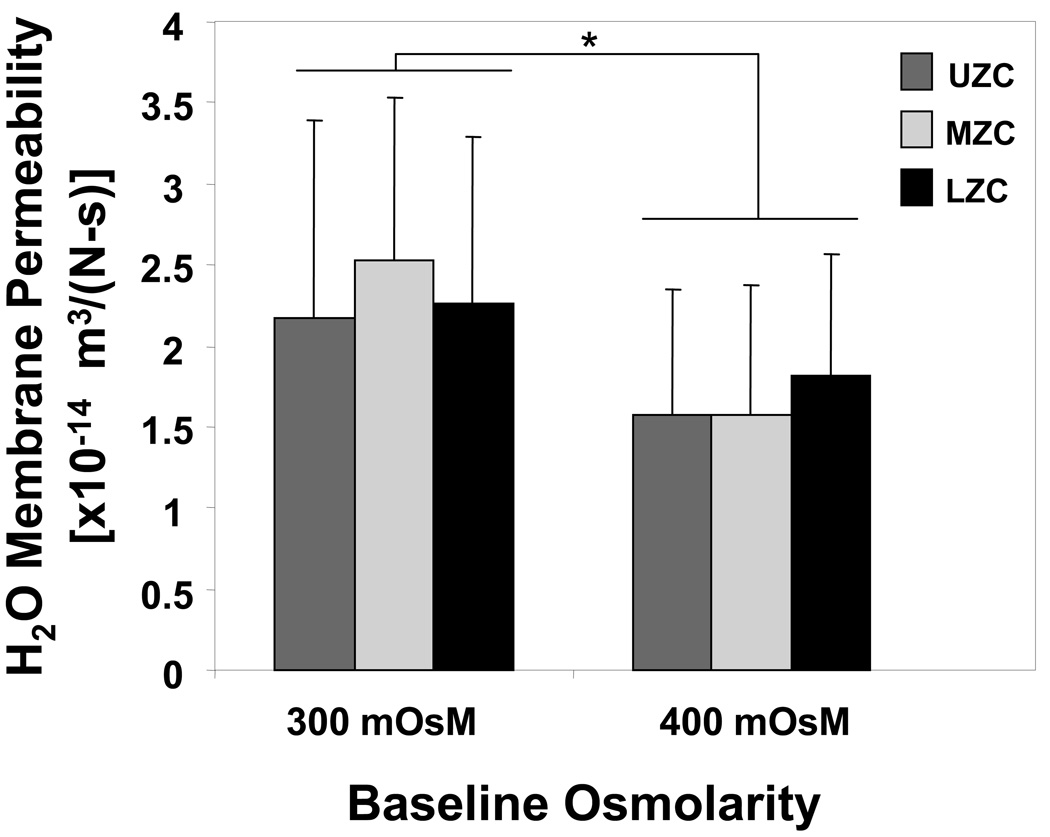
Hydraulic membrane permeability (Figure 6, n=37–65 cells per zone, each baseline): The hydraulic membrane permeability was measured from the transient volume response, yielding no significant effect of zone (p=0.31), while the effect of baseline was significant (p<0.01). There was no significant interaction between zone and baseline (p=0.13). All zonal groups at the 400 baseline had significantly lower membrane permeability than their respective zonal groups at 300 baseline (p<0.05).
Figure 6.
Zonal cell hydraulic membrane permeability, obtained from application of Kedem-Katchalsky equations to cell size change response to step osmotic loading. (*p<0.01 with same zone at 300 mOsM baseline; n=37–65 cells per zone, each baseline).
Study B2 (Calcium signaling)
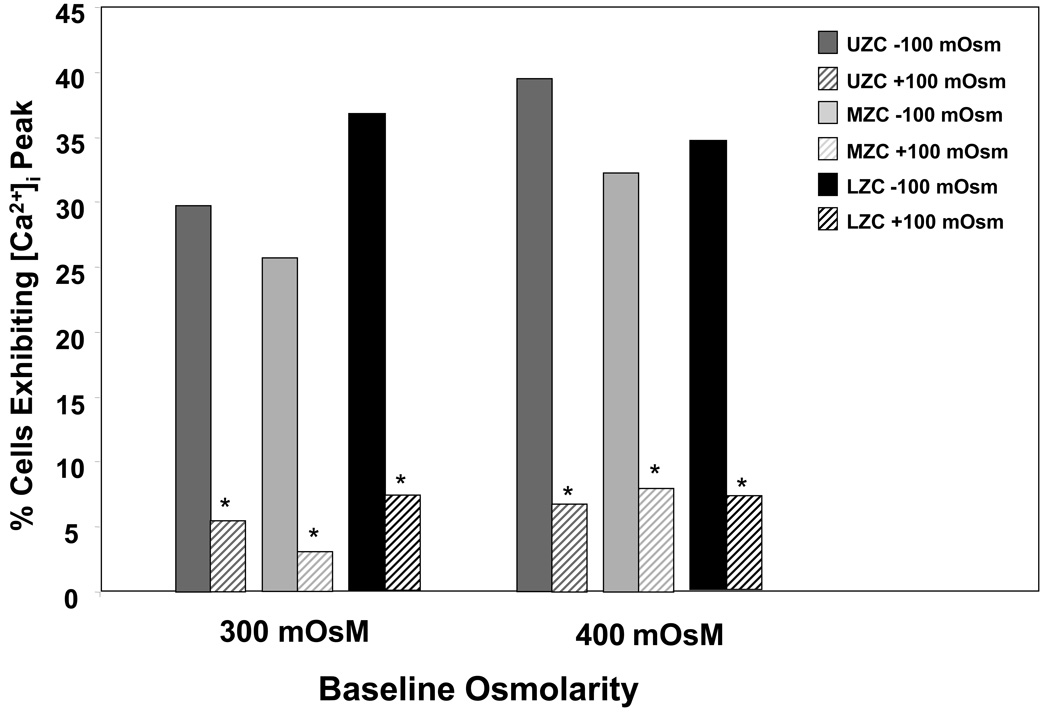
Calcium signaling (Figure 7, n=84–119 cells per zone, each baseline): No significant differences were detected (p>0.05) between zonal groups within either baseline, or between baselines within any of the zones; however, all three zonal groups, at both baselines, exhibited a significantly lower (p<0.05) level of signaling under hyperosmotic versus hypoosmotic loading.
Figure 7.
Percent zonal cells exhibiting at least one intracellular calcium peak upon ±100 mOsM step osmotic load from 300 or 400 mOsM baseline media (*p<0.05 with −100 mOsM group, same zone same baseline; n=84–119 cells per zone, each baseline).
Discussion
Chondrocytes are exposed to a variable osmotic baseline environment established by the local proteoglycan-related FCD. This baseline condition may vary over time due to changes in FCD, either as a result of static loading or due to metabolic activities that alter the proteoglycan content. The current investigation examined the effects of this baseline on cell water transport properties in an effort to provide greater insight into the depth-varying properties of chondrocytes and cartilage.
In this study, media of prescribed osmolarities were used both to establish the baseline cell condition and to stimulate volume changes from which cell transport properties could be extracted and biological responses monitored. In order to properly characterize the baseline osmolarity experienced by chondrocytes in the bovine juvenile knee explant model, and the alterations to this environment that accompany mechanical loading, a finite element analysis was conducted. This analysis, which employed experimentally derived depth-dependent FCD and water content, suggests that changes in interstitial fluid osmolarity are negligible in the short-term tissue response to loading conditions that reflect physiologic deformational parameters (Figure 3). Under prolonged static loading that is representative of some in vitro studies of cartilage explants (8, 45), the osmolarity of the extracellular environment increases by approximately 20 mOsM in the LZ to 80 mOsM in the UZ. In contrast, the variation in osmolarity from the UZ to the LZ was approximately 70 mOsM in the unloaded and short-term loading response states. The tissue osmolarity values obtained from this analysis were used to select the baseline osmotic conditions at which cell properties would be tested in Part B of the study.
Differences observed in the zonal chondrocyte volume after cell isolation confirmed that these zones contain distinct cell populations (Figure 4). (6, 49) Because the cell volume of UZC and LZC did not vary upon isolation into two different osmotic baselines, the data demonstrate that chondrocytes from these zones exhibit comparable regulatory volume responses under long-term culture in non-native osmolarities, as determined by Study A. MZC cells, however, do not appear to exhibit the same response, indicating that the volume regulatory mechanisms of this zone differ from those of other zones. In previous studies, this response was observed in mixed-zone populations (10, 26, 27) that were maintained at 37 °C. According to our results, the overall population response in those studies may therefore be attributed to specific zonal subpopulations. In the current study, consistent with prior reports (21), the regulatory response was not observed during the relatively short time frame used to stimulate passive cell volume changes for the extraction of cell material properties at room temperature (Study B1).
The results of Study B1 on cell water content and hydraulic membrane permeability indicate that baseline osmolarity has a significant effect on membrane permeability for all zonal groups but no effect on water content for cells from any of the zones. The water content and permeability values determined in the present study are in agreement with the range of values obtained in previous studies for mixed and middle zone cells tested under various baseline osmolarity and temperature conditions (21, 36). It remains to be determined what physical modulations to the cell are brought about by culture in different osmolarities that could explain the drop in membrane permeability, and what implication this effect may have on progression of mechanotransduction pathways.
A study that noted changes in the viscoelastic properties of chondrocyte with baseline culture osmolarity hypothesized that osmotic conditions regulate cytoskeletal organization, a key contributor to cell material properties (21). In the case of hydraulic membrane permeability, culture osmolarity could regulate expression of the membrane water channels thought to be involved in passive water transport (37). Further investigation into the effects of osmolarity on this expression is needed. Taken together with the results of the viscoelastic study (21), the current hydraulic permeability results indicate that cell culture conditions should be chosen carefully when testing isolated cell material properties, as the osmolarity in which the cells are cultured may affect study results.
Unlike previous findings that indicate zonal variation in elastic and viscoelastic moduli of chondrocytes (14, 44), the current study demonstrates no variation in zonal chondrocyte water transport properties at either baseline.
In contrast to previous studies in the literature on osmotic loading of chondrocytes in explant culture (9), the short-term monolayer culture employed in Studies B1 and B2 readily permitted real-time measurements of changes in cell size and intracellular calcium elicited from an isolated osmotic stimulus. While calcium response to osmotic challenge is traditionally studied at 37 °C to account for the involvement of active mechanisms, microscope-based experiments in this study were conducted at room temperature to ensure that volume responses were due to passive mechanisms only, favoring responses that could be accurately modeled using transport equations. The robust calcium signaling exhibited during hypotonic loading from both baselines by cells from all zones agrees with that previously reported for mixed zone populations at loaded at room temperature (13). The difference in calcium signaling prevalence observed between hypo- and hyperosmotically loaded cell populations from all zones was not seen in a previous study that loaded mixed zone populations at 37 °C (41). Other studies have indicated that similar pathways (extracellular calcium influx, inositol phosphate mobilization) are involved in cell calcium response to either type of loading (16, 17). Our results indicate that loading chondrocytes at non-physiologic temperatures may alter these or other unexplored segments of the calcium signaling pathway, such that cells exhibit distinct responses to hypo- and hyperosmotic loading regardless of the baseline from which they are loaded. Additionally, the similarity in percentage of cells exhibiting calcium signaling events at either baseline culture osmolarity indicates that osmolarity may not be a regulator of signaling pathway functioning. Further investigations, including studies conducted at 37 °C, are needed in order to fully understand the sensitivity of cell signaling pathways to cell osmotic culture conditions.
Juvenile bovine tissue was chosen for these studies because it allows comparison of our results to the vast literature on its properties and those of its cells. Also, the thickness of juvenile bovine tissue allows for its easy separation into depth-dependent zones that contain distinct cell populations that traditionally reside at varying osmolarities.(28) The juvenile bovine tissue used in this study is substantially thicker (~7.0 mm) than adult tissue (~1.5 mm adult bovine tissue(34)); zonal cells as defined by the fraction of their depth may not correspond to zonal cells in thinner adult tissue due to post-natal tissue remodeling. Therefore, in this study we did not use the classical terminology; i.e., superficial, middle, and deep zones. Instead, in Part A of this study we showed that the osmotic environment varied significantly through the depth of juvenile tissue, and that our isolation technique produced three significantly distinct populations, as ocumented by cell size (Figure 4). This supports the validity of the conclusions drawn for the hypotheses of Part B, which address the effect of physiologically-relevant osmotic baselines on cell properties.
In summary, the current study demonstrates that the baseline osmotic environment of chondrocytes increases from ~340 mOsM at the articular surface to ~410 mOsM at the cartilage bone interface, under unloaded conditions; that the depth-varying osmolarity remains nearly unchanged in the short-term response to mechanical loading; and that prolonged static compression may produce an increase of ~80 mOsM near the surface and ~20 mOsm near the bone, as a result of increased localized FCD. This study also demonstrates an effect of baseline culture osmolarity on hydraulic water permeability for zonal chondrocyte subpopulations, but no such effect on fractional water content. The preliminary cell signaling data obtained here further indicate that long-term culture at specific osmolarities may not have a critical influence in the operation or design of cell mechanotransduction pathways. Knowledge of how chondrocyte properties vary with cell environment is useful for a range of physiologic and experimental applications, especially given the dependence of cartilage tissue properties on proper functioning of the cells that reside within. Water transport properties of chondrocytes are also needed in the analysis of the mechanics of chondrocytes in their in situ environment, as demonstrated in our recent finite element study (2). The results presented here provide new data and greater insight into the variation of the osmotic environment and water transport properties of chondrocytes through the depth of the articular layer.
Figure 1.
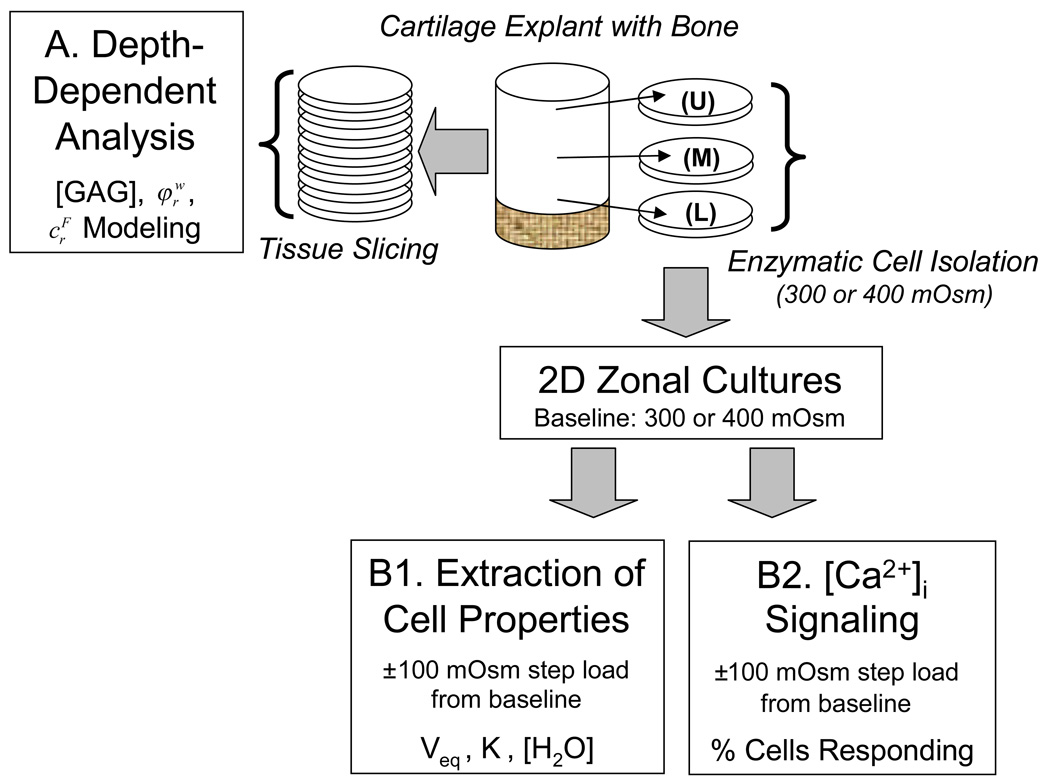
Schematic of the study design, with study labels A, B1, and B2 corresponding to expanded descriptions in the Materials and Methods section.
Acknowledgments
This study was supported by the National Institute of Arthritis and Musculoskeletal and Skin Diseases of the National Institutes of Health, USA (AR052871) and by an NSF Graduate Research Fellowship (ESO). The authors wish to thank Richard Shin, Angie Cheng, Pojen Deng, Sarah Kramer, and David Mao for performing image analysis and biochemical assays.
References
- 1.Ateshian GA. Anisotropy of fibrous tissues in relation to the distribution of tensed and buckled fibers. J Biomech Eng. 2007;129:240–249. doi: 10.1115/1.2486179. [DOI] [PMC free article] [PubMed] [Google Scholar]
- 2.Ateshian GA, Costa KD, Hung CT. A theoretical analysis of water transport through chondrocytes. Biomech Model Mechanobiol. 2007;6:91–101. doi: 10.1007/s10237-006-0039-9. [DOI] [PMC free article] [PubMed] [Google Scholar]
- 3.Ateshian GA, Ellis BJ, Weiss JA. Equivalence between short-time biphasic and incompressible elastic material responses. J Biomech Eng. 2007;129:405–412. doi: 10.1115/1.2720918. [DOI] [PMC free article] [PubMed] [Google Scholar]
- 4.Ateshian GA, Rajan V, Chahine NO, Canal CE, Hung CT. In Review. Modeling the matrix of articular cartilage using a continuous fiber angular distribution predicts many observed phenomena. Journal of Biomechanical Engineering. doi: 10.1115/1.3118773. [DOI] [PMC free article] [PubMed] [Google Scholar]
- 5.Aydelotte MB, Greenhill RR, Kuettner KE. Differences between sub-populations of cultured bovine articular chondrocytes. II. Proteoglycan metabolism. Connect Tissue Res. 1988;18:223–234. doi: 10.3109/03008208809016809. [DOI] [PubMed] [Google Scholar]
- 6.Aydelotte MB, Kuettner KE. Differences between sub-populations of cultured bovine articular chondrocytes. I. Morphology and cartilage matrix production. Connect Tissue Res. 1988;18:205–222. doi: 10.3109/03008208809016808. [DOI] [PubMed] [Google Scholar]
- 7.Azeloglu EU, Albro MB, Thimmappa VA, Ateshian GA, Costa KD. Heterogeneous transmural proteoglycan distribution provides a mechanism for regulating residual stresses in the aorta. Am J Physiol Heart Circ Physiol. 2008;294:H1197–H1205. doi: 10.1152/ajpheart.01027.2007. [DOI] [PubMed] [Google Scholar]
- 8.Burton-Wurster N, Vernier-Singer M, Farquhar T, Lust G. Effect of compressive loading and unloading on the synthesis of total protein, proteoglycan, and fibronectin by canine cartilage explants. J Orthop Res. 1993;11:717–729. doi: 10.1002/jor.1100110514. [DOI] [PubMed] [Google Scholar]
- 9.Bush PG, Hall AC. The osmotic sensitivity of isolated and in situ bovine articular chondrocytes. J Orthop Res. 2001;19:768–778. doi: 10.1016/S0736-0266(01)00013-4. [DOI] [PubMed] [Google Scholar]
- 10.Bush PG, Hall AC. Regulatory volume decrease (RVD) by isolated and in situ bovine articular chondrocytes. J Cell Physiol. 2001;187:304–314. doi: 10.1002/jcp.1077. [DOI] [PubMed] [Google Scholar]
- 11.Byers BA, Mauck RL, Chiang IE, Tuan RS. Transient Exposure to Transforming Growth Factor Beta 3 under Serum-Free Conditions Enhances the Biomechanical and Biochemical Maturation of Tissue-Engineered Cartilage. Tissue Eng Part A. 2008 doi: 10.1089/ten.tea.2007.0222. [DOI] [PMC free article] [PubMed] [Google Scholar]
- 12.Chao PG, Tang Z, Angelini E, West AC, Costa KD, Hung CT. Dynamic osmotic loading of chondrocytes using a novel microfluidic device. J Biomech. 2005;38:1273–1281. doi: 10.1016/j.jbiomech.2004.06.016. [DOI] [PubMed] [Google Scholar]
- 13.Chao PH, West AC, Hung CT. Chondrocyte intracellular calcium, cytoskeletal organization, and gene expression responses to dynamic osmotic loading. Am J Physiol Cell Physiol. 2006;291:C718–C725. doi: 10.1152/ajpcell.00127.2005. [DOI] [PubMed] [Google Scholar]
- 14.Darling EM, Zauscher S, Guilak F. Viscoelastic properties of zonal articular chondrocytes measured by atomic force microscopy. Osteoarthritis Cartilage. 2006;14:571–579. doi: 10.1016/j.joca.2005.12.003. [DOI] [PubMed] [Google Scholar]
- 15.Elmoazzen HY, Elliott JA, McGann LE. The effect of temperature on membrane hydraulic conductivity. Cryobiology. 2002;45:68–79. doi: 10.1016/s0011-2240(02)00107-4. [DOI] [PubMed] [Google Scholar]
- 16.Erickson GR, Alexopoulos LG, Guilak F. Hyper-osmotic stress induces volume change and calcium transients in chondrocytes by transmembrane, phospholipid, and G-protein pathways. J Biomech. 2001;34:1527–1535. doi: 10.1016/s0021-9290(01)00156-7. [DOI] [PubMed] [Google Scholar]
- 17.Erickson GR, Northrup DL, Guilak F. Hypo-osmotic stress induces calcium-dependent actin reorganization in articular chondrocytes. Osteoarthritis Cartilage. 2003;11:187–197. doi: 10.1053/s1063-4584(02)00347-3. [DOI] [PubMed] [Google Scholar]
- 18.Farndale RW, Buttle DJ, Barrett AJ. Improved quantitation and discrimination of sulphated glycosaminoglycans by use of dimethylmethylene blue. Biochim Biophys Acta. 1986;883:173–177. doi: 10.1016/0304-4165(86)90306-5. [DOI] [PubMed] [Google Scholar]
- 19.Freed LE, Marquis JC, Nohria A, Emmanual J, Mikos AG, Langer R. Neocartilage formation in vitro and in vivo using cells cultured on synthetic biodegradable polymers. J Biomed Mater Res. 1993;27:11–23. doi: 10.1002/jbm.820270104. [DOI] [PubMed] [Google Scholar]
- 20.Frijns AJH, Huyghe JM, Janssen JD. Validation of the quadriphasic mixture theory for intervertebral disc tissue. International Journal of Engineering Science. 1997;35:1419–1429. [Google Scholar]
- 21.Guilak F, Erickson GR, Ting-Beall HP. The effects of osmotic stress on the viscoelastic and physical properties of articular chondrocytes. Biophys J. 2002;82:720–727. doi: 10.1016/S0006-3495(02)75434-9. [DOI] [PMC free article] [PubMed] [Google Scholar]
- 22.Guilak F, Ratcliffe A, Mow VC. Chondrocyte deformation and local tissue strain in articular cartilage: a confocal microscopy study. J Orthop Res. 1995;13:410–421. doi: 10.1002/jor.1100130315. [DOI] [PubMed] [Google Scholar]
- 23.Hopewell B, Urban JP. Adaptation of articular chondrocytes to changes in osmolality. Biorheology. 2003;40:73–77. [PubMed] [Google Scholar]
- 24.Hung CT, LeRoux MA, Palmer GD, Chao PH, Lo S, Valhmu WB. Disparate aggrecan gene expression in chondrocytes subjected to hypotonic and hypertonic loading in 2D and 3D culture. Biorheology. 2003;40:61–72. [PubMed] [Google Scholar]
- 25.Kedem O, Katchalsky A. Thermodynamic analysis of the permeability of biological membranes to non-electrolytes. Biochim Biophys Acta. 1958;27:229–246. doi: 10.1016/0006-3002(58)90330-5. [DOI] [PubMed] [Google Scholar]
- 26.Kerrigan MJ, Hall AC. Control of chondrocyte regulatory volume decrease (RVD) by [Ca(2+)](i) and cell shape. Osteoarthritis Cartilage. 2007 doi: 10.1016/j.joca.2007.07.006. [DOI] [PubMed] [Google Scholar]
- 27.Kerrigan MJ, Hook CS, Qusous A, Hall AC. Regulatory volume increase (RVI) by in situ and isolated bovine articular chondrocytes. J Cell Physiol. 2006;209:481–492. doi: 10.1002/jcp.20758. [DOI] [PubMed] [Google Scholar]
- 28.Kim TK, Sharma B, Williams CG, Ruffner MA, Malik A, et al. Experimental model for cartilage tissue engineering to regenerate the zonal organization of articular cartilage. Osteoarthritis Cartilage. 2003;11:653–664. doi: 10.1016/s1063-4584(03)00120-1. [DOI] [PubMed] [Google Scholar]
- 29.Lai WM, Hou JS, Mow VC. A triphasic theory for the swelling and deformation behaviors of articular cartilage. J Biomech Eng. 1991;113:245–258. doi: 10.1115/1.2894880. [DOI] [PubMed] [Google Scholar]
- 30.Lanir Y. Constitutive equations for fibrous connective tissues. J Biomech. 1983;16:1–12. doi: 10.1016/0021-9290(83)90041-6. [DOI] [PubMed] [Google Scholar]
- 31.Malgaroli A, Milani D, Meldolesi J, Pozzan T. Fura-2 measurement of cytosolic free Ca2+ in monolayers and suspensions of various types of animal cells. J Cell Biol. 1987;105:2145–2155. doi: 10.1083/jcb.105.5.2145. [DOI] [PMC free article] [PubMed] [Google Scholar]
- 32.Maroudas A, Evans H. A study of ionic equilibria in cartilage. Conn Tiss Res. 1972;1:69–77. [Google Scholar]
- 33.Maroudas A, Ziv I, Weisman N, Venn M. Studies of hydration and swelling pressure in normal and osteoarthritic cartilage. Biorheology. 1985;22:159–169. doi: 10.3233/bir-1985-22206. [DOI] [PubMed] [Google Scholar]
- 34.Marshall KW, Mikulis DJ, Guthrie BM. Quantitation of articular cartilage using magnetic resonance imaging and three-dimensional reconstruction. J Orthop Res. 1995;13:814–823. doi: 10.1002/jor.1100130603. [DOI] [PubMed] [Google Scholar]
- 35.Mauck RL, Nicoll SB, Seyhan SL, Ateshian GA, Hung CT. Synergistic action of growth factors and dynamic loading for articular cartilage tissue engineering. Tissue Eng. 2003;9:597–611. doi: 10.1089/107632703768247304. [DOI] [PubMed] [Google Scholar]
- 36.McGann LE, Stevenson M, Muldrew K, Schachar N. Kinetics of osmotic water movement in chondrocytes isolated from articular cartilage and applications to cryopreservation. J Orthop Res. 1988;6:109–115. doi: 10.1002/jor.1100060114. [DOI] [PubMed] [Google Scholar]
- 37.Mobasheri A, Trujillo E, Bell S, Carter SD, Clegg PD, et al. Aquaporin water channels AQP1 and AQP3, are expressed in equine articular chondrocytes. Vet J. 2004;168:143–150. doi: 10.1016/j.tvjl.2003.08.001. [DOI] [PubMed] [Google Scholar]
- 38.Mow VC, Kuei SC, Lai WM, Armstrong CG. Biphasic creep and stress relaxation of articular cartilage in compression? Theory and experiments. J Biomech Eng. 1980;102:73–84. doi: 10.1115/1.3138202. [DOI] [PubMed] [Google Scholar]
- 39.Overbeek JT. The Donnan equilibrium. Prog Biophys Biophys Chem. 1956;6:57–84. [PubMed] [Google Scholar]
- 40.Palmer GD, Chao PhPH, Raia F, Mauck RL, Valhmu WB, Hung CT. Time-dependent aggrecan gene expression of articular chondrocytes in response to hyperosmotic loading. Osteoarthritis Cartilage. 2001;9:761–770. doi: 10.1053/joca.2001.0473. [DOI] [PubMed] [Google Scholar]
- 41.Pritchard S, Votta BJ, Kumar S, Guilak F. Interleukin-1 inhibits osmotically induced calcium signaling and volume regulation in articular chondrocytes. Osteoarthritis Cartilage. 2008 doi: 10.1016/j.joca.2008.04.003. [DOI] [PMC free article] [PubMed] [Google Scholar]
- 42.Riesle J, Hollander AP, Langer R, Freed LE, Vunjak-Novakovic G. Collagen in tissue-engineered cartilage: types, structure, and crosslinks. J Cell Biochem. 1998;71:313–327. doi: 10.1002/(sici)1097-4644(19981201)71:3<313::aid-jcb1>3.0.co;2-c. [DOI] [PubMed] [Google Scholar]
- 43.Sanchez JC, Wilkins RJ. Changes in intracellular calcium concentration in response to hypertonicity in bovine articular chondrocytes. Comp Biochem Physiol A Mol Integr Physiol. 2004;137:173–182. doi: 10.1016/j.cbpb.2003.09.025. [DOI] [PubMed] [Google Scholar]
- 44.Shieh AC, Athanasiou KA. Biomechanics of single zonal chondrocytes. J Biomech. 2006;39:1595–1602. doi: 10.1016/j.jbiomech.2005.05.002. [DOI] [PubMed] [Google Scholar]
- 45.Torzilli PA, Grigiene R, Huang C, Friedman SM, Doty SB, et al. Characterization of cartilage metabolic response to static and dynamic stress using a mechanical explant test system. J Biomech. 1997;30:1–9. doi: 10.1016/s0021-9290(96)00117-0. [DOI] [PubMed] [Google Scholar]
- 46.Urban JP, Hall AC, Gehl KA. Regulation of matrix synthesis rates by the ionic and osmotic environment of articular chondrocytes. J Cell Physiol. 1993;154:262–270. doi: 10.1002/jcp.1041540208. [DOI] [PubMed] [Google Scholar]
- 47.Venn M, Maroudas A. Chemical composition and swelling of normal and osteoarthrotic femoral head cartilage. I. Chemical composition. Ann Rheum Dis. 1977;36:121–129. doi: 10.1136/ard.36.2.121. [DOI] [PMC free article] [PubMed] [Google Scholar]
- 48.Yellowley CE, Hancox JC, Donahue HJ. Effects of cell swelling on intracellular calcium and membrane currents in bovine articular chondrocytes. J Cell Biochem. 2002;86:290–301. doi: 10.1002/jcb.10217. [DOI] [PubMed] [Google Scholar]
- 49.Youn I, Choi JB, Cao L, Setton LA, Guilak F. Zonal variations in the three-dimensional morphology of the chondron measured in situ using confocal microscopy. Osteoarthritis Cartilage. 2006;14:889–897. doi: 10.1016/j.joca.2006.02.017. [DOI] [PubMed] [Google Scholar]


