Abstract
A two dimensional model of water, so-called Mercedes-Benz model, was used to study effects of the size of hydrophobic solute on the insertion thermodynamics in electrolyte solutions. The model was examined by the constant pressure Monte Carlo computer simulation. The results were compared with the experimental data for noble gasses and methane in water and electrolyte solution. The influence of different ions at infinite dilution on the free energy of transfer was explored. Qualitative agreement with the experimental results was obtained. The mechanism of Hofmeister effects was proposed.
Keywords: Mercedes-Benz model, hydrophobic hydration, Hofmeister effect, salting-out, Monte Carlo
1. Introduction
Due to its central role in chemistry and biology, the hydrophobic effect has been a subject of numerous experimental and theoretical studies.1–2 Although its molecular origin is still a subject of debate, it can be, beyond doubt, characterized by three experimental features: i) large positive free energy for transferring a nonpolar solute into water, ii) large negative entropy at about 25 °C, and iii) large positive heat capacity of such transfer. These three properties, depend on the size of the solute, more precisely, they are known to grow proportional to the surface area of the solute.3–4
The hydrophobic effect is modulated in presence of electrolytes in water. The phenomenon was first reported by Hofmeister, studying how different salts affect the solubility of proteins in water.5–6 The conclusion was that the increasing salt concentration reduces the solubility of hydrophobic solutes in aqueous solutions7 in accordance with the Setschenov equation:8
| (1) |
where ci and ci(0) are the molar solubilities of the hydrophobe in a salt solution and water, respectively, cS is the molar concentration of the salt, and kS is the salt's Setschenov salting-out coefficient. The Hofmeister series is a list of ions rank-ordered in terms of how strongly they modulate the hydrophobicity.9–10 In general, the salt effects on nonpolar solute solubilities correlate with charge densities of the salts; small ions (high charge densities) tend to reduce the hydrophobic solubilities in water (“salting-out” effect, positive kS), whereas large ions (small charge densities) tend to increase it (“salting in” effect, negative kS). The effects are more pronounced for anions than for cations. There are, however, exceptions to these trends, such as Li+ ion.11 Although the lithium ion, due to its small size, has a larger charge density than sodium ion, it is less efficient in salting out than Na+. Several different explanations exist for this phenomenon.11–13
Because of their relevance for science and technology, substantial attention has been paid to the Hofmeister-series related phenomena such as, ion influence on surface tension, solubility of hydrophobes, protein stability, and others. Despite of this, the molecular level mechanism by which they occur is still unclear.14 It was proposed that salting-out occurs because the salts are competing with hydrophobes for solvation water. Newer experiments and computer simulations suggest a different explanation. Recent molecular dynamics simulations15–16 indicated that the salting-out effect caused by small ions is due to the exclusion of hydrophobe from the ion's first water shell. Similar conclusions were drawn from the Monte Carlo simulations of small hydrophobes in the presence of simple ions.11 The hydrophobe inserts either into the first water shell around the ion, or into the second water shell. Small ions bind water tightly, so the hydrophobe is excluded from their first solvation shell, which eventually leads to salting out of the hydrophobes.11 This finding is consistent with the experimental studies of solubility of hydrophobic solutes.17 The authors17 showed that the first hydration shell water is responsible for the Hofmeister effect, more exactly, the Hofmeister effect is caused by the change in the hydration water structure due to the presence of the salt.17
The solubility of hydrophobes in aqueous electrolyte solutions depends on the size of the solute. It is well known that small and large hydrophobic solutes (compared to the size of a water molecule) exhibit remarkably different hydration thermodynamic; small solutes can accommodate in water with minor perturbation of the water structure, while hydration of large solutes is accompanied by major changes in such system.18 As a consequence, the Setschenov salting-out coefficients depend not only on the salt, but also on the hydrophobic solute's size. Presuming the salting-out mechanism discussed above, kS for a chosen salt should increase with the increasing size of the hydrophobe. This was, for a few isolated examples, confirmed by Smith.15 For a better understanding, however, a more systematic study is needed.
The purpose of this work is to investigate how does the presence of different ions affects the solubility of hydrophobic solutes. Water molecules were modeled by the so-called Mercedes-Benz (MB) model, which was previously used to study properties of liquid water, as well as, the hydrophobic effect.19,20 The model correctly explains the qualitative behavior of the Setschenov salting-out coefficient for benzene in the presence of different salts11. Here we extend our previous calculations to examine the possible influence of the size of the hydrophobic solute on the ordering of the Hofmeister series.
The justification of the model used is in details given in Ref.11 In spite its simplicity there are several arguments speaking in its favor. As the model was extended to more realistic three dimensional one, the results obtained did not show any qualitative differences, however the length of the simulations necessary to obtain equally good statistics drastically increased.21 For realistic models some thermodynamic properties, such as heat capacity, are very difficult to obtain with a sufficient degree of accuracy. In addition, the two-dimensional MB model serves as a benchmark to develop analytical theories that are essentially dimension independent.20,22–24
2. The Model Description and the Simulation
The two-dimensional MB model was used to represent water molecules.11,18–20 Each water molecule is represented as a two-dimensional disk that interacts with other molecules through a Lennard-Jones (LJ) interaction and through an orientational-dependent hydrogen-bonding (HB) interaction. The name “MB” arises because there are three hydrogen-bonding arms, arranged as in the Mercedes Benz logo (cf Figure 1). The model reproduces qualitatively many properties of pure water, hydrophobic effect, ion effects, and Hofmeister series.20
Figure 1.
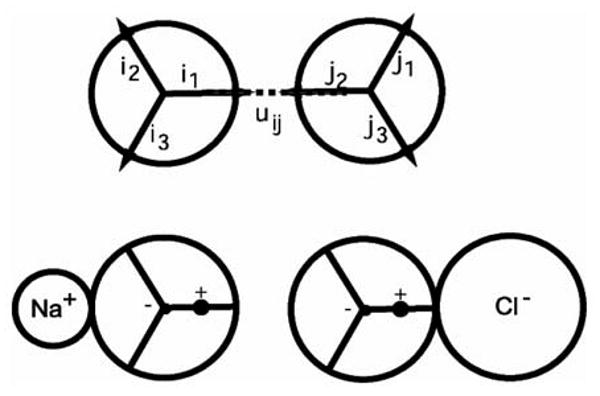
The MB-dipol model: the water-water and water-ion interaction.
In the MB model, the energy of interaction between two waters is:19
| (2) |
The notation is the same as in previous papers:11,18–20 Xi denotes a vector representing both the coordinates and the orientation of the i-th water molecule, and rij is the distance between the molecular centers of the molecules i and j. The Lennard-Jones term reads:
| (3) |
where εLJ and σLJ are the well-depth and contact parameters, respectively. In addition, neighboring water molecules can form an explicit hydrogen bond when an arm of one molecule aligns with an arm of another water molecule, with an energy function that is a Gaussian function of separation and angle:
| (4) |
where G(x) is an un-normalized Gaussian function:
| (5) |
The unit vector ik represents the k-th arm on the i-th particle (k = 1, 2, 3), and uij is the vector joining the center of molecule i to the center of molecule j (Figure 1). H-bonding arms are not distinguished as donors and acceptors. The strength of the hydrogen bond is only determined by the degree of alignment.19
The model parameters are defined as previously.11,18–20 The parameter εHB = −1 and rHB = 1 define the optimal hydrogen bond energy and bond length, respectively. The same width parameter σ = 0.085 is used for both the distance and the angle deviation of a hydrogen bond. The interaction energy in the Lennard-Jones potential function, εLJ = 0.1εHB, and the LJ distance is 0.7 of that of rHB. The MB model was modified to include an electrostatic dipol.11 A single negative charge is put at the center of each water molecule, and a single positive charge is put onto one of the H-bonding arms, at a distance 0.165 rHB from the center (Figure 1). An ion interacts with the charges on a water molecule through a screened potential:
| (6) |
Here rij is the distance between the ion center and a charge on a water dipole, and the valencies zi (zj) are +1 and −1. All the distances are in the units of rHB. The parameter κ is, as previously established,11 to be 0.1, and α = 2.27. The ion-water potential is:
| (7) |
The diameter σLJ, is different for different ions, and calculated from the crystal radii25 (Table 1), while the well depth for the Lennard-Jones potential, εLJ, is, as before11, taken to be the same for all the ions.
Table 1.
The crystal ionic radii, rM25, and the ion diameters used in the MB-dipol model.
| Ion | rM/nm | σ/rHB |
|---|---|---|
| Li+ | 0.060 | 0.24 |
| Na+ | 0.095 | 0.37 |
| Cs+ | 0.169 | 0.66 |
| F− | 0.136 | 0.53 |
| Cl− | 0.181 | 0.71 |
| I− | 0.216 | 0.85 |
The Monte Carlo simulation method was performed at constant pressure (P* = P rHB2/| εHB| = 0.19) in the NPT ensemble. Monte Carlo steps are displacements and rotations of the water molecules. The simulations were performed using 60 water molecules, and a single positive or negative ion fixed in the center of the simulation box. The first 108 steps were used to equilibrate the system, and the statistics were collected over the following 5 × 10⁸ steps. After the system was equilibrated, the free energy, enthalpy, and entropy of transferring a hydrophobe into a solution were calculated using the Widom test-particle method,26 and using related fluctuation formula.19 The potential of mean force between ion and a nonpolar solute was calculated using the Widom method.11 In addition, simulations of a mixture of water molecules, a single fixed ion and one hydrophobe molecule were performed to obtain the various pair distribution functions.
3. Results and Discussion
All the Monte Carlo simulation results presented here were obtained at reduced temperature T* = kBT/|εHB| = 0.20 which roughly corresponds to the room temperature (T = 298.15 K)19. kB, as usual, is the Boltzmann constant. All the simulation results are given in reduced units: T* = kBT/| εHB|, V* = V/rHB2, H* = H/| εHB|, and P*V* = PV/| εHB|. First, we examined the free energy, ΔG, enthalpy, ΔH, and entropy, ΔS, of transfer of a single hydrophobe into the pure water. The results are given in Table 2. The thermodynamic results for the model were compared with the corresponding experimental values for the transfer of gaseous molecules into water. The experimental results were adjusted for the Ben-Naim standard state27 (Table 3).
Table 2.
Hydrophobe insertions thermodynamics for hydrophobe molecules of different diameters in pure water as calculated by MC simulation at T*=0.20.
| σH/rHB | ΔGhyd/εHB | ΔHhyd/εHB | ΔShyd/kB |
|---|---|---|---|
| 0.47 (He) | 0.1564 | −0.0730 | −1.1471 |
| 0.56 (Ne) | 0.1897 | −0.0894 | −1.3955 |
| 0.70 (Ar) | 0.2456 | −0.1090 | −1.7731 |
| 0.77 (CH4) | 0.2770 | −0.0709 | −1.7395 |
| 0.81 (Xe) | 0.2976 | −0.0941 | −1.9585 |
| 1.50 (large solute) | 0.7624 | 0.9886 | 1.1312 |
Table 3.
The experimental data for the hydrophobe solvation thermodynamics in pure water at T = 298.15 K.23
| Solute | ΔGhyd/kJmol −1 | ΔHhyd/kJmol−1 | ΔShyd/kJmol −1 K−1 |
|---|---|---|---|
| He | 11.556 | 1.54 | −0.0336 |
| Ne | 11.175 | −1.44 | −0.0423 |
| Ar | 8.376 | −9.97 | −0.0615 |
| Xe | 5.586 | −16.11 | −0.0728 |
| CH4 | 8.385 | −11.49 | −0.0667 |
The transfer thermodynamics of a hydrophobic solute was at T* = 0.18, and for a broad hydrophobe size-range studied by Southall et al.18 Our results at T* = 0.20 are consistent with those reported in Ref.18, and are for entropy and enthalpy, which are related to microscopic driving forces, in qualitative agreement with experimental results. For small solutes the thermodynamic properties of hydration change approximately in proportion with the solute size. This is not true for the solutes much larger than the size of a water molecule,18 which suggests two different solvation mechanisms for the small and large hydrophobes. The two mechanisms were investigated in details by Southall et al,18 and were therefore not the scope of this work. Since the free energy of hydration is known to be proportional to the surface area of the solute,18 the difference in trends between the model and experimental results is believed to be due to the two-dimensional geometry of our model,
The presence of ions in water solutions changes the water structure, and as a consequence, the hydration of the hydrophobes. This results in the “salting-out”, or, in some cases, “salting-in” of the hydrophobic solutes. The experimental Setschenow salting-out coefficients, kS, for different hydrophobes in 1 M NaCl aqueous solution15 are as a function of the hydrophobe size shown in Figure 2. As the hydrophobe size increases, the kS values increase.
Figure 2.
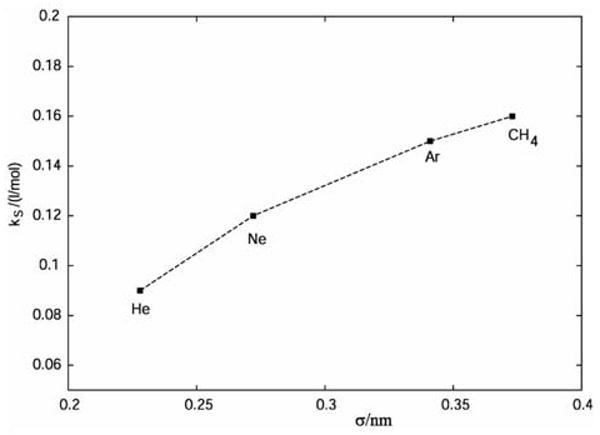
Experimental values of the Setschenov salting out coefficients for different hydrophobes in 1 M NaCl solution.15
To determine the corresponding quantity to Setschenow coefficient theoretically, we computed the difference in free energy of transfer of a hydrophobe into pure water and water with a single ion, Δ(ΔG). The quantity is for Na+ and Cl− ion for different hydrophobe sizes shown in Figure 3. The solid (upper) line connects the results for chlorine ion, and the dashed (bottom) line shows the results for sodium ion. One can see that, as shown by the experiment, the model predicts stronger salting-out effect (more positive Δ(ΔG)s) for larger hydrophobes. The Δ(ΔG)s are for all hydrophobe sizes lower in the case of sodium ion that in the case of chlorine ion (Figure 3), the reason being the asymmetry of water's dipol in the model.20
Figure 3.
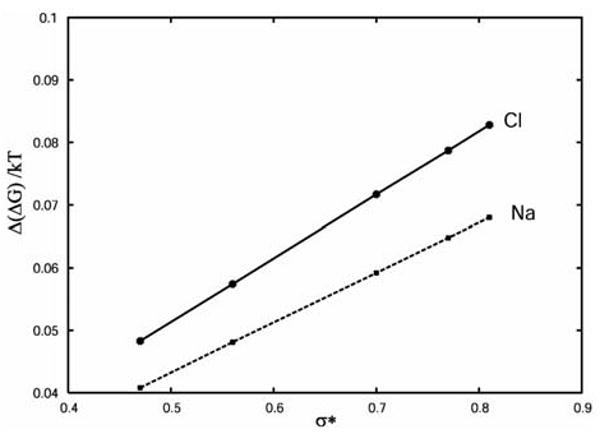
The Δ(ΔG)/kT as a function of the size of the hydrophobe for Na+ and Cl−.
The effect of different ions is shown in Figure 4a and 4b, where Δ(ΔG) for different cations and different anions are shown as a function of the hydrophobe size. The upper lines in both cases represent the results for very small ions (kosmotropes), F− and Li+, that are known to be most disruptive to the water-water hydrogen bonding due to their high charge density. The solid (middle lines) represent the results for the intermediate ions (Na+, Cl−), and bottom (dotted) lines represent the results for large ions (chaotropes), Cs+ and I−. All the ions show the same tendency: the salting out effect increases (more positive Δ(ΔG)) with the increasing hydrophobe size, as also predicted by the experiment. Also, as already discovered previously, the salting-out effect is stronger for smaller ions with high charge density.11 The ion size effect is more pronounced for larger hydrophobic solutes that require more space in the solutions. This is consistent with previous observations that the Hofmeister effect in MB-dipol model occurs due to the exclusion of the hydrophobe from the space occupied by an ion and their solvation-shell water.11
Figure 4.
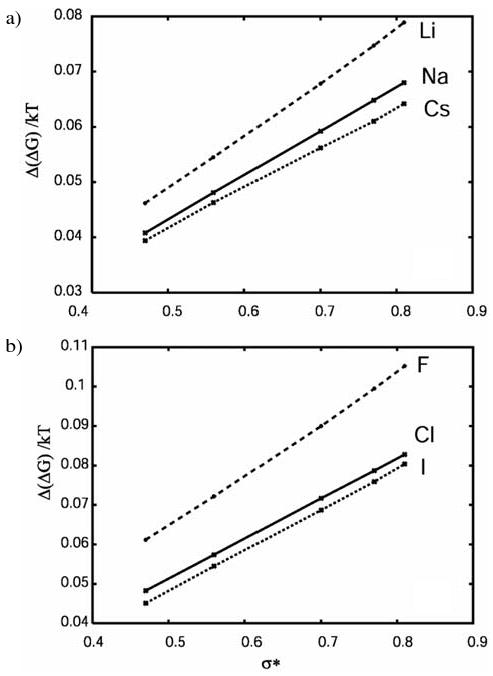
The Δ(ΔG)/kT as a function of the size of the hydrophobe for different cations (a), and anions (b).
So far all the results presented applied to small to intermediate size hydrophobes (σ < rHB). While for these solutes it has been shown that their insertion into pure water is favored by ΔH and opposed by the TΔS term, the opposite is true for solutes with diameter larger than rHB18. It was therefore of interest to explore the mechanism of Hofmeister effect for large solutes. Figure 5 shows the Δ(ΔG) for transfer of a hydrophobic solute with diameter 1.5 rHB into the solution containing different ions.
Figure 5.
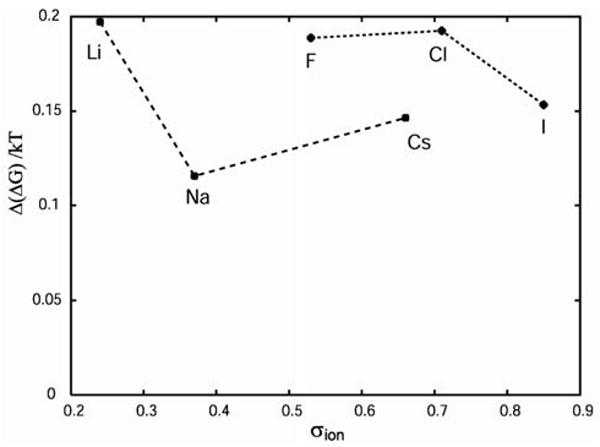
The Δ(ΔG)/kT as a function of the ion size for a hydrophobe with σ= 1.5 rHB
Despite the fact that the scattering of the results is bigger than in the case of small hydrophobes, the trends remain the same; ions with higher charge density have stronger salting-out effect (higher Δ(ΔG) of transfer). The anions salt out the hydrophobe stronger.
To investigate the mechanism of the Hofmeister effect, as it occurs in our model solution, the pair distribution functions (pdfs) between ion and hydrophobe were examined. They are, together with ion-water pair distribution functions, for two different hydrophobe sizes (σ/rHB = 0.47, and 1.5) shown in Figure 6.
Figure 6.
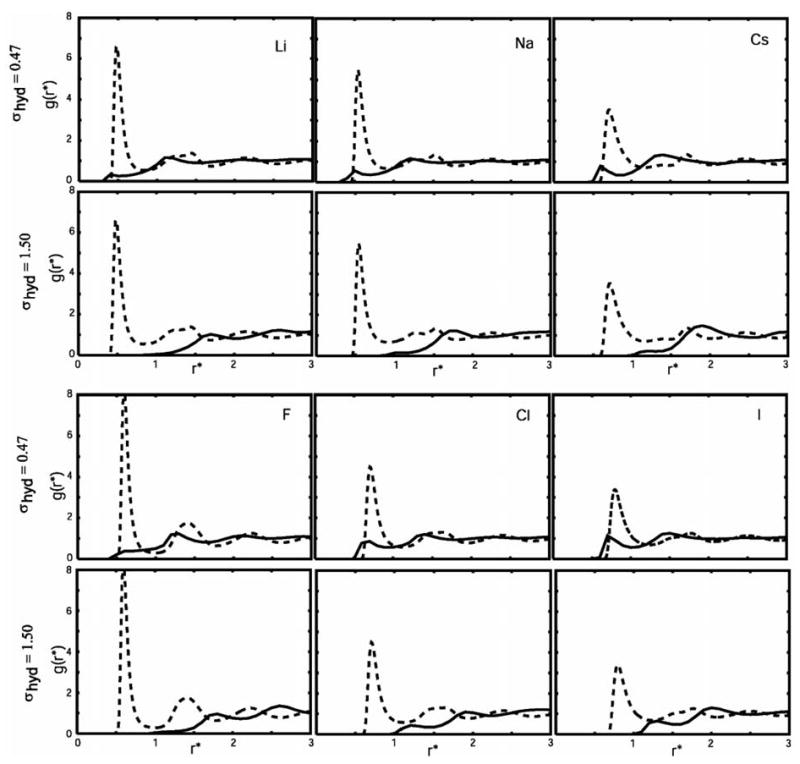
Ion-water (dashed lines) and ion-hydrophobe (solid lines) pair distribution functions for different ions and two different hydrophobe sizes.
The ion-water pair distributions functions are shown by dashed lines, while ion-hydrophobe pair distribution functions are represented by solid lines. Small ions bind water very tightly (high peak in the ion-water pdf), and the hydrophobes are therefore excluded from their first hydration shell. The hydrophobes position themselves in the second shell, as previously shown for hydrophobe size σ* = 0.70.11 As a consequence, the concentration of the hydrophobe in the remaining space of the solution increases, leading to salting-out of the hydrophobic solute. Larger ions with smaller charge density do not bind water molecules so tightly, and in the case of iodide ion there's a relative high probability (the value of ion-hydrophobe pdf higher than 1) to find a hydrophobe even in the ion's first hydration shell (Figure 7). As the hydrophobic solute size decreases, the probability of finding it in the ion's first hydration shell increases.
Figure 7.
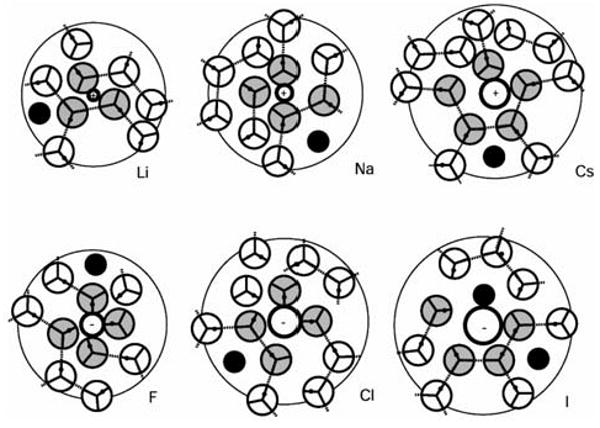
Snapshots of waters in the first (grey) and second (white) solvation shell, showing the most probable sites of hydrophobic solute (σ= 0.47) insertions (black).
The mechanism remains similar for large hydrophobes studied here (σ up to 1.5 rHB). The structuring of the water caused by the presence of the ions (first and second hydration shell waters) is not influenced by the presence of the hydrophobe (the results are not shown here). A large hydrophobe positions itself between the second and third water shell, where the influence of an ion to the water structure is already very small.
4. Conclusions
In this work we used a simple two-dimensional model to examine the mechanism of Hofmeister effect for different hydrophobe sizes. For modeling water molecules we used the MB-dipol model which was previously used to study the Hofmeister effect for intermediate hydrophobe sizes. After systematically investigated the Δ(ΔG) of transfer, which is directly correlated to Setchenow salting-out coefficient, we concluded that the mechanism of Hofmeister effect in this model does not depend on the size of a hydrophobic solute. The ions with high charge density bind water tightly and hydrophobes are therefore excluded from their immediate vicinity. This increases the concentration of the hydrophobe in the remaining space of the solution, leading to its salting out. The effect increases with increasing size of the hydrophobe, as predicted by the experiment. Large hydrophobes are excluded not just from the first solvation shell, but also from the second shell, leading to even higher increase of their concentration caused by the presence of an ion.
The MB model seems to provide a self-consistent explanation of Hofmeister effect for simple ions, which only differ from each other in their charge density. The more complex ions, containing both charged and hydrophobic groups, that in some cases can cause the increased solubility of a nonpolar solute relative to pure water, were beyond the scope of this work and will be investigated in the future work.
Acknowledgments
We are grateful for the support from NIH grant R01 GM063592. B.H.L. and V. V. appreciate the support of the Ministry of Science and Education of Slovenia under grant P1-0201.
Footnotes
Dedicated to Professor Josef Barthel on the occasion of his 80th birthday
References
- 1.Ben-Naim A. Hydrophobic Interactions. Plenum Press; New York: 1980. [Google Scholar]
- 2.Southall NT, Dill KA, Haymet ADJ. J Phys Chem B. 2002;106:521–533. and references therein. [Google Scholar]
- 3.Cramer CJ, Truhlar DG. Science. 1991;256:213–217. doi: 10.1126/science.256.5054.213. [DOI] [PubMed] [Google Scholar]
- 4.Vallone B, Miele AE, Vecchini P, Chiancone E, Brunori M. Proc Natl Acad Sci USA. 1998;95:6103–6107. doi: 10.1073/pnas.95.11.6103. [DOI] [PMC free article] [PubMed] [Google Scholar]
- 5.Hofmeister F. Arch Exp Pathol Pharmakol. 1888;24:247–260. [Google Scholar]
- 6.Kunz W, Henle J, Ninham BW. Curr Opin Coll Int Sci. 2004;9:19–37. [Google Scholar]
- 7.McDevit WF, Long FA. J Am Chem Soc. 1952;74:1773–1777. [Google Scholar]
- 8.Baldwin RL. Biophys J. 1996;71:2056–2063. doi: 10.1016/S0006-3495(96)79404-3. [DOI] [PMC free article] [PubMed] [Google Scholar]
- 9.Kunz W. Pure Appl Chem. 2006;78:1611–1617. [Google Scholar]
- 10.Cacace MG, Landau EM, Ramsden JJ. Quat Rev Biophys. 1997;30:241–277. doi: 10.1017/s0033583597003363. [DOI] [PubMed] [Google Scholar]
- 11.Hribar B, Southall NT, Vlachy V, Dill KA. J Am Chem Soc. 2002;124:12302–13311. doi: 10.1021/ja026014h. [DOI] [PMC free article] [PubMed] [Google Scholar]
- 12.Thomas AS, Elcock AH. J Am Chem Soc. 2007;129:14887–14898. doi: 10.1021/ja073097z. [DOI] [PubMed] [Google Scholar]
- 13.Docherty H, Galindo A, Sanz E, Vega C. J Phys Chem B. 2007;111:8993–9000. doi: 10.1021/jp0678249. [DOI] [PubMed] [Google Scholar]
- 14.Kunz W, Lo Nostro P, Ninham BW. Curr Opin Coll Int Sci. 2004;9:1–18. [Google Scholar]
- 15.Smith PE. J Phys Chem B. 1999;103:525–534. [Google Scholar]
- 16.Kalra A, Tugcu N, Cramer S, Garde S. J Phys Chem B. 2001;105:6380–6386. [Google Scholar]
- 17.Zhang Y, Cremer PS. Curr Opin Chem Biol. 2006;10:658–663. doi: 10.1016/j.cbpa.2006.09.020. [DOI] [PubMed] [Google Scholar]
- 18.Southall NT, Dill KA. J Phys Chem B. 2000;104:1326–1331. [Google Scholar]
- 19.Silverstein KAT, Haymet ADJ, Dill KA. J Am Chem Soc. 1998;120:3166–3175. [Google Scholar]
- 20.Dill KA, Truskett TM, Vlachy V, Hribar-Lee B. Annu Rev Biophys Biomol Struct. 2005;34:173–199. doi: 10.1146/annurev.biophys.34.040204.144517. [DOI] [PubMed] [Google Scholar]
- 21.Bizjak A, Urbič T, Vlachy V, Dill KA. Acta Chim Slov. 2007;54:532–537. [Google Scholar]
- 22.Urbič T, Vlachy V, Kalyuzhnyi Yu V, Southall NT, Dill KA. J Chem Phys. 2000;112:2843–2848. [Google Scholar]
- 23.Urbič T, Vlachy V, Kalyuzhnyi Yu V, Southall NT, Dill KA. J Chem Phys. 2002;116:723–729. [Google Scholar]
- 24.Truskett TM, Dill KA. J Phys Chem B. 2002;106:11829–11842. [Google Scholar]
- 25.Marcus Y. Ion Solvation. Wiley-Interscience; New York: 1985. [Google Scholar]
- 26.Widom B. J Chem Phys. 1963;39:2808–2812. [Google Scholar]
- 27.Ben-Naim A. Solvation Thermodynamics. Plenum Press; New York: 1987. [Google Scholar]


