Abstract
Tracing changes of specific cell populations in health and disease is an important goal of biomedical research. Precisely monitoring pancreatic β-cell proliferation and islet growth is a challenging area of research. We have developed a method to capture the distribution of β-cells in the intact pancreas of transgenic mice with fluorescence-tagged β-cells with a macro written for ImageJ (rsb.info.nih.gov/ij/). Total β-cell area and islet number and size distribution are quantified with reference to specific parameters and location for each islet and for small clusters of β-cells. The entire distribution of islets can now be plotted in three dimensions, and the information from the distribution on the size and shape of each islet allows a quantitative and a qualitative comparison of changes in overall β-cell area at a glance.
Keywords: pancreatic β-cells, islets, β-cell area, insulinoma, diabetes
pancreatic β-cell mass changes under normal physiological conditions, such as pregnancy (7, 8, 11, 12, 15, 17), and in the pathophysiological conditions of type 1 and type 2 diabetes (1, 3, 9, 10, 13, 14, 16). Studies of the regulation of β-cell mass in mice and other model organisms may lead to new approaches for treating diabetes. The most commonly used method to estimate total β-cell mass/area in a mouse pancreas involves a histological sectioning of the pancreas and subsequent examination of a set of sampled sections (1, 2, 8, 11, 16). Although not technically difficult, it is time consuming and not well suited to studies of large numbers of animals. In addition, it can be subject to a sampling bias. Here we describe a method to quantify β-cell area in the intact adult pancreas using transgenic mice that express green fluorescent protein (GFP), specifically in β-cells under the control of mouse insulin I promoter (MIP) (5, 6; mice available at the Jackson Laboratory, Bar Harbor, ME) and ImageJ (rsb.info.nih.gov/ij/), freely available image analysis software. The entire distribution of β-cells is documented from small clusters of β-cells (<10 cells) to large islets. We are then able to obtain information on the number, size and shape of these structures (using parameters such as perimeter, circularity and Feret's diameter) and thereby quantify islet/β-cell area. As a proof of principle, this approach has been validated using a mouse model of β-cell tumor that exhibits an extreme outgrowth of β-cell area due to the expression of oncogenic SV40 large T antigen (Tag) driven by rat insulin promoter [RIP (4)]. The use of insulinoma-bearing mice allowed us to demonstrate efficient segmentation of overlapping images (caused by the cancerous growth of islets). The method can easily be applied to pancreata with less complicated conditions of increased and decreased β-cell area, such as pregnancy, obesity, and diabetes, as well as other tissues and organisms, to quantify a specific cell population on a large scale.
MATERIALS AND METHODS
Mice.
Mouse pancreata were excised from transgenic mice in which pancreatic β-cells were endogenously tagged with green fluorescent protein (GFP; 5, 6) under the control of mouse insulin I promoter (MIP). In this study, MIP-GFP mice were further crossed with RIP-Tag mice (4). Note that further breeding delays the phenotyping. All the procedures involving mice were approved by the University of Chicago Institutional Animal Care and Use Committee.
Preparation of specimens.
Pancreata were removed intact,with surrounding tissues such as spleen and duodenum, and placed onto a standard glass slide flat to retain the orientation (i.e., dorsal and ventral pancreas); then, surrounding tissues were carefully removed. Pancreata were fixed with 4% PFA at 4°C overnight and permeabilized with 1% Triton X-100 for 2 days. Specimens were further treated with saturated sucrose for several days, followed by 100% glycerol to clear tissue and obtain better resolution of fluorescent signals.
Imaging and quantification of β-cell area in intact pancreas.
Optical images of pancreata were obtained using an Olympus IX-80 (Olympus, Melville, NY) and software StereoInvestigator (MicroBrightField, Williston, VT). In the present study, a ×2 objective lens was used to capture the entire adult pancreas (∼3 × 5 cm) on a glass slide, which allowed us to scan through ∼1-mm thickness of a specimen. For a smaller specimen size, higher objectives can be used with a cover glass. The limiting factor is the capacity of a computer used for the capture and subsequent image analysis because of a large image size, which is usually in the range of 1–200 MB. Using a Virtual Slice module of StereoInvestigator, a contour is first manually drawn to encircle a whole pancreas, then the software starts to capture each optical panel sequentially by controlling a motorized stage in the x- and y-axes until it covers an area of the drawn contour. In each capture of a panel, a focal plane (z-axis) is selected manually to capture the best plane (the most populated area in a given depth of a specimen). Then StereoInvestigator creates a montage combining all the panels, which is designated a virtual slice. A resulting virtual slice is an integrated 2-D image like a bird's eye view, although it is not a maximum projection from the 3-D reconstruction of the whole pancreas. Note that images are captured using the epifluorescent configuration (i.e., wide-field filters), but not the confocal mode, which limits a capture to a single focal plane. The epifluorescent configuration allows us to capture signals in certain depth, including those that are not in perfect focus. The three-step imaging analysis described in the present study is specifically designed to eliminate such artifacts from light scatter and blur associated with large-scale optical imaging. The average scanning time per sample was ∼30 min but varied depending on the size of a specimen. Image analysis was carried out using ImageJ.
Immunohistochemical analysis.
Paraffin-embedded sections were cut with a thickness of 6 μm. Sections were stained with a polyclonal guinea pig anti-porcine insulin primary antibody (DAKO, Carpinteria, CA). The primary antibody was detected using Cy2-conjugated secondary antibody (Jackson ImmunoResearch Laboratories, West Grove, PA). Microscopic images were taken with an Olympus IX81 DSU spinning disk confocal microscope (Melville, NY).
Mathematical analysis.
The data were fitted with the log-normal functions with two parameters, μ (peak position) and σ (x-axis scale), and with a power law distribution
| (2) |
RESULTS
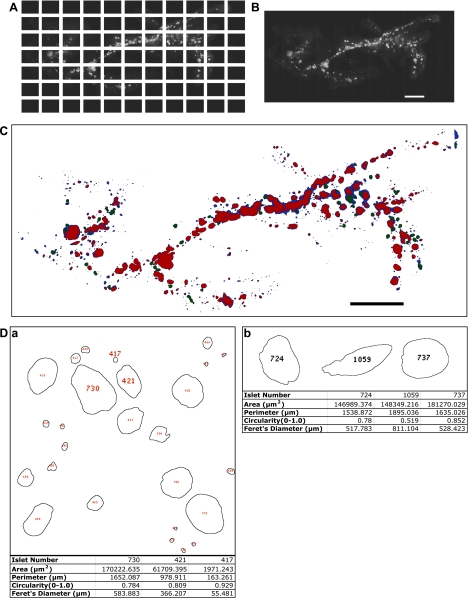
The entire distribution of GFP-expressing β-cells in the intact pancreas was visualized using the Stereo Investigator Imaging System (SI; MicroBrightField, Williston, VT), which controls an XYZ-motorized stage and acquires images with spatial information. The Virtual Slice module of the SI creates high-resolution montages composed of a series of contiguous images of a specimen obtained from multiple microscopic fields of view (Fig. 1A). The whole pancreas was captured as a virtual slice (Fig. 1B).
Fig. 1.
Quantitative optical image analysis of the entire distribution of pancreatic islets in the intact adult pancreas. A: a series of contiguous images of a specimen was taken using a ×2 objective (a male RIP-Tag mouse at 15 wk). Note a mosaic image covering the entire distribution of islets, including small clusters of β-cells (<10 cells). B: a virtual slice that combines all the images into a single image montage. The dorsal pancreas is on the right and the ventral pancreas is on the left. Scale bar, 5 mm. C: mask rendering of fluorescing particles. Color codes are as follows: blue, low-intensity fluorescence; green, intermediate-intensity fluorescence; red, high-intensity fluorescence. Scale bar, 5 mm. D: quantification of each islet/small cluster of β-cells. Note that each islet (including small clusters of β-cells) is identified and numbered, which corresponds to individual information listed in a tab-delimited text file by a programmed macro using ImageJ. a: 4 parameters were recorded on each structure: 1) area; 2) perimeter, distance surrounding an area; 3) circularity, degree of roundness where 1.0 depicts a perfect circle; 4) Feret's diameter, longest distance within an area. Note: #417 with area of 1,971 μm2, for example, represents the resolution of the analysis, which is equivalent to only a few β-cells. b: islet shape, defined by a combination of parameters. Shape of an individual islet can be determined by using parameters of perimeter, circularity, and Feret's diameter. Three islets (#724, #1059, and #737) are similar in area; however, #1059 shows a distinct shape, which reflects a longer perimeter, longer Feret's diameter, and low number in circularity compared with those of #724 and #737.
A macro was written for ImageJ to automate the measurement of β-cell area, islet number, and size distribution from fluorescent images. We have divided our analysis into three components: 1) a low threshold that captures a small area of β-cells (<1 × 105 μm2), 2) a high threshold that captures large islets with clear boundaries, and 3) a middle threshold obtained by subtracting the results of both the low and high thresholds from the original image. These measurements are then combined to define the total β-cell area in a given pancreas. Specifically, the quantification of the entire distribution of β-cells/islets was carried out as follows. First, parameters were determined for functions, including Gaussian blur, contrast, rolling ball radius, and threshold and set in the appropriate entry in the macro (Supplementary Data 1; supplementary material is found in the online version of the article). Gaussian blur smoothed the image, thus removing background noise. Enhanced contrast removed remaining noise by highlighting fluorescent signals from β-cells and darkening erroneous signals. Excess fluorescence was also expelled with the rolling ball radius, which was determined by measuring the radius of the largest islet with Line Tool. The analysis for the threshold was divided into two components due to a wide range in light intensity: 1) β-cell clusters and small islets captured at low light sensitivity, and 2) large islets captured at high light sensitivity. Analyses excluded artifacts (e.g., debris) smaller than one single β-cell (<170 μm2; area calculated using a diameter of ∼15 μm; Ref. 5). Finally, the file location was set by entering the image location, file name, cut-off size for small islets, lower threshold, higher threshold, and rolling ball radius. The segmented particles and free-standing islets were analyzed separately, and all analyzed images were integrated as a final virtual slice (Fig. 1C). Quantification included area, perimeter (the distance surrounding an area), circularity (a degree of roundness, where 1.0 depicts a perfect circle), and Feret's diameter (the longest distance within an area) for each analyzed region (Fig. 1D).
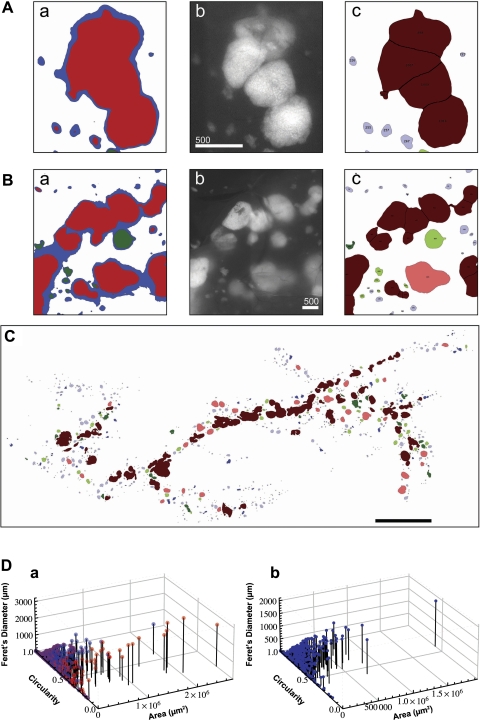
In the course of a large-scale analysis, in particular, in examining the adult pancreas bearing insulinoma, adjacent islets are often recorded as a fused structure (Fig. 2, A and B). For example, an irregular shape of β-cell area recorded in Fig. 2Aa contains multiple islets (a fluorescent image in Fig. 2Ab). Watershed segmentation, which selects regions on the basis of their attributes, efficiently separated closely residing islets (Fig. 2Ac). Watershed segmentation further clarified false connections between separate islets due to light scattering by surrounding tissue. When the original image of fluorescing islets and β-cell clusters (Fig. 2Bb) was turned into a low-intensity mask (blue), it accurately captured β-cell clusters and small islets but falsely connected larger islets (Fig. 2Ba). The mask was then watershedded, and the falsely connected islets were separated by size exclusion filters so that they corresponded with the fluorescent particles captured in b (Fig. 2Bc). Figure 2C shows the post-watershed outline rendering of the total β-cell area, in which all the islets were renumbered, including segmented islets. The watershed segmentation resulted in overall changes in parameters that depict each islet area and shape (Fig. 2D).
Fig. 2.
Application of watershed segmentation. A: representative false capture of multiple objectives as one structure. a: closely residing islets are prone to be captured as a continuous structure in a large-scale optical image analysis. b: a corresponding fluorescent image shows that there are multiple islets within a single cluster recorded in a. Scale bar, 500 μm. c: watershed segmentation recognized each islet structure and divided it into 4 islets. B: representative false capture of low-intensity fluorescent light scattering. a: a low-intensity mask (blue) captures β-cell clusters and small islets accurately but falsely interconnects larger fluorescent particles prone to light scattering by surrounding tissue. b: original image of fluorescing islets and β-cell clusters. Scale bar, 500 μm. c: results of particle analysis after size exclusion filters correspond closely to captured fluorescent particles in b. C: outline rendering of particle analysis. Color codes are as follows: light blue, small islets and β-cell clusters (≤1 × 105 μm2 with circularity >0.7); dark blue, islets (≤1 × 105 μm2 with circularity >0.7) subject to watershed segmentation; light red, large islets (≥1 × 105 μm2 with circularity >0.7); dark red, islets (>1 × 105 μm2 with circularity ≤0.7) that were segmented; and light green, islets (≅1 × 105 μm2 with circularity ≤0.7) that were excluded, because an increased threshold decreases the measured area; dark green, islets (≅1 × 105 μm2 with circularity ≤0.7). Scale bar, 5 mm. D: Three-dimensional scatter plot showing size and shape distribution of each islet. a: comparison of pre-watershed (red) and post-watershed (blue) is shown. b: post-watershed data plotted alone.
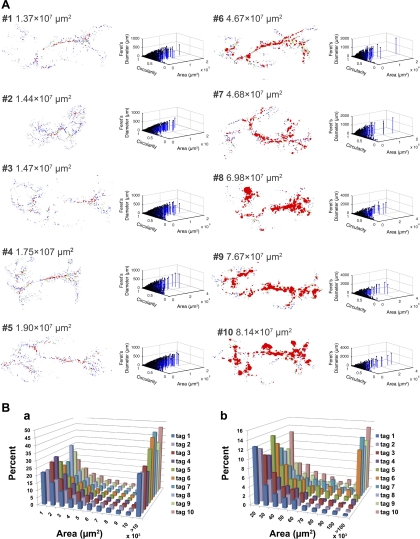
We then examined changes of total β-cell area and islet size distribution at various stages of insulinoma development (Fig. 3). RIP-Tag mice usually show hypoglycemia at an age of 12 wk, and the majority of them fail to survive beyond 20 wk. A 4-wk-old RIP-Tag mouse (mouse 2) shared similar β-cell area with a wild-type mouse at 12 wk (mouse 1). Each outline rendering of particle analysis on eight RIP-Tag mice (mice 3–10, age range 8–20 wk) is shown in order of total β-cell area on the left with corresponding 3-D scatter plots of islet parameters on the right (Fig. 3A). Note that progressive β-cell tumor growth is easily recognized visually in situ, as particularly demonstrated by the substantial increase in red area, which depicts the formation of large islets. The overall islet size distribution is shown in Fig. 3B.
Fig. 3.
Progressive development of insulinoma in RIP-Tag mice. A: representative stages of insulinoma development are shown in order of increasing β-cell area. Dorsal pancreas is on the right, and ventral pancreas is on the left. All males. #1: pancreas from a wild-type mouse at 12 wk as a control; #2–#10 RIP-Tag mice (#2: 4 wk; #3 and 4: 8 wk; #5: 10 wk; #6 and 7: 15 wk; #8–10: 20 wk. NB: #6 specimen was used as a model in Figs 1 and 2). A series of outline renderings of particle analyses (left) demonstrates progressive β-cell tumor growth in situ. Corresponding 3-D scatter plots of islet parameters depict distribution of islets with various sizes and shapes (right). B: histogram showing distribution of islets. a: distribution of total β-cell area is shown in increments of 1 × 103 μm2. Note that β-cell area >10 × 103 μm2 is compiled in the last column. b: β-cell area >10 × 103 μm2 shown in Aa is partitioned in increments of 10 × 103 μm2. Note difference in frequency (y-axis) from histogram shown in Ba.
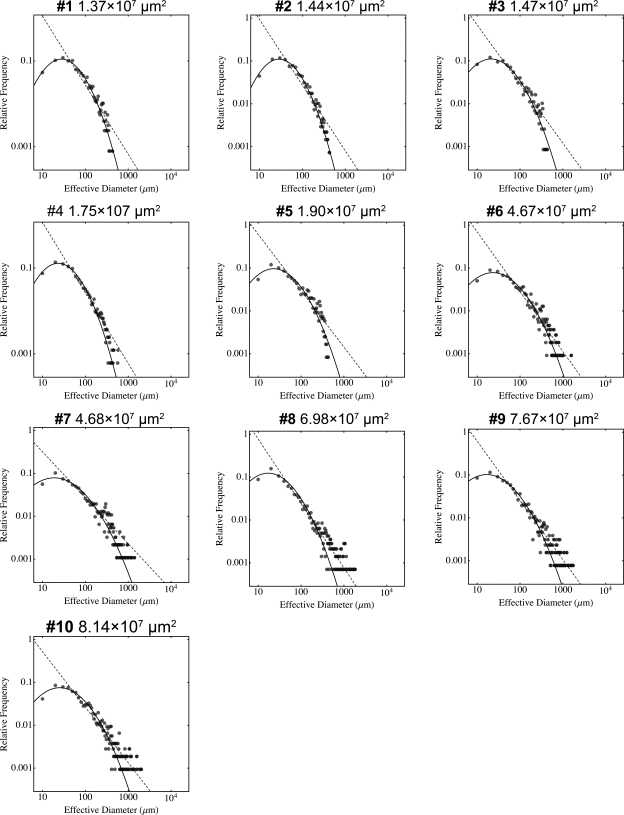
We then performed mathematical analysis on the insulinoma development. The overall β-cell proliferation/islet growth strikingly fitted in a log-normal probability density function plotted to an effective diameter (a parameter that depicts the same area of a perfect circle). However, progression of insulinoma resulted in a rightward shift at the tail of the log-normal distribution (Fig. 4). The distribution resembled a power law function. The relative frequency of islets with effective diameters below 100 μm decreases in the end-stage insulinoma, whereas that of larger islets increases, with many of them exceeding 1,000 μm (at the stage of #6 and thereafter), suggesting unregulated tumor growth. The progressive cancer development is therefore demonstrated in the marked deviation from the log-normal toward a power law distribution.
Fig. 4.
Mathematical analysis of insulinoma progression. Log plots of distribution of β-cell area at each stage of developing insulinoma. The numerical value of each β-cell area is converted to an effective diameter s (a parameter that depicts the same area of a perfect circle) and is plotted as scattered dots. Note that overall growth of β-cells fit into a log normal function, where with substantial tumor development (at #6 and thereafter) the distribution of islets >1,000 μm in effective diameter falls off from the curve with a rightward shift and rather fits a power law distribution (dashed line), suggesting unregulated tumor growth.
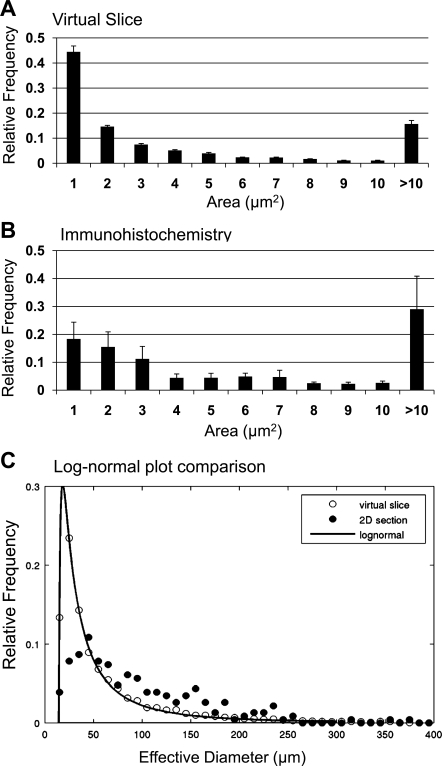
Additional validation of the method regarding the reproducibility and consistency (i.e., among the same age and sex group of mice) is found in Fig. 5A. β-Cell distribution estimated from immunohistochemical staining of insulin in pancreatic sections is shown for comparison (Fig. 5, B and C).
Fig. 5.
Additional validation of the method. A: islet size distribution of virtual slice analysis (3-wk-old wild-type mice, n = 5). B: islet size distribution of immunohistochemical analysis (3-wk-old wild-type mice, n = 3). C: log-normal plot comparison of virtual slice (○) and immunohistochemical analysis (●). Both analyses show a similar range of islet size distribution. However, the virtual slice method provides an analysis that more precisely fits the log-normal distribution.
DISCUSSION
Quantification of β-cell area in intact pancreas.
We have developed a method to quantify β-cell area in situ in the mouse pancreas by using transgenic mice in which pancreatic β-cells are specifically labeled with GFP (5, 6). A whole pancreas is captured as a virtual slice with high resolution, which enables us to assess the entire distribution of β-cells in situ for the subsequent large-scale analysis. A macro was written for ImageJ, a freely available image analysis software, to automate the measurement of β-cell area, islet number, and size distribution from fluorescent images. Processing optical images on such a large scale without introducing technical bias requires an optimal balance of accuracy and sensitivity to determine a threshold that precisely captures signals from the cell of interest (e.g., GFP-expressing β-cells). A simple setting of one threshold value to process the entire image is likely to lead to either a substantial loss of relatively faint signals (i.e., those from small clusters of β-cells) or an excess inclusion of light scatter and blur from large structures (i.e., large islets). On the other hand, exceeding manipulations, such as setting multiple thresholds sequentially by sizes of area or regionally by optical panels, may introduce different sources of technical bias. To overcome these technical issues, we have developed a three-step method: first, to apply a low threshold for a small area of β-cells; second, to apply a high threshold for large islet area with clear boundaries; and third, to collect islet areas excluded in the first two thresholds. As discussed below, this second group of large islet area can be further analyzed, when applicable, by separating overlapping structures (i.e., closely located islets) through Watershed segmentation.
Watershed segmentation.
A common problem associated with a large-scale analysis of optical images is that, in the course of processing an image in a binary mode (black and white), adjacent objects are often recorded as a fused structure. For example, insulinoma, as we have demonstrated in this study, is one of the extreme cases that are subject to such a false assessment of the overall number of objects (i.e., islets). We show the efficient application of watershed segmentation to separate overlapping islet structures, which is demonstrated by a direct comparison of outline rendering and the original fluorescent images accompanied by the overall changes in parameters that depict each islet shape, in particular, the marked rightward shift in circularity. Watershed segmentation can be employed as a fourth step for further analysis when necessary.
A novel 3-D view of islet distribution.
The large-scale analysis of islets in the intact pancreas provides a novel view of the total distribution of islets, with information on each shape in three dimensions. The changes in islet distribution over time can be compared at a glance using a set of 3-D scatter plots, as we have shown in progressive insulinoma development in RIP-Tag mice.
Changes in islet number and distribution in health and disease.
The mechanisms that control islet formation and β-cell mass under normal physiological conditions (e.g., development, pregnancy, and obesity) are still not completely understood. How do islets form during development and in the postnatal and adult periods of life? Is the increase in β-cell mass in response to increased demand for insulin due to an increase in islet number, islet size, a combination of both, and/or other mechanisms? What is the role of small clusters of β-cells (<10 cells) in this process? Are they a “β-cell reservoir” that can be called upon in times of need and then aggregate and form larger islets? Are there adult β-cell progenitors in the duct that are activated in response to demand for more insulin?
These questions have been examined using standard histological methods on stained sections of pancreas (Fig. 5). Both analyses show a similar range of islet size distribution. However, the virtual slice method provides an analysis that more precisely fits the log-normal distribution. We believe that the method described here complements existing methods for examining pancreatic islets. It allows the entire distribution of β-cells in the intact pancreas to be more readily examined than detailed histological studies, which can be tedious and are time consuming. It will facilitate studies that model β-cell proliferation and islet formation under different physiological conditions. It does not, however, replace immunohistochemical methods that can examine cellular expression of specific proteins under changing physiological conditions. This method is the first step in developing a 3-D view of the distribution of β-cell clusters/islets in the entire pancreas.
In summary, we have described a method that provides a dynamic analysis of the entire distribution of β-cells in the intact pancreas. The scope of data collected includes detailed information on the shape of each islet as determined by multiple parameters such as area, perimeter, circularity, and Feret's diameter. The method is valuable for assessing changes in β-cell area as well as for detailed regional analysis and is applicable to a variety of mouse models.
GRANTS
This study is supported by US Public Health Service Grants DK-081527, DK-072473, and DK-20595 to the University of Chicago Diabetes Research and Training Center (Animal Models Core) and by a gift from the Kovler Family Foundation.
DISCLOSURES
No conflicts of interest are declared by the author(s).
REFERENCES
- 1.Clark A, Clark A, Wells CA, Buley ID, Cruickshank JK, Vanhegan RI, Matthews DR, Cooper GJ, Holman RR, Turner RC. Islet amyloid, increased A-cells, reduced B-cells and exocrine fibrosis: quantitative changes in the pancreas in type 2 diabetes. Diabetes Res 9: 151–159, 1988 [PubMed] [Google Scholar]
- 2.Finegood DT, Scaglia L, Bonner-Weir S. Dynamics of beta-cell mass in the growing rat pancreas. Estimation with a simple mathematical model. Diabetes 44: 249–256: 1995 [DOI] [PubMed] [Google Scholar]
- 3.Gepts W. Pathologic anatomy of the pancreas in juvenile diabetes mellitus. Diabetes 14: 619–633, 1965 [DOI] [PubMed] [Google Scholar]
- 4.Hanahan D. Heritable formation of pancreatic beta-cell tumours in transgenic mice expressing recombinant insulin/simian virus 40 oncogenes. Nature 315: 115–122, 1985 [DOI] [PubMed] [Google Scholar]
- 5.Hara M, Wang X, Kawamura T, Bindokas VP, Dizon RF, Alcoser SY, Magnuson MA, Bell GI. Transgenic mice with green fluorescent protein-labeled pancreatic β-cells. Am J Physiol Endocrinol Metab 284: E177–E183, 2003 [DOI] [PubMed] [Google Scholar]
- 6.Hara M, Dizon RF, Glick BS, Lee CS, Kaestner KH, Piston DW, Bindokas VP. Imaging pancreatic β-cells in the intact pancreas. Am J Physiol Endocrinol Metab 290: E1041–E1047, 2006 [DOI] [PubMed] [Google Scholar]
- 7.Huang C, Snider F, Cross JC. Prolactin receptor is required for normal glucose homeostasis and modulation of beta-cell mass during pregnancy. Endocrinology 150: 1618–1626, 2009 [DOI] [PubMed] [Google Scholar]
- 8.Karnik SK, Chen H, McLean GW, Heit JJ, Gu X, Zhang AY, Fontaine M, Yen MH, Kim SK. Menin controls growth of pancreatic beta-cells in pregnant mice and promotes gestational diabetes mellitus. Science 318: 806–809, 2007 [DOI] [PubMed] [Google Scholar]
- 9.Marchetti P, Dotta F, Lauro D, Purrello F. An overview of pancreatic beta-cell defects in human type 2 diabetes: implications for treatment. Regul Pept 146: 4–11, 2008 [DOI] [PubMed] [Google Scholar]
- 10.Matveyenko AV, Butler PC. Relationship between beta-cell mass and diabetes onset. Diabetes Obes Metab 10, Suppl 4: 23–31, 2008 [DOI] [PMC free article] [PubMed] [Google Scholar]
- 11.Parsons JA, Brelje TC, Sorenson RL. Adaptation of islets of Langerhans to pregnancy: increased islet cell proliferation and insulin secretion correlates with the onset of placental lactogen secretion. Endocrinology 130: 1459–1466, 1992 [DOI] [PubMed] [Google Scholar]
- 12.Parsons JA, Brelje TC, Sorenson RL. Adaptation of islets of Langerhans to pregnancy: beta-cell growth, enhanced insulin secretion and the role of lactogenic hormones. Horm Metab Res 29: 301–307, 1997 [DOI] [PubMed] [Google Scholar]
- 13.Rahier J, Goebbels RM, Henquin JC. Cellular composition of the human diabetic pancreas. Diabetologia 24: 366–371, 1983 [DOI] [PubMed] [Google Scholar]
- 14.Sherry NA, Kushner JA, Glandt M, Kitamura T, Brillantes AM, Herold KC. Effects of autoimmunity and immune therapy on beta-cell turnover in type 1 diabetes. Diabetes 55: 3238–3245, 2006 [DOI] [PubMed] [Google Scholar]
- 15.Sorenson RL, Brelje TC. Prolactin receptors are critical to the adaptation of islets to pregnancy. Endocrinology 150: 1566–1569, 2009 [DOI] [PubMed] [Google Scholar]
- 16.Sreenan S, Baldwin AC, Pugh W, Polonsky KS. Increased beta-cell proliferation and reduced mass before diabetes onset in the nonobese diabetic mouse. Diabetes 48: 989–996, 1999 [DOI] [PubMed] [Google Scholar]
- 17.Van Assche FA, Aerts L, De Prins F. A morphological study of the endocrine pancreas in human pregnancy. Br J Obstet Gynaecol 85: 818–820, 1978 [DOI] [PubMed] [Google Scholar]


