Abstract
Background: The United States has been the country with the highest body mass indexes (BMIs; in kg/m2) at higher centiles, but research that compares the United States with other nations is lacking.
Objective: To present a picture of global obesity and examine the shifts in BMI in children, I examined BMI data for men and women at the upper ends of the BMI distributions in Australia, China, the United Kingdom, and the United States.
Design: As representative data, I used directly measured weight and height for children aged 6–18 y and for men and women aged ≥19 y. Quantile regression analysis with BMI was used to determine the outcome, and the coefficients of age, age squared, and age cubed represented the explanatory variables plotted to determine mean BMI at the 95th centile for each age group. Overweight and obesity measures across all selected countries, with the use of nationally representative surveys and the 95th centile mean BMI, were determined.
Results: Among women, much larger increases were found in mean BMI at the 95th percentile in Australia (+5.7 BMI units) and the United Kingdom (+3.7 BMI units) than in the United States (+2.7 BMI units) in one-half the time. In contrast, among children, younger Chinese children experienced the largest increase. For example, the mean BMI at the 95th centile for 6-y-old Chinese children is 24.8 (a 5.0 increase), which is 2.6 BMI units more than the BMI at the 95th centile for children in the United States.
Conclusions: Among children, BMIs for US children at the 95th centile are below those in China, whereas among women, Australian and UK women are rapidly approaching BMIs found in US women.
INTRODUCTION
A number of scholars and the World Health Organization (WHO) have documented that the globe's overweight population is greater than its underweight population, as has been highlighted in many publications (1, 2). The United States is known to have a high prevalence of obesity at very high body mass index (BMI) levels (3). Scholars have not examined, however, whether the shifts toward much higher BMIs found in the United States are also being found in other countries. Rates of overweight globally do not tell the full story of the importance of increasing global overweight (4–7).
I used quantile regression methods to measure trends in the 95th centile of BMIs across 4 countries and present updated data on global overweight and obesity when available. My goal is to understand shifts in BMI distribution and to present the case that the United States is no longer alone at the top end of the distribution. This means that the debility, disability, and morbidity associated with very high BMIs could become a global concern, rather than a concern for only the United States.
METHODS
I selected 4 countries to illustrate the need for further exploration of this topic across the globe and have used publicly available data sets.
Country databases
Australia
The data for Australia were not weighted to be nationally representative, as I have noted in more detail elsewhere (7). The data sets are reviewed in this publication.
The China Health and Nutrition Surveys (CHNS, 1991, 2000, and 2006)
The CHNS longitudinal surveys covered 9 provinces that vary substantially in geography, economic development, and health indicators, which provide a broad-based indication of the trends China is facing. More details are presented elsewhere (8, 9). Anthropometric measurements were carried out by well-trained health workers who followed standard protocol.
The United Kingdom
The National Heights and Weight Survey, 1980; The Dietary and Nutritional Survey of British Adults, 1986–1987; The Health Survey for England, 1995 and 2003; The National Diet and Nutrition Survey: Adults (age: 19–64 y) 2000–2001 were used. All of the surveys were national representative, with multistage, stratified, random samples. In the survey for 1995 and 2003, data of children were available (10).
The US National Health and Nutrition Examination Survey (NHANES)
The NHANES program of the National Center for Health Statistics, Centers for Disease Control and Prevention, includes a series of cross-sectional, nationally representative health examination surveys beginning in 1960 that are discussed elsewhere (11, 12).
Classifications of overweight
This analysis focused on the prevalence of overweight among children aged 6–18 y and adults aged ≥19 y. The criteria for defining overweight were based on BMI. For adults, I used a single BMI (in kg/m2) cutoff of 25, whereas for children, I used sex- and age-specific BMI cutoffs (25; age: 18 y) that were developed by the International Obesity Task Force (13).
Statistical methods
The analysis of the overall shift in the BMI distribution was descriptive and measured the percentage of the population weighted to be nationally representative at each BMI number (rounded off to tenths of BMI units at each point). The statistical analysis was performed by using STATA, version 10 (14).
The creation of the centile by age distributions was based on quantile regressions. Quantile regression is a type of regression technique that approximates the median or other quantiles of the response relation (15). Quantile regression provides a statistically robust method for examining the BMI distribution. It uses both the central tendency and the statistical dispersion. Quantile regression is capable of providing a more complete statistical analysis of the stochastic relations among random variables (16). The figures are based on the actual BMI data regressed against age and age squared for the best fits to provide relations between age and BMI for the 95th centile. (Note that I examined the 85th centile as well, but because I found identical patterns and trends, these data are not presented.) In all cases, the age measure was statistically significant at P ≥ 0.01. For cases in which age squared was determined to be significant, those data was used (exceptions in which age squared was not significant: US men in 2003–06; Australian children in 1995 and Australian men in 1989; Chinese children in 2006 and Chinese men in 1997; and UK children in 1995).
RESULTS
Global prevalence of obesity among adults
There is evidence going back centuries of an increase in overweight and obesity status in higher-income countries (17, 18). In lower-income countries, there are very few data or evidence on overweight status before the World War II period. In fact, few of these countries collected such data on adults, as most of the focus had been on hunger and malnutrition.
Today, however, the global map is quite different (1). There are many countries in which greater than half of the adults are overweight and obese, and these vary from a few Central and South American countries (eg, Mexico, Peru, Bolivia) to those in the Middle East (Egypt, Saudi Arabia), Africa and Asia (eg, South Africa and Mongolia), to many higher-income countries (eg, the United Kingdom, Australia, and the United States).
The rates of increase of overweight across the world are discussed elsewhere (1). Suffice it to note that among the few higher- and lower-income countries for which repeated representative cross-sectional surveys exist, it appears that the rate of increase per year in the prevalence of overweight plus obesity is ≈1% for adults and 0.5–0.7% for children (1).
Shifts in the BMI distributions
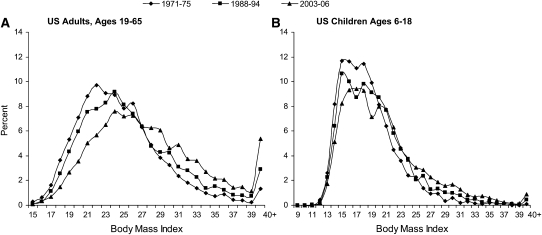
As is often noted, the BMI distribution in the United States is becoming increasingly skewed toward the upper levels. I present shifts in the weighted percentages of individuals aged 6–18 and 19–65 y reported over a 35-y period (1971–2006) (Figure 1). The shift toward increasingly smaller proportions of individuals in the lower BMI levels is quite pronounced in both children and adults over the last decade. Similar patterns are seen for the other 3 countries for children and for the United Kingdom for adults.
FIGURE 1.
A, B: Shift in the BMI (in kg/m2) distribution in the United States, 1971–2006 (percentage of the population at each BMI point). Source: NHANES (National Health and Nutrition Examination Survey; 1971–1975, 1988–1994, and 2003–2006) data weighted to be nationally representative.
Changes in BMI levels at the 95th centile
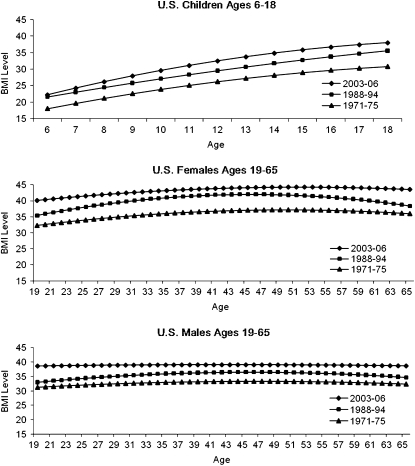
This section focuses on differentially significant changes between the United States and 3 other countries. How these changes would look for all men, women, and children over the age spectrums selected in the United States is shown in Figure 2. The trends across all countries for the 85th centile were similar (results not shown).
FIGURE 2.
Trends in the BMI level (in kg/m2) at the 95th centile in the United States.
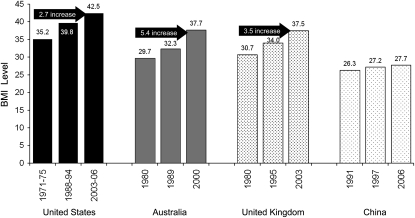
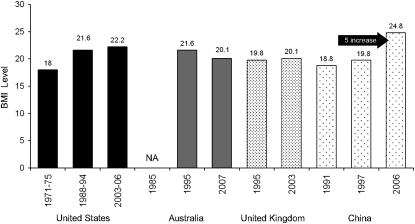
Comparisons across countries for women aged 30 y and children aged 6 y (Figures 3 and 4) show important relative changes that closed (for women) or removed (for children) the higher BMI gap between the United States and the other 3 countries shown here. When I reviewed detailed information on the BMI centile shifts by age for each country for both children and women, I found that it is the younger cohorts that are experiencing much higher BMIs at earlier ages.
FIGURE 3.
Shift in BMI levels (in kg/m2) at the 95th centile for women aged 30 y. Results are on the basis of quantile regression using age and age squared (when significant).
FIGURE 4.
Shift in BMI levels (in kg/m2) at the 95th centile for children aged 6 y. Results are on the basis of quantile regression using age and age squared (when significant).
Among adults, women display higher BMI levels for the 95th centile. Although the US women show much higher BMI levels, the increase in the 18-y period (1988–2006) in the 95th centile BMI level was only 2.7 BMI units for women aged 30 y. In contrast, the increases over much shorter periods in Australia (32.3 to 37.7, 11-y period; 1989–2000) and the United Kingdom (34.0 to 37.5, 8-y period; 1995–2003) were greater. The changes in adult BMIs at the 95th (and at the 85th centile) in China were very small relative to the other countries. Among men, only US men aged 30 y show meaningful increases (results not presented for men in the 3 other countries).
For children, the picture that emerges is different. For children aged 6 y, all countries show roughly the same BMI levels for the 95th centile except for China. The younger cohorts in China have increased their weight and BMI to such an extent that their 95th centile BMI levels are not that different from those of older children. Remarkably, children aged 6–10 y in China at the 95th centile have a BMI of 25.
DISCUSSION
This article uses the BMI data of 4 selected countries to show that high BMI growth at the upper scale of the BMI distribution is not limited to the United States. In particular, I document the large increases among women in the United Kingdom and Australia and in children of younger ages (6–9 y) in China. The implications for increased medical complications from these BMI increases are considerable.
In the United States, Flegal et al (11), Carroll et al (12), and Ogden et al (19) have shown there is a significant population of adults who are eligible for bariatric surgery. Even among children and adolescents, the need for bariatric surgery is growing rapidly (20, 21). This represents an important public health intervention in the United States with the best long-term research on the implications of this surgery for health showing strong benefits, although with some notable psychological side effects (22). These studies, however, do not document the debility, disability, and social consequences faced by these individuals before surgery nor the societal costs before and after this surgery. In China, a group of scholars estimated the economic costs for much earlier estimates of adult BMI (23). From that very detailed economic and epidemiologic analysis, we estimated that 3.6% of the 2000 Chinese Gross National Product (GNP) and 8.7% of the 2025 Chinese GNP would be spent on obesity and its associated patterns (ie, poor diet and decrease in physical activity). These new shifts among children in that country suggest a much higher cost for the society in the future.
Increases in obesity in all countries remains a major concern; however, this article selected only 4 countries to illustrate the point that large increases in the BMI levels among the 95th centile exist for children in China and for adults in Australia and the United Kingdom. (Other articles in this supplement to the Journal include references 24–26.)
Acknowledgments
I thank Frances L Dancy for administrative assistance, Tom Swasey for graphics support, and Phil Bardsley for organizing the files and assisting with the quantile regressions.
The author had no conflict of interest of any type with respect to this article.
REFERENCES
- 1.Popkin BM. The world is fat—the fads, trends, policies, and products that are fattening the human race. New York, NY: Avery-Penguin Group, 2008 [Google Scholar]
- 2.World Health Organization Diet, nutrition, and the prevention of chronic diseases. WHO Technical Report Series. Geneva, Switzerland: World Health Organization, 2003 [PubMed] [Google Scholar]
- 3.Cowie CC, Rust KF, Byrd-Holt DD, et al. Prevalence of diabetes and impaired fasting glucose in adults in the U.S. population: National Health and Nutrition Examination Survey 1999–2002. Diabetes Care 2006;29:1263–8 [DOI] [PubMed] [Google Scholar]
- 4.Mendez MA, Monteiro CA, Popkin BM. Overweight exceeds underweight among women in most developing countries. Am J Clin Nutr 2005;81:714–21 [DOI] [PubMed] [Google Scholar]
- 5.Popkin BM. Global nutrition dynamics: the world is shifting rapidly toward a diet linked with noncommunicable diseases. Am J Clin Nutr 2006;84:289–98 [DOI] [PubMed] [Google Scholar]
- 6.Rivera JA, Barquera S, Gonzalez-Cossio T, Olaiz G, Sepulveda J. Nutrition transition in Mexico and in other Latin American countries. Nutr Rev 2004;62:S149–57 [DOI] [PubMed] [Google Scholar]
- 7.Popkin BM, Conde W, Hou N, Monteiro CA. Is there a lag globally in overweight trends for children as compared to adults? Obesity (Silver Spring) 2006;14:1846–53 [DOI] [PubMed] [Google Scholar]
- 8.Popkin BM, Keyou G, Zhai F, Guo X, Ma H, Zohoori N. The nutrition transition in China: a cross-sectional analysis. Eur J Clin Nutr 1993;47:333–46 [PubMed] [Google Scholar]
- 9.Du S, Lu B, Zhai F, Popkin BM. A new stage of the nutrition transition in China. Public Health Nutr 2002;5:169–74 [DOI] [PubMed] [Google Scholar]
- 10.Stamatakis E, Primatesta P, Chinn S, Rona R, Falascheti E. Overweight and obesity trends from 1974 to 2003 in English children: what is the role of socioeconomic factors? Arch Dis Child 2005;90:999–1004 [DOI] [PMC free article] [PubMed] [Google Scholar]
- 11.Ogden CL, Carroll MD, Curtin LR, McDowell MA, Tabak CJ, Flegal KM. Prevalence of overweight and obesity in the United States, 1999–2004. JAMA 2006;295:1549–55 [DOI] [PubMed] [Google Scholar]
- 12.Flegal KM, Carroll MD, Ogden CL, Johnson CL. Prevalence and trends in obesity among US adults, 1999–2000. JAMA 2002;288:1723–7 [DOI] [PubMed] [Google Scholar]
- 13.Cole TJ, Bellizz MC, Flegal KM, Dietz WH. Establishing a standard definition for child overweight and obesity worldwide: international survey. BMJ 2000;320:1240–3 [DOI] [PMC free article] [PubMed] [Google Scholar]
- 14.STATA V. Computer software program. College Station, TX: Stata Corporation, 2009 [Google Scholar]
- 15.Koenker R, Hallock KF. Quantile regression. J Econ Perspect 2001;15:143–56 [Google Scholar]
- 16.Cole TJ, Green PJ. Smoothing reference centile curves: the LMS method and penalized likelihood. Stat Med 1992;11:1305–19 [DOI] [PubMed] [Google Scholar]
- 17.Fogel RW. The escape from hunger and premature death, 1700-2100 Europe, America, and the Third World. New York, NY: Cambridge University Press, 2004 [Google Scholar]
- 18.Bua J, Olsen LW, Sorensen TIA. Secular trends in childhood obesity in Denmark during 50 years in relation to economic growth. Obesity (Silver Spring) 2007;15:977–85 [DOI] [PubMed] [Google Scholar]
- 19.Hedley AA, Ogden CL, Johnson CL, Carroll MD, Curtin LR, Flegal KM. Prevalence of overweight and obesity among US children, adolescents, and adults, 1999-2002. JAMA 2004;291:2847–50 [DOI] [PubMed] [Google Scholar]
- 20.Mechanick JI, Kushner RF, Sugerman HJ. Partial retraction. Retraction of specific recommendations regarding bariatric surgery for children and adolescents in “Executive summary of the recommendations of the American Association of Clinical Endocrinologists, the Obesity Society, and American Society for Metabolic & Bariatric Surgery medical guidelines for clinical practice for the perioperative nutritional, metabolic, and nonsurgical support of the bariatric surgery patient” (Endocr Pract. 2008;14[3]:318-336). Endocr Pract 2008;14:650. [DOI] [PubMed] [Google Scholar]
- 21.Sugerman HJ, Sugerman EL, DeMaria E, et al. Bariatric surgery for severely obese adolescents. J Gastrointest Surg 2003;7:102–8 [DOI] [PubMed] [Google Scholar]
- 22.Sjostrom L, Lindroos A-K, Peltonen M, et al. Lifestyle, diabetes, and cardiovascular risk factors 10 years after bariatric surgery. N Engl J Med 2004;351:2683–93 [DOI] [PubMed] [Google Scholar]
- 23.Popkin BM, Kim S, Rusev ER, Du S, Zizza C. Measuring the full economic costs of diet, physical activity and obesity-related chronic diseases. Obes Rev 2006;7:271–93 [DOI] [PubMed] [Google Scholar]
- 24.Apovian CM. The causes, prevalence, and treatment of obesity revisited in 2009: what have we learned so far? Am J Clin Nutr 2010;91(suppl):277S–9S [DOI] [PubMed] [Google Scholar]
- 25.Heber D. An integrative view of obesity. Am J Clin Nutr 2010;91(suppl):280S–3S [DOI] [PMC free article] [PubMed] [Google Scholar]
- 26.Blackburn GL, Wollner S, Heymsfield SB. Lifestyle interventions for the treatment of class III obesity: a primary target for nutrition medicine in the obesity epidemic. Am J Clin Nutr 2010;91(suppl):289S–92S [DOI] [PMC free article] [PubMed] [Google Scholar]


