

Abstract
γ-Tubulin Small Complex (γ-TuSC) is the universally-conserved complex in eukaryotes that contains the microtubule (MT) nucleating protein: γ-tubulin. γ-TuSC is a heterotetramer with two copies of γ-tubulin and one copy each of Spc98p and Spc97p. Previously, the structure of γ-TuSC was determined by single particle Electron Microscopy (EM) at 25 A resolution. γ-TuSC is Y shaped with a single flexible arm that could be the key to regulating MT nucleation. EM gold labeling revealed the locations of γ-tubulin at the top of the Y. In vivo Fluorescence Resonance Energy Transfer (FRET) suggested the relative orientations of Spc98p and Spc97p but did not distinguish which large subunit formed the flexible arm. Here, using fluorescent proteins as covalently attached tags, we used class averages and 3D random conical tilt reconstructions to confirm the in vivo FRET results, clearly demonstrating that the Spc98p/97p C-termini interact directly with γ-tubulin. Most significantly we have determined that the flexible arm belongs to Spc98p and our data also suggests that the N-termini of Spc98p and Spc97p are crossed. More generally, our results confirm that despite their small size, covalently attached fluorescent proteins perform well as subunit labels in single particle EM.
Keywords: γ-TuSC, Tub4p, γ-tubulin, Spc98p, Spc97p, Electron Microscopy labeling
Paper
Microtubule Organizing Centers (MTOCs) organize the spatial and temporal patterns of microtubules by controlling their nucleation. Although the morphology of MTOCs varies greatly among different phyla, all eukaryotes utilize γ-tubulin (Tub4p in yeast) to nucleate microtubules (Wiese and Zheng 2006). γ-tubulin is found in the 300 kDa γ-Tubulin Small Complex (γ-TuSC), a highly conserved heterotetramer with two copies of γ-tubulin and one each of Spc98p and Spc97p. In metazoa, γ-TuSC is a repeating component within the larger γ-Tubulin Ring Complex (γ-TuRC) (Moritz et al., 2000). While both purified γ-tubulin and γ-TuRC are potent MT nucleators, nucleating activity for γ-TuSC is barely detectable even though it is the only γ-tubulin complex within the highly functional S. cerevisiae Spindle Pole Body (SPB) (Gunawardane, et al. 2000, Vinh et al., 2002).
Recently, we determined the structure of the S. cerevisiae γ-TuSC at moderate resolution using single particle electron microscopy (Kollman et al., 2008). The structure is Y-shaped and γ-tubulin is located in lobes at the tips of the two arms (Fig. 1A). One of the arms adopts different conformations due to a limited rotation about its base. Significantly, in all of the observed conformations, the γ-tubulins are held in nucleation incompatible orientations. We have suggested that this configuration may provide a way of regulating γ-TuSC activity, and that further movement of the flexibly attached arm is required to bring the two γ-tubulins together in a nucleation compatible orientation (Kollman et al., 2008).
Figure 1.
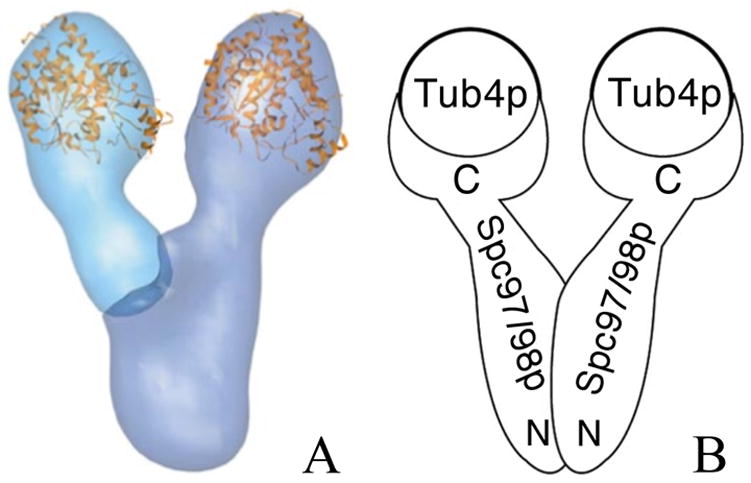
A) Electron microscopy reconstruction of the S. cereviseae γ-TuSC. Light blue represents the flexibly attached arm and the more rigid body is presented in dark blue. The location of γ-tubulin was indicated by gold labeling, and the crystal structure of human γ-tubulin was manually fit into the structure (Kollman et al. 2008). B) A schematic representation of the arrengement of γ-TuSC proteins based on the relative orientations of N- and C- termini determined by in vivo FRET.
The location of γ-tubulin within γ-TuSC was determined by directly labeling His-tagged γ-tubulin with Ni-NTA nanogold. All attempts to label Spc98p and Spc97p in the same way using either 6x-His or 12x-His tags were unsuccessful due to very low labeling yields. Although the relative orientations of Spc98p and Spc97p were suggested by in vivo Fluorescence Resonance Energy Transfer (FRET) of dual-labeled complexes (Fig. 1B), these experiments were unable to distinguish Spc98p and Spc97p in the EM structure. Further, because the FRET experiments examined γ-TuSCs assembled at the SPB, there was the potential for confusing intra- and inter-complex FRET signals. Thus, we sought a more direct way to determine the locations and orientations of the γ-TuSC components.
Previous reports have shown the benefits of using small proteins as covalent labels for localization in EM. In several cases two-dimensional averages were used to localize tagged components. (Alcid and Jurica, 2008; Bertin et al., 2008; Li et al., 2008; Jones et al., 2008). In at least two previous studies, reconstructions of tagged complexes yielded more precise three-dimensional localization (Kratz et al., 1999; Bueler and Rubinstein, 2008). Adopting a similar approach, we generated γ-TuSC tagged at the N- or C- termini of Spc98p or Spc97p with yellow fluorescent protein (YFP) or cyan fluorescent protein (CFP). In three cases we were able to clearly identify tags, which were in a range of positions due to the flexibility of the linker. For both the N- and C-terminally tagged Spc97p, we could classify particles based on the position of the tag and generate random conical tilt reconstructions for each class. This allowed us to identify the positions of the termini of each protein. In addition, our data shows that 3-D reconstructions of tagged small complexes are feasible, despite the small size of the tag, and could be used as a general spatial localization method.
The following γ-TuSC constructs were overexpressed in Sf9 cells and purified as previously described (Vinh et al., 2002): YFP tagged C-terminus of Spc97p (γ-TuSC:Spc97pYFP), YFP tagged N-terminus of Spc97p (γ-TuSC:YFPSpc97p), CFP tagged N-terminus of Spc98p (γ-TuSC:CFPSpc98p) and CFP tagged C-terminus of Spc98p (γ-TuSC: Spc98pCFP). The linker connecting the fluorescent protein to the complex in each construct is 7 to 10 amino acids long. In each case, SDS-PAGE gels showed a band of the correct molecular weight for the tagged component (Fig. 2). The faint bands below the CFP-tagged constructs in the lanes γ-TuSC:CFPSpc98p and γ-TuSC:Spc98pCFP, are thought to be a minor degree of degradation of the termini containing the tags. In the same lanes, the bands immediately above Tub4p are likely to be a protein contaminant, possibly a chaperone as TRiC-like particles are observed in the EM samples. To assure that this band is contamination and not a severe degradation product, we quantified the protein ratios between bands corresponding to the tagged and untagged Spc97p/98p and Tub4p in each SDS-PAGE lane (Figure 2) using ImageJ (Abramoff et al., 2004). Significantly, the ratios to Tub4p corresponded to the expected stoichiometry of 2:1:1:1, indicating no significant degradation of the tagged proteins.
Figure 2.

SDS-PAGE of γ-TuSC complexes. 1) γ-TuSC; 2) γ-TuSC:YFPSpc97p; 3) γ-TuSC:Spc97pYFP; 4) γ-TuSC:CFPSpc98p and 5) γ-TuSC:Spc98pCFP. The Tub4p His-tag linker is longer in the γ-TuSC, hence the Tub4p band migrates a bit slower than the other constructs. The band above Tub4p in the Spc98p-CFP constructs (Lanes 4,5) thought to be contamination, as it was observed on the EM samples. In addition, the ratios (see below SDS-PAGE) between proteins in each lane corresponded to the γ-TuSC stoichiometry: 2:1:1:1, Tub4p, Spc97p/98p tagged and untagged.
Samples were prepared in thin layers of uranyl formate stain on carbon coated grids. Random Conical Tilt (RCT) data were acquired on a Tecnai T12 microscope (FEI Co., Netherlands) operating at 120kV and 52,000x magnification; images were recorded on a 4k×4k CCD camera (Gatan Inc., U.S) at a pixel size of 2.21 Å. The data were collected using the automated Conical Tilt feature of the UCSF Tomography package (Zheng et al., 2007). The RCT data consisted of a 60° tilt image and three overlapping 0° images, allowing all particles observed at 60° to be used, maximizing data collection efficiency. Particle picking and image processing were done using WEB and SPIDER (Frank et al., 1996), respectively. For initial stages of processing, the particle images were binned 2×. On average the data sets for each construct contained 4800 particles. Reference-based alignment and classification of untilted particles was performed using the five classes of γ-TuSC (representing both movement of the flexible arm and slight differences in orientation relative to the grid) determined in our previous study (Kollman et al., 2008). These class averages closely resembled the untagged references, and the fraction of particles in each class was similar for tagged and untagged complexes, indicating that the presence of the tag was not affecting the overall structure of the complex or how it interacted with the grid. Typically, the averages showed blurred density for the tag, indicating flexible attachment, most likely due to the length of the linker region. Principal Component Analysis (PCA) and hierarchical clustering were used to sort particles into classes with unique tag positions. These class averages were then used as references for a second round of alignment and classification. Euler angles were assigned to each tilted particle by combining the in-plane rotations determined during alignment with the data collection geometry. The unbinned tilted particles were back projected to form an initial model. Finally, three rounds of refinement were performed to correct the image shifts for each particle. EMAN (Ludtke et al., 1999) and Chimera (Pettersen et al., 2004) were used to visualize the 2D images and the maps.
For γ-TuSC:YFPSpc97p and γ-TuSC:Spc97pYFP, the extra 27 kDa mass of the tag was clearly visible in the raw micrographs and in both the 2-D class averages and the 3-D reconstructions (Figs. 3A-B and 3D-E). The tag appears as a small circle of density in the 2-D averages and as a droplet-shaped protruding density in the 3-D reconstructions. We manually docked the YFP crystal structure (PDB code: 1YFP) into the protruding density of the 3-D reconstruction of γ-TuSC:Spc97pYFP to show that they are comparable in size (Fig. 3I). We overlaid volumes from 3 or 4 of the classes for each of these constructs to show the different positions that the tag adopts (Fig. 3G-H).
Figure 3.

Structural analysis of tagged γ-TuSC complexes. A, B and C) Electron microscopy raw particles of γ-TuSC:Spc97pYFP, γ-TuSC:YFPSpc97p and γ-TuSC:YFPSpc98p respectively. The red arrow indicates the location of YFP and CFP density on each image. D, E and F) 2-D class averages of γ-TuSC:Spc97YFPp, γ-TuSC:YFPSpc97p and γ-TuSC:CFPSpc98p respectively with red arrows indicating the position of the tag. G and H) Overlay of the various 3-D reconstructions of γ-TuSC:Spc97YFPp and γ-TuSC:YFPSpc97p; the complex is shown in purple and the tags are colored red, blue, green and yellow. I) 3-D reconstruction of γ-TuSC:Spc97YFPp with the crystal structure of YFP, shown in yellow, manually docked in the protruding density. Size bar is 10nm.
In the case of γ-TuSC:CFPSpc98p, some of the tagged raw particles were visible in the raw micrographs (Fig. 3C) but in general, the tag seems to be much more flexibly attached, perhaps indicating inherent flexibility in the N-terminal region of Spc98p. Due to this disorder we were only able to obtain one 2-D average (Fig. 3F) with too few particles showing the tag in the same location for a reliable 3-D reconstruction. The variability manifests directly as more diffuse 2-D averages than those seen in Figs 3D and 3E. For γ-TuSC:Spc98pCFP, we were unable to locate the tag in the raw micrographs and in the 2-D class averages, possibly because the tag localizes on top or behind the complex.
Overall, our data confirm the locations of the N- and C- termini of Spc98p and Spc97p inferred from our previous in vivo FRET results (Kollman et al., 2008). In addition to confirming the Spc98p/97p subunit polarity, new structural features have been revealed. Importantly, we have shown that Spc97p forms the rigid arm of γ-TuSC, while Spc98p contains the flexible arm. Unexpectedly, the N- and C-terminal tags on Spc97p are on opposite sides of γ-TuSC. The tag at the N-terminus of Spc97p is more localized and favors a set of positions diagonally opposite to its C-terminus. We suggest that this indicates that the Spc97p and Spc98p are crossed, resulting in a crossed N-termini. Additionally, the N-terminal region of Spc98p appears to be inherently flexible, a finding consistent with sequence alignments of Spc97p and Spc98p which show Spc98p to have an additional ~150 amino acids at its N-terminus. In our previous study (Kollman et al., 2008) we suggested that movement of the flexibly attached arm regulates γ-TuSC activity. Our 2-D averages and 3-D reconstructions clearly identify Spc98p as the subunit containing the flexible arm. The identification of the flexible subunit will help focus future studies involving mutagenesis and/or post-translational modifications on Spc98p to help understand the mechanism of regulation of MT nucleation by γ-TuSC.
Our data also confirms the termini localization indicated by our previous in vivo FRET study and further suggests that the N-termini are crossed. Together this allows us to update our model of γ-TuSC from the one seen in Fig 1B to the one in Fig. 4. Finally, our 2D averages and 3D reconstructions suggest that covalently-attached fluorescent protein tags are ideally suited to EM localization even at moderate resolutions.
Figure 4.

A revised model of the S. cereviseae γ-TuSC based on observed tag positions. The flexibility of Spc98p is indicated with an arrow, and the the N-termini of Spc97p and Spc98p are crossed.
Acknowledgments
We are grateful to Shawn Zheng and Michael Braunfeld for assistance with electron microscopy. This work was supported by National Institutes of Health grants GM-31627 (to D.A.A. and R.M.C), R01GM-040506 and P41 RR-011823 (T.N.D and A. Z.) and the Howard Hughes Medical Institute.
Footnotes
Publisher's Disclaimer: This is a PDF file of an unedited manuscript that has been accepted for publication. As a service to our customers we are providing this early version of the manuscript. The manuscript will undergo copyediting, typesetting, and review of the resulting proof before it is published in its final citable form. Please note that during the production process errors may be discovered which could affect the content, and all legal disclaimers that apply to the journal pertain.
Bibliography
- Abramoff MD, Magelhaes PJ, Ram SJ. Image Processing with Image. J Biophotonics Intl. 2004;11-7:36–42. [Google Scholar]
- Alcid EA, Jurica MS. A protein-based EM label for RNA identifies the location of exons in spliceosomes. Nat Struct Mol Biol. 2008;15:213–5. doi: 10.1038/nsmb.1378. [DOI] [PMC free article] [PubMed] [Google Scholar]
- Bertin A, McMurray MA, Grob P, Park SS, Garcia G, Patanwala I, Ng HL, Alber T, Thorner J, Nogales E. Saccharomyces cerevisiae septins: supramolecular organization of heterooligomers and the mechanism of filament assembly. Proc Natl Acad Sci USA. 2008;105:8274–9. doi: 10.1073/pnas.0803330105. [DOI] [PMC free article] [PubMed] [Google Scholar]
- Bueler SA, Rubinstein JL. Location of subunit d in the peripheral stalk of the ATP synthase from Saccharomyces cerevisiae. Biochemistry. 2008;47:11804–10. doi: 10.1021/bi801665x. [DOI] [PubMed] [Google Scholar]
- Frank J, Radermacher M, Penczek P, Zhu J, Li Y, Ladjadj M, Leith A. SPIDER and WEB: processing and visualization of images in 3D electron microscopy and related fields. Journal of Structural Biology. 1996;116:190–9. doi: 10.1006/jsbi.1996.0030. [DOI] [PubMed] [Google Scholar]
- Gunawardane RN, Martin OC, Cao K, Dej K, Iwamatsu A, Zheng Y. Characterization and reconstitution of Drosophila gamma-tubulin ring complex subunits. The Journal of Cell Biology. 2000;151(7):1513–24. doi: 10.1083/jcb.151.7.1513. [DOI] [PMC free article] [PubMed] [Google Scholar]
- Jones PP, Meng X, Xiao B, Cai S, Bolstad J, Wagenknecht T, Liu Z, Chen SRW. Localization of PKA phosphorylation site, Ser(2030), in the three-dimensional structure of cardiac ryanodine receptor. Biochem J. 2008;410:261–70. doi: 10.1042/BJ20071257. [DOI] [PMC free article] [PubMed] [Google Scholar]
- Kratz PA, Böttcher B, Nassal M. Native display of complete foreign protein domains on the surface of hepatitis B virus capsids. Proc Natl Acad Sci. 1999;96:1915–20. doi: 10.1073/pnas.96.5.1915. [DOI] [PMC free article] [PubMed] [Google Scholar]
- Kollman JM, Zelter A, Muller EG, Fox B, Rice LM, Davis TN, Agard DA. The structure of the gamma-tubulin small complex: implications of its architecture and flexibility for microtubule nucleation. Mol Biol Cell. 2008;19:207–15. doi: 10.1091/mbc.E07-09-0879. [DOI] [PMC free article] [PubMed] [Google Scholar]
- Li H, Chavan M, Schindelin H, Lennarz WJ, Li H. Structure of the oligosaccharyl transferase complex at 12 A resolution. Structure. 2008;16:432–40. doi: 10.1016/j.str.2007.12.013. [DOI] [PubMed] [Google Scholar]
- Ludtke SJ, Baldwin PR, Chiu W. EMAN: semiautomated software for high-resolution single-particle reconstructions. J Struct Biol. 1999;128:82–97. doi: 10.1006/jsbi.1999.4174. [DOI] [PubMed] [Google Scholar]
- Moritz M, Braunfeld MB, Guénebaut V, Heuser J, Agard DA. Structure of the gamma-tubulin ring complex: a template for microtubule nucleation. Nat Cell Biol. 2000;2:365–70. doi: 10.1038/35014058. [DOI] [PubMed] [Google Scholar]
- Pettersen EF, Goddard TD, Huang CC, Couch GS, Greenblatt DM, Meng EC, Ferrin TE. UCSF Chimera--a visualization system for exploratory research and analysis. J Comput Chem. 2004;25:1605–12. doi: 10.1002/jcc.20084. [DOI] [PubMed] [Google Scholar]
- Vinh DB, Kern JW, Hancock WO, Howard J, Davis TN. Reconstitution and characterization of budding yeast gamma-tubulin complex. Mol Biol Cell. 2002;13:1144–57. doi: 10.1091/mbc.02-01-0607. [DOI] [PMC free article] [PubMed] [Google Scholar]
- Wiese C, Zheng Y. Microtubule nucleation: γ-Tubulin and beyond. J Cell Science. 2006;119:4143–4153. doi: 10.1242/jcs.03226. [DOI] [PubMed] [Google Scholar]
- Zheng S, Kollman J, Braunfeld M, Sedat J, Agard D. Automated acquisition of electron microscopic random conical tilt sets. Journal of Structural Biology. 2007;157:148–155. doi: 10.1016/j.jsb.2006.10.026. [DOI] [PMC free article] [PubMed] [Google Scholar]