

Abstract
Rationale and Objectives
Both single-shot diffusion-weighted echo-planar imaging (EPI) and line scan diffusion imaging (LSDI) can be used to obtain magnetic resonance diffusion tensor data and to calculate directionally invariant diffusion anisotropy indices, ie, indirect measures of the organization and coherence of white matter fibers in the brain. To date, there has been no comparison of EPI and LSDI. Because EPI is the most commonly used technique for acquiring diffusion tensor data, it is important to understand the limitations and advantages of LSDI relative to EPI.
Materials and Methods
Five healthy volunteers underwent EPI and LSDI diffusion on a 1.5 Tesla magnet (General Electric Medical Systems, Milwaukee, WI). Four-mm thick coronal sections, covering the entire brain, were obtained. In addition, one subject was tested with both sequences over four sessions. For each image voxel, eigenvectors and eigenvalues of the diffusion tensor were calculated, and fractional anisotropy (FA) was derived. Several regions of interest were delineated, and for each, mean FA and estimated mean standard deviation were calculated and compared.
Results
Results showed no significant differences between EPI and LSDI for mean FA for the five subjects. When inter-session reproducibility for one subject was evaluated, there was a significant difference between EPI and LSDI in FA for the corpus callosum and the right uncinate fasciculus. Moreover, errors associated with each FA measure were larger for EPI than for LSDI.
Conclusion
Results indicate that both EPI- and LSDI-derived FA measures are sufficiently robust. However, when higher accuracy is needed, LSDI provides smaller error and smaller inter-subject and inter-session variability than EPI.
Keywords: Diffusion, single-shot EPI, LSDI, anisotropy
Since its introduction to clinical use in 1986 by Le Bihan et al (1), brain diffusion magnetic resonance imaging has become one of the most important tools in clinical neuroimaging. It was initially used to identify stroke lesions in the acute stage; more recently it has been used to evaluate white matter organization. The latter application experienced a tremendous breakthrough with the introduction of diffusion tensor imaging (2). With the measurement of diffusion along a minimum of six spatial directions, diffusion tensor imaging permits the exact determination of nerve fiber direction for each pixel of an image. Moreover, the diffusion anisotropy, which also can be measured with diffusion tensor imaging, has been used to visualize and quantify disruptions in connectivity and, in some cases, the subsequent reorganization of nerve pathways that result from brain injuries (eg, physical trauma or ischemia), brain tumor, multiple sclerosis, human immunodeficiency virus-1 infection, and schizophrenia, as well as degenerative and metabolic diseases (3,4).
Although it is now possible to obtain diffusion tensor data for the whole brain in less than an hour, the methods used for these acquisitions are not free from limitations. Methods used for obtaining diffusion tensor data in current clinical and research settings include single-shot diffusion-weighted echo-planar imaging (EPI) and line scan diffusion imaging (LSDI). A comparison of these two techniques is the subject of the present study.
Single-shot diffusion-weighted EPI was introduced in 1990 by Turner et al (5). The technique is fast, as it applies multiple gradient reversals to produce many gradient echoes following a single radio-frequency excitation. While the ability to produce a single image in less than a second makes it extremely robust to motion artifacts, it is limited in spatial resolution and very sensitive to chemical shift, local variations in magnetic susceptibility, and diffusion gradient induced eddy currents.
Line scan diffusion imaging was introduced in 1996 by Gudbjartsson et al (6), and, unlike the single-shot EPI, where a complete image is acquired after each radio-frequency excitation, LSDI is based on the sequential acquisition of parallel columns lying in the image plane. The sequential collection of this line data in independent single-shot acquisitions makes the sequence largely insensitive to bulk motion artifacts because no phase encoding is used. Because of the acquisition method, the LSDI sequence is four to six times slower than single-shot diffusion-weighted EPI. On the other hand, it allows for better spatial resolution (7), and is relatively free from the artifacts inherent in single-shot EPI methods. This is at least the current thinking, although, except for one study that compared diffusion coefficients obtained using single-shot diffusion-weighted EPI and LSDI on two different scanners, two different field strengths, and one brain region (8), no studies have directly compared single-shot EPI and LSDI in an empirical study with respect to quantifying diffusion anisotropy in the same subject using multiple brain regions of interest (ROIs).
The goal of the current study is to compare these two techniques, using inter-subject and inter-session reproducibility and reliability measures across several ROIs. We selected specific brain regions so that we could test how investigated sequences impact regions of different anatomic locations and different tissue contents. We hypothesized that LSDI would perform better (would be characterized by the lower error of measures) for smaller fiber tracts, as well as in brain regions known to be more likely distorted by artifacts common to single-shot diffusion-weighted EPI.
MATERIALS AND METHODS
Five healthy volunteers, all in their middle twenties, after signing informed consent, were scanned with both LSDI and single-shot diffusion-weighted EPI during the same session. In addition, for the intersession reproducibility estimation, one subject was tested, also with both sequences, over four separate sessions. Line scan diffusion imaging was implemented on a 1.5 Tesla GE Echo-speed system (General Electric Medical Systems, Milwaukee, WI), which permits maximum gradient amplitudes of 40 mT/m. For single-shot diffusion-weighted EPI imaging, we used the standard sequence provided by the system manufacturer. All MR scans were performed with a quadrature head coil. For high diffusion-weighting (b-factor 1,000 s/mm2), data were acquired for each of six non-colinear and non-coplanar diffusion encoding directions ((1 1 0), (0 1 1), (1 0 1), (0 1 −1), (1 −1 0), (−1 0 1)). For low diffusion weighting, we collected only two images in the case of LSDI, and one image in the case of EPI. Incomplete collection of diffusion encoding directions at low b-factors is practical because diffusion-related signal changes are minimal and therefore do not contribute very much to the noise and directional dependence of the apparent diffusion coefficient (ADC).
We used the following scan parameters: For LSDI: rectangular field of view, 220 × 165 mm; scan matrix, 128 × 96 interpolated to 256 × 192 in the final images; slice thickness, 4 mm; interslice distance, 1 mm; receiver bandwidth, ± 4 kHz; echo time, 64 ms; repetition time 2,592 ms; excitation 1. For single-shot EPI: rectangular field of view, 220 × 165 mm; scan matrix, 128 × 96; slice thickness, 4 mm; interslice distance, 1 mm; receiver bandwidth, 62 kHz; echo time, 113 ms; repetition time, 3,000 ms; averages 4.
Depending on brain size, we acquired a total of 31–35 coronal slices, covering the entire brain. For LSDI, the scan time was 60 seconds per section and 31–35 minutes for all slices, whereas for single-shot diffusion-weighted EPI, the total scan time, independent of slice coverage, because of an acquisition with four interleaves, was 6 minutes. Line scan diffusion imaging and single-shot diffusion-weighted EPI scans were performed in a single session, with the same slice geometry and position (thus we did not realign the images, but instead assumed that the slices were aligned with each other for the same session). Our rationale for not using more averages was to keep the reasonable advantage of single-shot diffusion-weighted EPI over LSDI in terms of scan time. Signal to noise ratio (SNR) for both techniques was assessed as average ratio of brain versus background signal on the unprocessed diffusion-weighted images.
After image reconstruction, the diffusion-weighted images were transferred to a SUN (Sun Microsystems Inc., Santa Clara, CA) workstation, where eigenvalue, eigenvector, fractional anisotropy (FA) (9, 10) and trace ADC maps of the diffusion tensor were calculated.
For the FA and trace ADC measurements, we picked one coronal slice that includes the most dense part of the uncinate fasciculus (see Kubicki et al [11]). This slice also contains the anterior part of the internal capsule, the anterior portion of the body of the corpus callosum, and the gray matter of the ventral prefrontal cortex. More specifically, in this study, we measured FA and trace ADC within: (A) the internal capsule, a large fiber tract with relatively high anisotropy; (B) the corpus callosum, the biggest and the most dense fiber tract in the brain; (C) the uncinate fasciculus, a fiber tract characterized by moderate diffusion anisotropy and located within the temporal lobe and; (D) the ventral part of the superior frontal gyrus, an area characterized by low-diffusion anisotropy.
First, the ROIs were drawn on the single-shot EPI FA maps. Contours of the ROI were then copied and applied to the LSDI FA maps, as well as to the single-shot diffusion-weighted EPI and LSDI ADC maps. Position and shape of the ROIs were edited, where appropriate. We convinced ourselves that analysis of the EPI data at the original scan resolution of 128 × 96 did not yield significantly different results in comparison to an analysis of the same image data interpolated to 256 × 192; the average value of ROI did not change more than 0.5% and the standard deviation not more than 8%. The mean areas for the drawn ROIs were as follows: left uncinate fasciculus, 23 mm2; right uncinate fasciculus, 22 mm2; corpus callosum, 95 mm2; left internal capsule, 83 mm2; right internal capsule, 99 mm2; and gray matter ROI, 76 mm2. Examples of ROI placement are presented in Figure 1.
Figure 1.
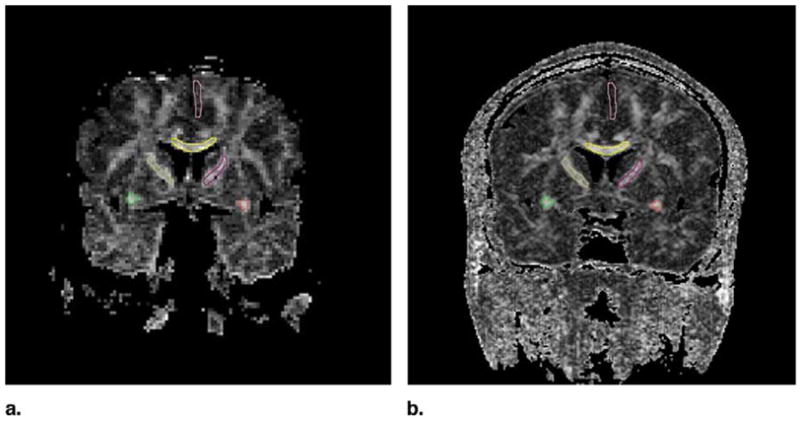
Placement of the ROIs. Yellow, corpus callosum; green and red, uncinate fasciculus; pink, superior frontal gyrus; brown and magenta, internal capsule.
In our comparison, we looked at four different estimates of measurement error: mean FA and its standard deviation and mean trace ADC and its standard deviation. These values were assessed separately for each ROI. The ROI values were then compared between methods (LSDI vs EPI): (A) across five subjects (among subjects comparison), and (B) (in one subject only) among four sessions (among sessions comparison). Paired t-tests were used for among-subjects comparison, while for the among-sessions comparison, independent sample t-tests were used. For the estimation of lateralization effects, group-by-side interactions were estimated using repeated measure analysis of variance (ANOVA).
RESULTS
Signal to noise ratio measured in one data set was 9.4 for the EPI diffusion-weighted images, and 11.2 for the LSDI diffusion-weighted images.
The FA comparison of single-shot diffusion-weighted EPI and LSDI in five subjects showed no statistical differences for any of the measured regions (right uncinate fasciculus: F(1, 8) = 0.25; P = .64; left cingulate fasciculus: F(1, 8) = 2.7; P = .16; corpus callosum: F(1, 8) = 0.02; P = .91; right internal capsule: F(1, 8) = 4.2; P = .10; left internal capsule: F(1, 8) = 0.11; P = 0.76; gray matter: F(1, 8) = 3.6; P = .12) (see Table 1). Also, ANOVA showed no method by side interaction (either for uncinate fasciculus: F(1, 8) = 4.5; P = .10 or for the internal capsule: F(1, 8) = 0.002; P = .97), demonstrating that the lateralization measures to characterize groups of subjects can be obtained reliably using either of these techniques (also the side by method interaction, when mean errors of the FA measurements were taken into account, was non-significant). However, when inter-subject reliability was taken into account, across-sessions comparison (ie, one subject, four sessions) showed statistically significant differences in mean FA values for both the corpus callosum (t(3) = 3.2; P = .02) and the right uncinate fasciculus (t(3) = −7.9; P = .001). Also, errors associated with ROI FA measures were significantly higher for single-shot diffusion-weighted EPI than for LSDI, especially in the across sessions comparisons (right uncinate: t(3) = 3.3; P = .02; left uncinate: t(3) = 2.5; P = .05; corpus callosum: t(3) = 4.7; P = .005; right internal capsule: t(3) = 6.8; P = .001; left internal capsule: t(3) = 4.3; P = .008; gray matter: t(3) = .32; P = .76) (Table 2). Results of the trace ADC comparisons among subjects and sessions showed differences similar to the observed FA changes. The ROI trace ADC mean values of the EPI scans were comparable with those of the LSDI scans. However, LSDI trace ADC exhibited a smaller error for the across-subjects comparison, and except for the uncinate fasciculus ROI, also for the between subjects comparison (see also Table 2).
Table 1.
Comparison Between Mean Fractional Anisotropy and Mean Apparent Diffusion Coefficient Calculated Using Single-Shot Diffusion-Weighted Echo Planar Imaging and Line Scan Diffusion Imaging within Four Different Regions of Interest
| Single-Shot Diffusion-Weighted EPI (Mean FA ROI Measures ± SD) | LSDI (Mean FA ROI Measures ± SD) | Single-Shot Diffusion-Weighted EPI (Mean Trace ADC [μm2/ms] ROI measures ± SD) | LSDI (Mean Trace ADC [μm2/ms] ROI measures ± SD) | |||||
|---|---|---|---|---|---|---|---|---|
| 5 Subjects | 1 Subject over 4 Sessions | 5 Subjects | 1 Subject over 4 Sessions | 5 Subjects | 1 Subject over 4 Sessions | 5 Subjects | 1 Subject over 4 Sessions | |
| Right uncinate fasciculus | 0.64 ± 0.06 | 0.67 ± 0.01* | 0.68 ± 0.05 | 0.63 ± 0.02* | 0.786 ± 0.037 | 0.748 ± 0.017 | 0.756 ± 0.036 | 0.737 ± 0.028 |
| Left uncinate fasciculus | 0.68 ± 0.08 | 0.65 ± 0.08 | 0.64 ± 0.06 | 0.62 ± 0.02 | 0.728 ± 0.054 | 0.756 ± 0.024 | 0.753 ± 0.034 | 0.745 ± 0.026 |
| Corpus callosum | 0.72 ± 0.09 | 0.6 ± 0.01* | 0.75 ± 0.05 | 0.7 ± 0.02* | 0.834 ± 0.048 | 0.872 ± 0.060* | 0.819 ± 0.054 | 0.754 ± 0.013* |
| Right internal capsule | 0.64 ± 0.05 | 0.65 ± 0.05 | 0.63 ± 0.3 | 0.6 ± 0.03 | 0.684 ± 0.051 | 0.678 ± 0.028 | 0.702 ± 0.009 | 0.693 ± 0.011 |
| Left internal capsule | 0.6 ± 0.06 | 0.62 ± 0.04 | 0.59 ± 0.06 | 0.62 ± 0.03 | 0.697 ± 0.023 | 0.740 ± 0.065 | 0.701 ± 0.014 | 0.699 ± 0.007 |
| Gray matter | 0.20 ± 0.03 | 0.20 ± 0.05 | 0.2 ± 0.05 | 0.25 ± 0.01 | 1.168 ± 0.146* | 1.168 ± 0.168 | 0.994 ± 0.103* | 0.949 ± 0.060 |
NOTE. Five different subjects were scanned using the two methods, and one subject was scanned in four separate sessions with the two methods.
Significant difference between methods (two-tailed independent t-test or two-tailed paired t-test; P < .05, see Materials and Methods for details).
Table 2.
Comparison Between Mean Errors Associated with Single-Shot Diffusion-Weighted Echo Planar Imaging and Line Scan Diffusion Imaging for each Fractional Anisotropy Measurement
| Single-Shot Diffusion-Weighted EPI (Mean Deviation of FA ROI Measures) | LSDI (Mean Deviation of FA ROI Measures) | Single-Shot Diffusion-Weighted EPI (Mean Deviation of Trace ADC ROI Measures) | LSDI (Mean Deviation of Trace ADC ROI Measures) | |||||
|---|---|---|---|---|---|---|---|---|
| 5 Subjects | 1 Subject over 4 Sessions | 5 Subjects | 1 Subject over 4 Sessions | 5 Subjects | 1 Subject over 4 Sessions | 5 Subjects | 1 Subject over 4 Sessions | |
| Right uncinate fasciculus | 0.12 ± 0.02* | 0.14 ± 0.02* | 0.09 ± 0.01* | 0.09 ± 0.01* | 0.059 ± 0.008* | 0.067 ± 0.016* | 0.047 ± 0.009* | 0.043 ± 0.007* |
| Left uncinate fasciculus | 0.13 ± 0.01 | 0.15 ± 0.05* | 0.09 ± 0.01 | 0.09 ± 0.02* | 0.097 ± 0.034* | 0.071 ± 0.003 | 0.060 ± 0.025* | 0.048 ± 0.019 |
| Corpus callosum | 0.16 ± 0.06* | 0.15 ± 0.02* | 0.10 ± 0.02* | 0.09 ± 0.01* | 0.301 ± 0.123* | 0.214 ± 0.008* | 0.134 ± 0.073* | 0.079 ± 0.005* |
| Right internal capsule | 0.13 ± 0.03* | 0.14 ± 0.01* | 0.08 ± 0.01* | 0.08 ± 0.01* | 0.103 ± 0.025* | 0.125 ± 0.019* | 0.054 ± 0.003* | 0.051 ± 0.008* |
| Left internal capsule | 0.14 ± 0.02* | 0.15 ± 0.02* | 0.10 ± 0.01* | 0.10 ± 0.03* | 0.120 ± 0.021* | 0.144 ± 0.046* | 0.052 ± 0.010* | 0.049 ± 0.009* |
| Gray matter | 0.08 ± 0.02 | 0.08 ± 0.02 | 0.07 ± 0.01 | 0.07 ± 0.007 | 0.390 ± 0.081* | 0.375 ± 0.079* | 0.225 ± 0.047* | 0.240 ± 0.036* |
NOTE. Two-tailed independent t-test or two-tailed paired t-test (see Materials and Methods for details;
P < .05).
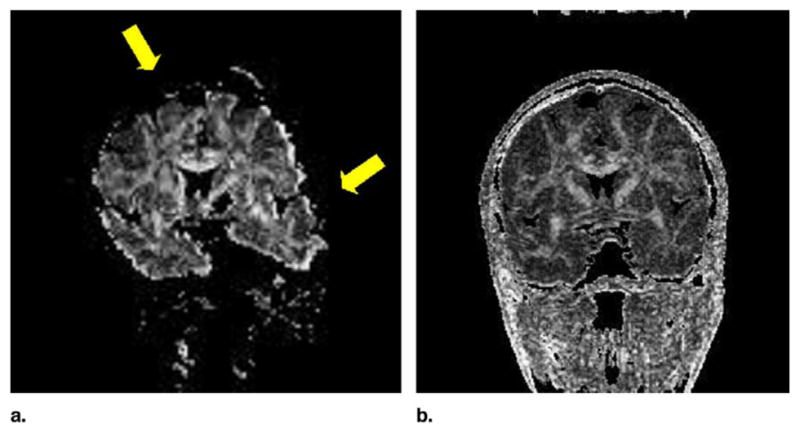
In addition, visual inspection of the images indicated that all images obtained with single-shot diffusion-weighted EPI showed much more pronounced susceptibility and eddy current related artifacts. In particular, susceptibility variations resulted in severe signal loss within the medial, inferior, and middle temporal lobes, and incongruent diffusion-weighted images caused by eddy currents produced elevated FA values along tissue borders (Fig 2). Some of our cases were also considerably affected by susceptibility related distortions in image geometry (for visual comparison of LSDI and single shot EPI see Fig 3).
Figure 2.

Susceptibility-related signal loss and eddy-current artifacts commonly affect the single-shot diffusion-weighted EPI images. On the anisotropy maps, areas corresponding to regions of low signal on the diffusion-weighted image have been thresholded (white arrows) and eddy-current related image distortions give rise to borders with high anisotropy values (white arrows). Fractional anisotropy maps obtained with LSDI (right side) are relatively free of such artifacts.
Figure 3.
Single-shot EPI FA map with susceptibility related geometric distortions (yellow arrows) causing the increase of the signal intensity within the uncinate fasciculus (lower yellow arrow). Fractional anisotropy maps obtained with LSDI (right side) are relatively free of such artifacts.
DISCUSSION
Our data show that LSDI, when applied to the diffusion tensor data acquisition, can produce data with greater reproducibility and greater accuracy than single-shot diffusion-weighted EPI. While the mean FA for the five subjects between method comparison did not show significant differences, the single-shot diffusion-weighted EPI showed greater mean standard deviation of the FA measures for all but one of the measured brain regions. The increase in mean standard deviation could be because of an increased noise level of single-shot EPI diffusion-weighted images. Indeed SNR was 16% lower for the single-shot EPI diffusion-weighted images. However, we did not take into account that for the magnitude averaged EPI data, the background noise follows a Rician (12), rather than a Gaussian distribution. Noise in the FA maps is also determined by the SNR of the images obtained at low diffusion weighting. In our experiments, for single-shot diffusion-weighted EPI only one low diffusion-weighted image was obtained, while for LSDI two low diffusion-weighted images were averaged. Two low diffusion-weighted images were acquired to reduce the time-averaged gradient load. At low diffusion weighting, SNR is higher than at high diffusion weighting and, consequently, averaging of low diffusion-weighted image data is less effective in reducing the noise in FA maps than is averaging of high diffusion-weighted image data. Therefore, reducing the number of low diffusion-weighted images with LSDI would only have a minimal effect on the noise in the FA maps.
The increase in mean standard deviation was even more pronounced for the comparison across sessions, which was performed in one subject only. Because inter-subject variability plays a major role in statistical group comparisons (especially for small sample sizes, which was the case in the present study), we think that measurement of the same ROI over several sessions provides a better estimation of the method’s reproducibility. Moreover, because this comparison is not confounded by inter-subject variability as it was performed across time in the same subject, the associated error of the measurement likely more directly reflects the reproducibility differences between methods. Hence, our study shows that, in terms of the estimation of the mean FA for the group of subjects and for each region, both methods are comparable (mean FA for all scanned subjects did not differ significantly between methods for any ROI studied). However, when the same subject’s ROIs were measured over several sessions, there were significant differences in the mean FA estimation.
Regarding the across-sessions comparison (ie, one subject, four sessions), FA derived from single-shot diffusion-weighted EPI and LSDI showed statistically significant differences in the mean FA of two ROIs: the left uncinate fasciculus and the corpus callosum. The corpus callosum is the largest white matter fiber tract in the brain and consists of coherent, densely packed neuronal fibers. Furthermore, because FA fractional anisotropy is a measure that most likely reflects organization and thus coherence of the fibers for a given voxel, its values for the corpus callosum are expected to be relatively high. In addition, the corpus is a region easy to delineate and relatively homogenous on both structural scans and FA maps, thus all voxels belonging to this structure should be characterized by similar FA values. However, when the LSDI and single-shot diffusion-weighted EPI were compared for across-sessions measurements, FA within the corpus callosum exhibited a smaller standard deviation as well as higher values for LSDI. This finding is consistent with the fact that increased noise level in an isotropic tensor field will in general increase the anisotropy, while increased noise level in a very anisotropic field (corpus callosum would be an example of such a field) will decrease the anisotropy.
With respect to the uncinate fasciculus, this fiber tract is not as homogenous and coherent as the corpus callosum (11), thus the errors of the FA among the population of the voxels belonging to this structure should be larger than for the corpus. This region is also located within the temporal lobe, or temporal stem, an area sensitive to image distortions, which is common to single-shot EPI techniques. Our data showed that the FA values, although characterized again by smaller standard deviation for the LSDI than for the single-shot diffusion-weighted EPI, were actually higher for EPI than for LSDI. This phenomenon appears to be easily explained after careful inspection of the FA images. This inspection showed an increase of FA intensity within the uncinate fasciculus because of the single-shot EPI susceptibility related image distortions. These distortions can be, and were, corrected for in the post-processing steps; however, because only geometric distortions can be easily corrected, addressing intensity changes caused by the scanner is much harder, and often unsuccessful. Thus again, higher FA values, coupled with increased measurement error for single-shot EPI derived FA values within the uncinate fasciculus, appeared to be caused by susceptibility artifacts. In addition, as we stated before, the FA values can be decreased or increased by the elevated noise level, depending on the anisotropy properties of the tissue. Thus while in the highly organized, anisotropic corpus callosum, FA should be decreased by the elevated noise, it is possible that in the uncinate fasciculus, a fiber tract consisting of much less dense and coherent fiber bundles, FA values could, in fact, be increased because of the higher noise levels.
Also, for the other ROIs, including left uncinate fasciculus and bilateral internal capsules, the standard deviation comparison between methods among subjects (ie, five subjects), as well as among four sessions for one subject, showed significant differences (higher mean standard deviation for single-shot EPI than for LSDI). The only region that did not show between method differences for deviations associated with FA measures was the frontal gray matter. However, this region is characterized by low anisotropy, which is predominantly determined by the generally poor SNR of the diffusion-weighted images and thus the FA measurements in this area are less reliable.
As mentioned previously, scan time for LSDI was longer than for single-shot diffusion-weighted EPI. Increase of the number of signal averages should theoretically increase the signal-to-noise and thus decrease the error of the FA and ADC measurements. Therefore, an additional experiment was carried out where LSDI was compared with one, four, and 16 repetitions of single-shot EPI experiment. The scan time for single-shot diffusion-weighted EPI with 16 signal averages is approximately the same as for the LSDI with whole brain coverage and without signal averaging. Axial slices with otherwise the same parameters as in the main study were acquired. Both EPI and LSDI were interpolated to the same 256 × 192 image resolution. Images that show the improvement due to signal averaging can be seen in Figure 4. Means and standard deviations of FA for two different ROIs are reported in Table 3. As seen in Table 3, increasing the number of excitations from one to four and from four to 16 decreases the standard deviation of the FA measurements significantly. For the thalamus, it appears that the LSDI produces an FA measurement error similar to that which results from an EPI scan with four signal averages. However for the corpus callosum, in agreement with the findings presented in Tables 1 and 2, LSDI exhibited a smaller error than any of the EPI acquisitions explored. The measurements in the thalamus and the visual appearance of the FA maps (Fig 4) seem to suggest that LSDI is comparable to EPI with four signal averages. However, not only noise, but also image artifacts, which are less prominent in LSDI, may raise the measured FA standard deviation.
Figure 4.

Fractional anisotropy maps obtained with single-shot diffusion-weighted EPI with one, four, and 16 signal acquisitions (from left to right) and LSDI (right side). Note the significant distortions of the frontal brain on the EPI FA maps.
Table 3.
Comparison Between Fractional Anisotropy and its Standard Deviation Values Obtained with Line Scan Diffusion Imaging and 1, 4, and 16 Acquisitions of Single-Shot Echo Planar Imaging
| ROI | Single-Shot Diffusion-Weighted EPI (Single Acquisition) | Single-Shot Diffusion-Weighted EPI (4 Signal Averages) | Single-Shot Diffusion-Weighted EPI (16 Signal Averages) | LSDI (Single Acquisition) |
|---|---|---|---|---|
| Corpus callosum | 0.81 ± 0.082 | 0.82 ± 0.069 | 0.82 ± 0.052 | 0.83 ± 0.039 |
| Thalamus | 0.38 ± 0.109 | 0.32 ± 0.067 | 0.32 ± 0.047 | 0.33 ± 0.068 |
In addition, these results show that in areas where anisotropy is low, such as the thalamus, FA values at low SNR are particularly overestimated.
In general, noise associated with diffusion-weighted image data was likely the major contributor to the higher deviations associated with single-shot EPI FA measures in our study. Signal to noise ratio can be improved with the use of more averages. Thus increasing the number of averages would likely increase the reproducibility of single-shot diffusion-weighted EPI to the level achieved by LSDI. The number of averages, however, could only be increased at the expense of scan time, which would render the one important advantage of single-shot diffusion-weighted EPI over LSDI both less striking and less compelling. Moreover, this would have no effect on the potentially higher in-plane resolution and the lower image distortions afforded by the LSDI technique.
It is worthwhile to mention that in addition to the corpus callosum, the reliability of all other ROI boundaries of the discrete fiber tracts in our study could be affected by poor signal-to-noise and low resolution of the scans. The uncinate fasciculus, as well as, to a lesser extent, the internal capsule are much smaller and much less organized and coherent, and thus much more difficult to delineate than the corpus callosum. Thus the diffusion measures obtained in these regions are especially prone to noise-related errors, as well as partial volume effects and geometrical distortions, as discussed previously.
The potential advantage of LSDI over single-shot EPI, however, is the ability to minimize potential errors in ROI delineation by increasing image resolution and by decreasing slice thickness.
Image artifacts observed on the MRIs require separate attention. For example, susceptibility related geometric distortions and signal loss, as well as incongruent image geometries caused by eddy currents, can be minimized (but not removed) with appropriate scanner hardware, higher order shimming, eddy-current compensation, and image post-processing (13,14). On some of our diffusion-weighted single-shot EPI images, geometric distortions and areas of signal loss appeared to be quite extensive, in particular within the medial, inferior, and middle temporal gyri. Thus, in the cases where these regions are investigated, by either quantitative anisotropy measures or fiber tracking algorithms, LSDI seems to be particularly useful. This is of particular concern in studies of schizophrenia and Alzheimer’s disease, where temporal lobe abnormalities seem to play an important role (15). Segmented EPI with navigator echoes correction (16) or single-shot EPI with parallel imaging (17) permits a substantial reduction of image distortions. Segmented EPI with navigator echoes offers superior SNR but requires cardiac gating and is more susceptible to motion artifacts. Unfortunately, segmented EPI with navigator echoes was not available at our institution, therefore a comparison could not be performed. Single-shot EPI combined with parallel imaging results in lower SNR, which for a given SNR would reduce the scan time advantage of single-shot EPI over LSDI.
Additionally, fiber-tracking algorithms perform better at higher resolution and higher SNR. Recently, higher field magnets, which can address these limitations, have become routine for patient scans. However, the previously mentioned artifacts seen on single-shot diffusion-weighted EPI scans at 3 Tesla will be twice as large as those at 1.5 Tesla.
The most severe limitation of LSDI remains scan time. While single-shot diffusion-weighted whole brain EPI scans can be obtained in two or even three orientations within a single magnetic resonance imaging session, LSDI scans are too time consuming to perform more than one whole brain scan per subject. Double-line scan diffusion imaging (18) and slab scan diffusion imaging (19) are techniques based on LSDI that bridge the gap between LSDI and single-shot diffusion-weighted EPI by offering a shorter scan time at the expense of a slightly decreased SNR and moderately elevated image distortions. However, if time is not constrained, LSDI should be considered to obtain more accurate and precise results.
Acknowledgments
The authors would like to thank Marie Fairbanks for her administrative assistance.
Footnotes
Supported by the National Alliance for Research on Schizophrenia and Depression (M.K.), the National Institute of Health (grant nos. K02 MH 01110 and R01 MH 50747 to M.E.S., R01 MH 40799 to R.W.M., and R01 NS 39335 to S.E.M.), the Department of Veterans Affairs Merit Awards (M.E.S., R.W.M.) and the National Center for Research Resources (grant no. 11747 to R.K. and P41 1321 to F.A.J. and C.-F.W.).
References
- 1.Le Bihan D, Breton E, Lallemand D, Grenier P, Cabanis E, Laval-Jeantet M. MR imaging of intravoxel incoherent motions: application to diffusion and perfusion in neurologic disorders. Radiology. 1986;161:401–407. doi: 10.1148/radiology.161.2.3763909. [DOI] [PubMed] [Google Scholar]
- 2.Basser PJ, Mattiello J, Le Bihan D. MR diffusion tensor spectroscopy and imaging. Biophys J. 1994;66:259–267. doi: 10.1016/S0006-3495(94)80775-1. [DOI] [PMC free article] [PubMed] [Google Scholar]
- 3.Le Bihan D, Mangin JF, Poupon C, et al. Diffusion tensor imaging: concepts and applications. J Magn Reson Imaging. 2001;13:534–546. doi: 10.1002/jmri.1076. [DOI] [PubMed] [Google Scholar]
- 4.Kubicki M, Westin CF, Maier SE, et al. Diffusion tensor imaging and its application to neuropsychiatric disorders. Harv Rev Psychiatry. 2002;10:324–336. doi: 10.1080/10673220216231. [DOI] [PMC free article] [PubMed] [Google Scholar]
- 5.Turner R, Le Bihan D, Maier J, Vavrek R, Hedges LK, Pekar J. Echo-planar imaging of intravoxel incoherent motion. Radiology. 1990;177:407–414. doi: 10.1148/radiology.177.2.2217777. [DOI] [PubMed] [Google Scholar]
- 6.Gudbjartsson H, Maier SE, Mulkern RV. Line scan diffusion imaging. Magn Reson Med. 1996;36:509–519. doi: 10.1002/mrm.1910360403. [DOI] [PubMed] [Google Scholar]
- 7.Mamata H, Mamata Y, Westin CF, Shenton ME, Kikinis R, Jolesz FA, Maier SE. High-resolution line scan diffusion tensor MRI of white matter fiber tract anatomy. Am J Neuroradiol. 2002;23:67–75. [PMC free article] [PubMed] [Google Scholar]
- 8.Maier SE, Gudbjartsson H, Patz S, et al. Line scan diffusion imaging: Characterization in healthy subjects and stroke patients. AJR Am J Roentgenol. 1998;17:85–93. doi: 10.2214/ajr.171.1.9648769. [DOI] [PubMed] [Google Scholar]
- 9.Papadakis NG, Xing D, Houston GC, et al. A study of rotationally invariant and symmetric indices of diffusion anisotropy. Magn Reson Imaging. 1999;17:881–892. doi: 10.1016/s0730-725x(99)00029-6. [DOI] [PubMed] [Google Scholar]
- 10.Basser PJ, Pierpaoli C. Microstructural and physiological features of tissues elucidated by quantitative-diffusion-tensor MRI. J Magn Reson B. 1996;111:209–219. doi: 10.1006/jmrb.1996.0086. [DOI] [PubMed] [Google Scholar]
- 11.Kubicki M, Westin CF, Maier SE, et al. Uncinate fasciculus findings in schizophrenia: a magnetic resonance diffusion tensor imaging study. Am J Psychiatry. 2002;159:813–820. doi: 10.1176/appi.ajp.159.5.813. [DOI] [PMC free article] [PubMed] [Google Scholar]
- 12.Gudbjartsson H, Patz S. The Rician distribution of noisy MRI data. Magn Reson Med. 1995;34:910–914. doi: 10.1002/mrm.1910340618. [DOI] [PMC free article] [PubMed] [Google Scholar]
- 13.Schmithorst VJ, Dardzinski BJ, Holland SK. Simultaneous correction of ghost and geometric distortion artifacts in EPI using a multiecho reference scan. IEEE Trans Med Imaging. 2001;20:535–539. doi: 10.1109/42.929619. [DOI] [PMC free article] [PubMed] [Google Scholar]
- 14.Schmithorst VJ, Dardzinski BJ. Automatic gradient preemphasis adjustment: a 15-minute journey to improved diffusion-weighted echo-planar imaging. Magn Reson Med. 2002;47:208–212. doi: 10.1002/mrm.10022. [DOI] [PubMed] [Google Scholar]
- 15.Shenton ME, Dickey CC, Frumin M, McCarley RW. A review of MRI findings in schizophrenia. Schizophr Res. 2001;49:1–52. doi: 10.1016/s0920-9964(01)00163-3. [DOI] [PMC free article] [PubMed] [Google Scholar]
- 16.Ordidge RJ, Helpern JA, Qing ZX, Knight RA, Nagesh V. Correction of motional artifacts in diffusion-weighted MR images using navigator echoes. Magn Reson Imaging. 1994;12:455–460. doi: 10.1016/0730-725x(94)92539-9. [DOI] [PubMed] [Google Scholar]
- 17.Bammer R, Auer M, Keeling SL, et al. Diffusion tensor imaging using single-shot SENSE-EPI. Magn Reson Med. 2002;48:128–136. doi: 10.1002/mrm.10184. [DOI] [PubMed] [Google Scholar]
- 18.Gudbjartsson H, Maier SE, Jolesz FA. Double line scan diffusion imaging. Magn Reson Med. 1997;38:101–109. doi: 10.1002/mrm.1910380115. [DOI] [PubMed] [Google Scholar]
- 19.Maier SE. Slab scan diffusion imaging. Magn Reson Med. 2001;46:1136–1143. doi: 10.1002/mrm.1310. [DOI] [PubMed] [Google Scholar]