

INTRODUCTION
The profuse deposition of amyloid fibrils in the parenchymal and vascular extracellular spaces of the cerebral cortex and leptomeningeal vessels is one of the hallmark lesions of Alzheimer’s disease (AD). Fibrillar, compact deposits composed of amyloid-β (Aβ) and exhibiting extensive Congo red/thioflavin S staining concentrate at the center of the senile plaques or accumulate around cerebral blood vessels. In addition to compact plaques, typically surrounded by dystrophic neurites, activated microglia and reactive astrocytes, most Alzheimer brains contain amorphous and less dense deposits which are commonly referred to as "diffuse" or "preamyloid" plaques [reviewed in (1, 2)] (Figure 1). Under electron microscopy, these diffuse lesions – negative under Congo red or thioflavin S staining– display very few, if any, structurally altered neurites, astrocytes, or microglial cells, and in spite of their immunoreactivity with anti-amyloid antibodies, fibrillar components are very sparse or absent.
Figure 1.
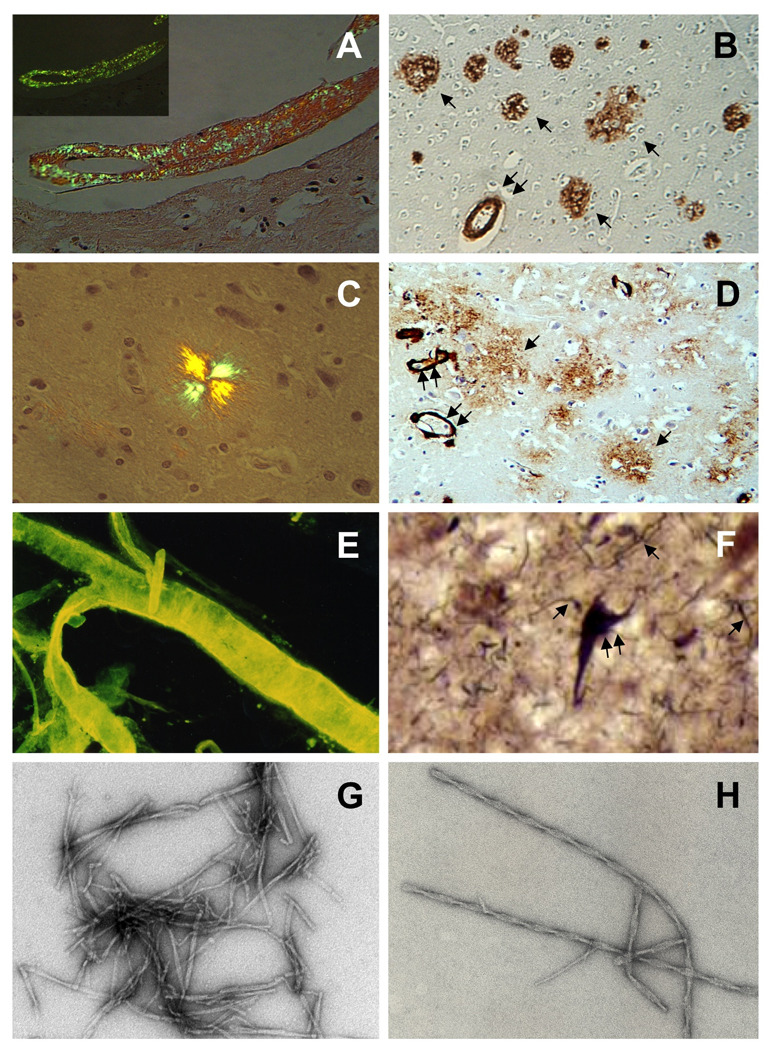
Microscopic examination of fibrillar deposits in Alzheimer’s disease. Panel A: Vascular amyloid deposits in a medium size leptomeningeal artery visualized by polarized microscopy after Congo red staining. Note the change in color from red to apple green (inset) when the light is polarized (X 100). Panel B: Imunohistochemical detection of parenchymal amyloid plaques (arrow) and cerebrovascular Aβ lesions (double arrow) through the use of specific anti-Aβ antibodies (X 100). Panel C: Typical maltese cross aspect of a parenchymal plaque stained with Congo red and visualized by polarized microscopy (× 400). Panel D: Parenchymal pre-amyloid lesions (arrows) and vascular deposits (double arrow) stained with anti-Aβ antibodies as in panel B (× 100). Panel E: Leptomeningeal amyloid deposits in an isolated vessel observed under fluorescence microscopy after thioflavin S staining (× 100). Panel F: Neurofibrillary tangles (double arrow) and dystrophic neurites (arrows) are visualized by Bielschowsky silver impregnation (× 1000). Panels G and H: Electron microscopy images of amyloid fibrils (G) and PHF (H) obtained after negative staining with uranyl acetate (× 110,000).
The presence of neurofibrillary tangles (NFTs), another histopathological trademark of AD, was described by Alzheimer himself in affected limbic and cerebral cortices via light microscopic evaluation following silver tissue impregnation by the Bielschowsky method (Figure 1). Tangles are composed by building blocks of aberrantly phosphorylated species of the microtubule associated protein tau which accumulate in the perinuclear cytoplasm of selected neurons in the form of paired, helically-wound filaments (PHF) (3, 4).
The biochemical characterization of both, amyloid deposits and NFTs, initially hampered by their poor solubility properties, revealed high degree of molecular heterogeneity and enrichment in post-translationally-modified species. Due to their tissue localization and fibrillar configuration, protocols developed to isolate and purify amyloid fibrils and PHF primarily relied on physical methodologies (homogenization, filtration, standard and gradient centrifugation, FACS analysis) whereas improvements in solubilization were based on the use of detergents (SDS, sarkosyl), chaotropes (guanidine-HCl, guanidine-SCN, urea) or concentrated formic acid. Below we describe different combinations of these approaches that has been successfully implemented in numerous laboratories (5–10).
Tissue source for the isolation of amyloid and PHF
The isolation of amyloid and PHF requires the use of frozen brain tissue obtained at autopsy from AD patients with short post-mortem delay, preferable 4–8h (ideally <2–4h) to minimize the mostly enzymatically-driven protein modifications occurring after death. The magnitude of the neuropathological lesions is highly variable not only among different AD cases but also among different regions of the same brain, making it necessary to select specimens with abundant AD-related pathology, as assessed by histopathological standard protocols (11), to assure a high yield of purified amyloid and/or PHF. In general, most published protocols perform extractions from cortical regions after gross dissection of the gray matter, since plaques and NFTs are typically absent from the white matter (12, 13).
AMYLOID/PRE-AMYLOID PURIFICATION
PROTOCOL 1: Extraction and solubilization of amyloid and pre-amyloid deposits for subsequent biochemical and mass-spectrometry studies
The following extraction strategy takes advantage of the differential solubility properties of pre-amyloid, usually poorly soluble in water-based solutions but extractable with SDS-containing buffers, in comparison with fibrillar amyloid structures –highly insoluble under both prior conditions but able to be solubilized by treatment with 70–99% formic acid. This differential-solubility-based protocol for the extraction of amyloid and pre-amyloid materials has been widely used for the subsequent biochemical analysis of the Aβ species composing the lesions, typically by amino acid sequence analysis and more recently by a combination of immunoprecipitation and mass spectrometry. The latter is an extremely sensitive methodology, and has allowed the further identification of numerous truncated and post-translationally modified Aβ species as components of the deposits (10, 14).
Materials
Frozen brain tissue
Phosphate Buffered Saline (PBS): 10 mM phosphate buffer, pH 7.4, containing 2.7 mM KCl and 137 mM NaCl. Dissolve one tablet of Phosphate Buffered Saline (Sigma) in 200 ml of deionized water. Scale up as needed
2 % SDS in PBS: prepared by diluting 1:5 a commercially available 10% SDS solution (BioRad) in 20 mM Tris, pH 7.4
70 % formic acid: prepared by diluting 99% formic acid (Sigma) with de-ionized water
Protease inhibitors cocktail (Complete, Roche Applied Science, Indianapolis, IN), prepared in accordance to the manufacturer’s specifications
Dissecting instruments
Dounce glass homogenizer
25-ml polycarbonate tubes (Beckman)
300- and 70-µm Spectra/Mesh nylon filters (Spectrum Laboratories, Inc.; Rancho Dominguez, CA)
XL100K ultracentrifuge (Beckman Coulter, Fullerton, CA) equipped with a Beckman 70.1 Ti rotor, or equivalent
5417 microcentrifuge (Eppendorf, Westbury, NY), or equivalent
Detailed protocol (Figure 2)
Figure 2.
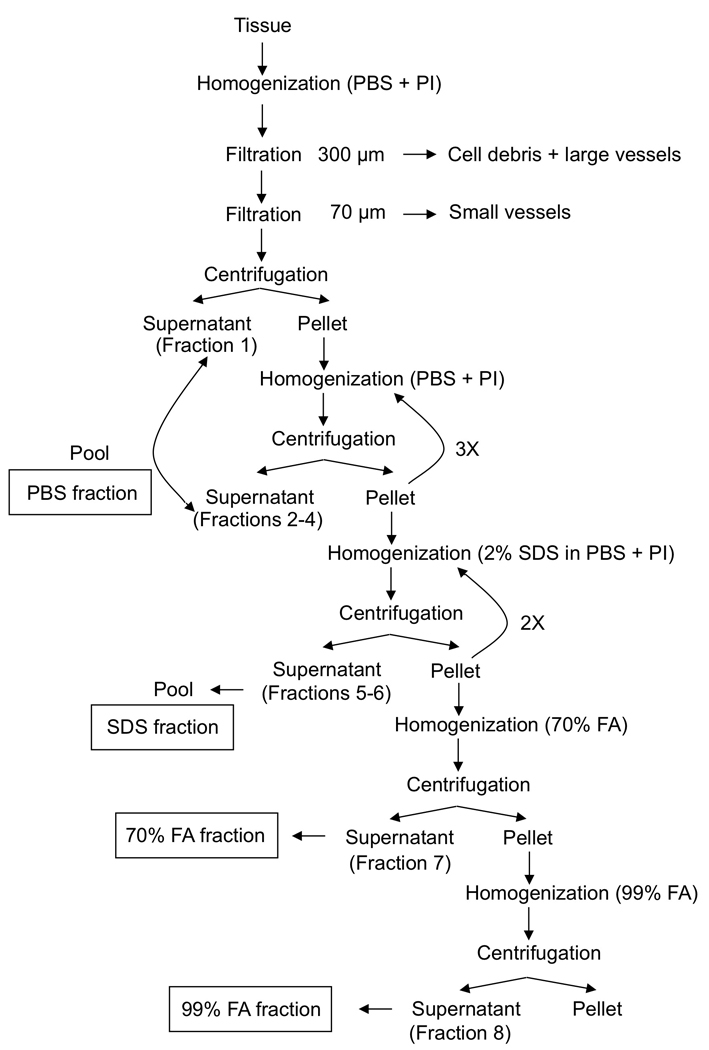
Schematic representation of the sequential extraction of pre-amyloid and amyloid species for subsequent biochemical and mass spectrometry studies, as described in Protocol 1.
-
Remove leptomeninges and large blood vessels. Separate gray from white matter with the aid of dissecting tools (scalpel, tweezers, small spatula). Finely mince the gray matter (~2.5 g) with a razor blade, add 12.5 ml of ice-cold PBS containing 2× protease inhibitor cocktail and homogenize in a Dounce glass homogenizer immersed in ice until no large pieces are visible
NOTE: All solutions should be ice-cold and procedures should be carried out on ice or inside a 4°C-cold room. A useful alternative to the Dounce glass homogenizer, particularly when many samples are processed at once, is the use of a mechanical homogenizer equipped with disposable probes for soft tissues (e.g. Omni International, Marietta, GA).
-
After homogenization, eliminate tissue debris via filtration through a 300 µm mesh nylon filter followed by subsequent removal of small vessels by filtration through a 70 µm nylon mesh; the vessel fraction may be reserved for further analysis of vascular amyloid (see Protocol 3). Subject the filtrate of the 70 µm-filter to ultracentrifugation in a XL100K ultracentrifuge (Beckman Coulter) with a Beckman 70.1 Ti rotor at 112,000 ×g for 1h at 4°C and save the PBS-extracted supernatant enriched in soluble Aβ species for further analysis.
NOTE: PBS supernatant typically contains soluble brain proteins and a minor proportion of soluble Aβ species (primarily monomers/dimers). To assure removal of undesirable water-soluble proteins and extract most of the soluble Aβ, the homogenization/centrifugation step should be repeated at least three more times and the resulting supernatants combined and analyzed as the PBS fraction.
-
Re-suspend the PBS-insoluble pellet, containing amyloid and pre-amyloid materials, in 12.5 ml of 20 mM Tris, pH 7.4 containing 2% SDS.
NOTE: Before the addition of the SDS-containing buffer the samples should be brought at 10°C to avoid SDS crystallization
-
Ultracentrifuge samples at 112,000 × g for 1h at 10°C, as above, and save the SDS-extracted supernatant rich in pre-amyloid species for further analysis.
NOTE: Depending on the pre-amyloid load of the specimen, steps 3–4 should be repeated 2–3 times not only to increase pre-amyloid yield in the SDS-extracts but to minimize contamination of the fibrillar amyloid to be extracted in step 5.
-
Re-suspend the pellet in 1ml 70% formic acid, vortex for 2 min. and centrifuge at 14,000 rpm in a 5417 microcentrifuge (Eppendorf, Westbury, NY) for 15 min at 4°C. The resulting supernatant (70% FA fraction) contains solubilized amyloid-rich fraction for further analysis.
NOTE: Depending on the load of dense plaques in the specimen, it might be necessary to add an additional extraction (step 6) using 99% FA to maximize the yield of solubilized amyloid. Use the initial immunohistochemical analysis to assess compact plaque density.
-
Re-suspend the remaining pellet in 1ml 99% formic acid, vortex for 2 min. and spin-down at 14,000 rpm in a 5417 microcentrifuge for 15 min at 4°C, as above. The resulting supernatant (99% FA fraction) also contains solubilized amyloid-rich fraction for further analysis.
NOTE: Regardless of the compact plaque density, proceed with step 6 if the pellet after step 5 is still significant. Typically, after 99% FA the remaining pellet is minimal or not existent.
PROTOCOL 2: Extraction of amyloid fibrils and plaque cores
The isolation of amyloid plaque cores from homogenized gray matter tissue from AD cases (see Protocol 1, steps 1 and 2) primarily rely on gradient density centrifugation. The most commonly used are discontinued sucrose gradients (5, 6, 15, 16), although Ficoll density gradients have also been successfully used (9).
Materials
Frozen brain tissue
Protease inhibitors cocktail (Complete) prepared in accordance to the manufacturer’s specifications
Tissue homogenization buffer: 50 mM Tris, pH 7.6 buffer containing 0.1 M β-mercaptoethanol, 2% SDS, and protease inhibitors.
Sucrose (Sigma)
Dounce glass homogenizer
300µm, 70µm and 35 µm Spectra/Mesh nylon filters (Spectrum Laboratories, Inc.; Rancho Dominguez, CA)
Ultra-clear tubes (14 × 95mm; Beckman)
Ultracentrifuge XL100K (Beckman Coulter, Fullerton, CA) equipped with 70.1 and SW40 Ti rotors, or equivalent
Detailed protocol (Figure 3)
Figure 3.
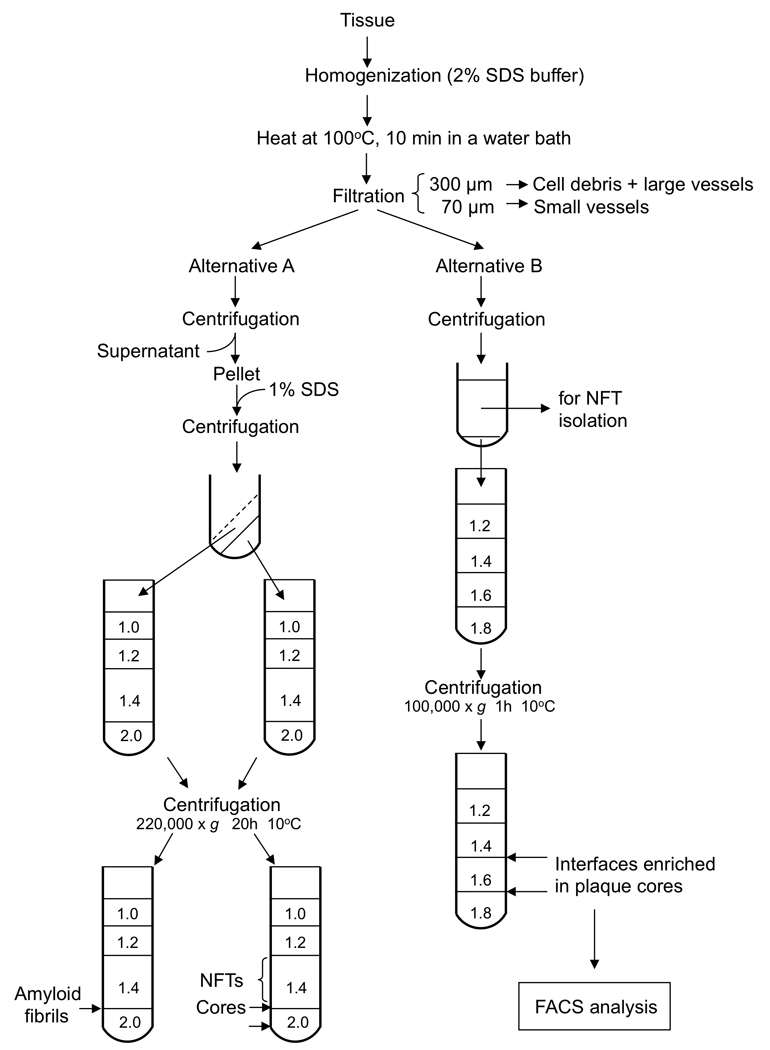
Schematic representation of the extraction procedure of amyloid fibrils and plaque cores, as described in Protocol 2.
Preparation of the tissue sample
Select cerebral cortex rich in dense plaque cores assessed by standard immunohistochemical analysis of the AD brain specimen, remove leptomeninges and large blood vessels and dissect gray matter as in Protocol 1.
-
Add homogenization buffer containing protease inhibitors to the dissected tissue at a 1:1 (wt/vol) ratio and homogenize at 4°C in a Dounce glass homogenizer.
NOTE: A mechanical homogenizer equipped with disposable probes for soft tissues (e.g. Omni International, Marietta, GA) provides a useful alternative to the Dounce glass homogenizer.
Heat the mixture at 100°C for 10 min in a water bath.
Sieve the homogenate through sequential nylon-meshes (300µm and 70µm) as in Protocol 1 to remove debris and blood vessels.
-
Centrifuge at 100,000 × g for 1 h at 10°C using a Beckman XL100K ultracentrifuge and a 70.1 Ti rotor.
NOTE: Depending on the number of samples and the starting material a 50.2 Ti rotor may be used to handle larger volumes or number of fractions.
Resuspend the pellet in the same buffer, this time containing 1% SDS and repeat the centrifugation of step 5. The resulting pellet will be composed of two well-defined layers that can be easily separated with the aid of a Pasteur pipette and the addition of homogenization buffer containing 1% SDS (ratio buffer to pellet of 2:1): an upper beige fluffy layer and a lower dark-brown hard layer. Each layer will be used separately for further purification.
-
Load each layer separately onto a discontinuous sucrose gradient (1.0 – 1.2 – 1.4 – 2.0M sucrose in 50 mM Tris pH 7.6 containing 1% SDS)
NOTE: Layering of the sucrose solutions should be carefully performed with the aid of a Pasteur pipette and without disturbing the bottom layer. The tube should be kept at eye-level and observed against a light-source to allow visualization of the interfaces created by the different density levels of the various sucrose solutions. Start with 2 ml of the 2.0 M solution at the bottom of the tube. Sequentially, layer carefully 3 ml of the 1.4 M solution followed by 2 ml of the 1.2 M and 2ml of the 1.0 M sucrose solution. Finally, load 2.3 ml of the resuspended layer on the top of the sucrose gradient.
-
Centrifuge at 220,000 × g for 20 h at 10°C in a Beckman XL100K ultracentrifuge using a SW 40 Ti rotor.
NOTE: The resulting interfaces and layers are easily visualized with indirect light against a dark background. Removal of each fraction can be achieved with the aid of a Pasteur pipette.
The 1.4/2.0 interface obtained from the upper beige fluffy layer in step 6 is highly enriched in amyloid fibrils whereas the same 1.4/2.0 interface from the dark-brown layer in step 6 contains mainly amyloid cores and some loose fibrils (Figure 2). The 1.4 sucrose layer from the latter is enriched in PHF and could be saved for further purification.
Resuspend the 1.4/2.0 interface fractions containing either fibrils or a mixture of fibrils and cores in distilled water and centrifuge at 100,000 × g for 1 h at 4°C.
Confirm the presence of fibrillar-amyloid-rich structures by light microscopy after Congo Red staining, fluorescence microscopy following Thioflavin S staining, or by electron microscopy after negative staining with uranyl acetate (5, 17) [see below for detailed description of these protocols]. Purified amyloid fractions may be stored at −80°C until use.
PROTOCOL 3: Extraction of amyloid from leptmeningeal vessels and microvessels
The presence of cerebrovascular amyloid is a common finding in AD and other vascular dementias [reviewed in (2)]. Interestingly, and driven by mechanisms still to be elucidated, there is not a completely homogeneous distribution of Aβ species between parenchymal and vascular AD deposits. While Aβ peptides ending at position 42 are found predominantly associated with parenchymal plaques, vessel-associated components are highly enriched in Aβ species ending at residue 40. Therefore, when a precise biochemical analysis of the vascular amyloid components is required, vessels need to be isolated prior to amyloid extraction. Sometimes the degree of amyloid load in leptomeningeal vessels is so overwhelming that just the dissection of few large vessels provides enough material for biochemical studies. When leptomeninges are either not available or the leptomeningeal involvement is minimal, a thorough isolation of brain microvessels is mandatory. A detailed protocol follows:
Materials
Tissue Homogeneization Buffer (THB) : 15 mM HEPES, pH 7.4, 103 mM NaCl, 4.7 mM KCl, 2.5 mM CaCl2, 1.2 mM KHPO4, 25 mM NaHCO3, 10 mM glucose, 10 IU/ml heparin
26% (w:v) dextran (Mw 65,000–85,000) in THB
Percoll (Sigma)
Protease Inhibitor cocktail (Complete, Roche Applied Science, Indiana, IN)
350-, 150-, and 70-µm nylon mesh filters
Dounce glass homogenizer
XL100K ultracentrifuge (Beckman Coulter, Fullerton, CA) equipped with a Beckman 70.1 Ti rotor, or equivalent
5417 microcentrifuge (Eppendorf, Westbury, NY), or equivalent
Detailed protocol (18, 19)
-
Dissect cortical tissue (typically from frontal lobe of affected individuals) from leptomeningeal vessels.
NOTE: Not all sporadic AD cases present with the same level of vascular involvement and, in some cases, amyloid is mainly restricted to parenchymal distribution. Therefore, to obtain a high yield in the extraction of vascular amyloid, it is indispensable to verify the magnitude of the vascular deposits by immunohistochemistry, as described above, prior to the start of the isolation procedure.
For the isolation of amyloid from leptomeningeal vessels, skip steps 2–5. The leptomeningeal fractions obtained at step 1 of protocols 1, 2 and 3 can be used for the isolation.
Homogenize cortical tissue devoid of leptomeninges in 5 volumes of ice-cold THB containing protease inhibitor cocktail (see Protocol 1) using a Dounce glass homogenizer immersed on ice.
Add an equal volume of a 26% dextran solution prepared dissolving dextran of 65,000–85,000 molecular weight in THB, and homogenize.
Centrifuge at 5,800 × g for 15 min at 4 °C in an Eppendorf 5417 microcentrifuge (or similar).
-
Resuspend the pellet in 10 volumes of THB and sieved sequentially through 350-, 150-, and 70-µm nylon meshes.
NOTE: From this point onwards, microvessel fractions obtained either at step 2 in Protocol 1 or step 4 in protocol 2 can be also used in the purification procedure.
Collect the material that remained on top of the 150- and 70-µm meshes by inverting the filters and washing them with a stream of ice-cold THB.
Pellet these fractions at 1,000 × g for 10 min in the Eppendorf refrigerated centrifuge.
Resuspend in 1–2 ml in THB and load on top of a preformed Percoll gradient (50% in THB, pre-generated by centrifugation at 27,000 × g for 1 h in accordance to the manufacturer’s instructions).
Centrifuge at 1,000 × g for 10 min, collect the middle white layer, and repeat the centrifugation on the Percoll gradient one more time.
-
Combine the vessel fractions, homogenize and proceed to sequential extraction with SDS and formic acid, essentially as described in Protocol 1.
NOTE: At this point many published protocols insert an extra step in which collagenase (1:20 to 1:50 enzyme:extract ratio) is added to the vessel preparation in order to degrade the collagen matrix and release the fibrils from the deposits, therefore increasing the yield of amyloid in the extracts (9, 20). However, keep in mind that collagenase also degrades Aβ generating proteolytic fragments that are not usually present in the deposits. If the operator is interested in the assessment of all Aβ species present in the various lesions, the use of collagenase should be avoided.
PROTOCOL 4: Plaque Isolation by Laser Capture Microdissection
Traditional biochemical methods like the ones described above have nevertheless certain limitations since they fail to achieve the isolation of plaques to homogeneity. These restrictions were recently overcome with the advent of laser capture microdissection (LCM) methodology allowing the collection of microscopic regions as small as 3–5 µm in diameter (23). It is possible to use LCM to capture neuropathological structures (e.g. plaques) with high purity, but the amount of samples collected by this methodology is often limited, complicating the subsequent analysis. The recent development of highly sensitive proteomic technologies like liquid chromatography combined with tandem mass spectrometry (LC-MS/MS), which can directly analyze thousands of proteins from complex protein samples with sensitivity levels in the low femtomolar range, have made possible the successful use of LCM-obtained samples (21, 22).
Materials
Cryostat mounting Media (Tissue-Tek O.C.T.; Jed Pella Inc., Redding, CA)
Thioflavin S (Sigma, St Louis, MO)
Graded ethanol solutions: 50-, 95-, and 100%
2-methylbutane (FisherScientific)
CapSure Macro LCM cap (Arcturus, Mountain View, CA)
HM500OM cryotome (MICROM International, Walldorf, Germany), or equivalent
Fluorescence microscope equipped with a Pixcell II laser capture device (Arcturus, Mountain View, CA), or similar
Detailed Protocol
Preparation of tissue
Embed fresh postmortem blocks of frontal and/or temporal cortex obtained at autopsy from neuropathologically diagnosed AD cases in cryostat mounting medium to allow for the cryopreservation of the tissue architecture.
Freeze on dry-ice-cold 2-methylbutane, and store at −80°C until sectioning.
-
Prepare 10 µm tissue sections in a HM500OM cryotome or equivalent.
NOTE: Laser capture microscopy may be conducted on tissue sections ranging from 5–10 µm thickness, too thin a section may prevent complete removal of Aβ plaques with concomitant loss of material, whereas too thick a section may result in the acquisition of contaminating excess material.
Mount the cryosections on uncoated and uncharged glass slides, and thaw at room temperature.
-
Briefly fix sections for 1 min with 75% ethanol to histologically preserve the section while maintaining the quality of macromolecules for subsequent proteomic profiling.
NOTE: despite being considered the “gold standard” for histopathological preservation, the use of aldehyde-based fixatives (e.g., formalin) should be avoided, because the high level of covalently crosslinked proteins typically observed with such fixation is incompatible with current proteomic analysis protocols (22, 23)
Visualize Aβ plaques by staining for 1 min with 1% thioflavin-S in deionized water.
Differentiate by removing excess thioflavin S by incubation in 75% ethanol for 1 min.
Dehydrate in graded alcohols (50%, 95%, and 100%, 5 min each), clear for 5 min in fresh xylene, air-dry for 5 min, and desiccate sections before LCM.
Laser capture microdissection (21)
-
9
LCM is performed the same day the cryosections are stained with thioflavin S and desiccated as above (steps 6–8). The procedure is carried out in a fluorescence microscope attached to a Pixcell II laser capture device (Arcturus, Mountain View, CA) with the following settings: excitation wavelength, 495 nm; laser power, 60–80 milliwatts; duration, 1 ms; laser spot size, 7.5µm.
-
10
Collect about 500–2000 amyloid plaques from the tissue sections. The number of plaques dissected depends on the sensitivity of the analytical procedure to follow. A total of 2000 allowed the complete proteomic analysis of plaque components with the individualization of >400 constituents of the amyloid deposits (21).
-
11
Capture a similar number of spots in non-plaque areas as control tissue.
NOTE: Each CapSure Macro LCM cap (Arcturus, Mountain View, CA) is used for the capture of about 500 plaques or control tissue spots from one slide.
-
12
Microdissected samples may be subsequently employed for mass spectrometry analysis. Typically, Quadrupole Time-of-Flight mass spectrometry and Liquid Chromatography coupled with ion trap tandem mass spectrometry (LC-MS/MS) are the most sensitive and widely used methodologies. Due to the sophisticated equipment and specific methodology involved in these analyses, readers should refer to specially dedicated reviews in the field (22, 24).
MICROSCOPIC DETECTION OF AMYLOID
Congo red staining
Staining with Congo red in association with polarization microscopy is the most universally used methodology for the demonstration of amyloid in tissue specimens. The procedure is sensitive and simple to perform, factors that have contributed to its incorporation to routine staining panels in pathological examinations. In order to be reliable, not only must the staining be performed under well-controlled conditions but tissue examination and staining evaluation require experienced operators using appropriate microscopy equipment and filters for polarization.
Materials
Congo red (Sigma)
1 M NaOH
Whatman #1 filter paper
Super Pap Pen (Invitrogen)
80% (v/v) ethanol
Procedure
Preparation of the Congo red solution
Prepare 100 ml of a 1% (w:v) Congo Red solution in 80% ethanol
Stir at room temperature for 1h
Add 1 ml 1M NaOH
Filter through Whatman #1 filter paper
Fixation and staining of the isolated amyloid-fractions
-
5
Spot 5–10 µl of the resuspended fractions to be checked for the presence of fibrillar amyloid materials on a positively charged microscope slide (Fisher Scientific)
-
6
Air dry for 30 min
-
7
Circle the area of the dry drop with Super Pap Pen (Invitrogen)
NOTE: Circling the pertinent areas with Pap Pen prior to histological or immunohistochemical procedures creates a water repellent circle around the section preventing the waste of valuable reagents and at the same time assuring that the staining solution remains in contact with the section during the staining procedure. The chemistry involved is formulated to withstand alcohol treatment.
-
8
Fix the material by incubation with 4% paraformaldehyde (v:v in PBS) for 10 min at room temperature.
-
9
Rinse with deionized water and air dry.
-
10
Stain for 30 min at room temperature with the Congo red solution prepared in step 4.
-
11
Rinse briefly (about 10 sec) in 80 % ethanol, and air dry.
-
12
Observe by polarization microscopy in an Olympus BX60 microscope equipped with crossed polarizers, or equivalent. Polarized light is a contrast-enhancing technique that improves the quality of the image obtained with birefringent materials. Under these conditions amyloid shows a bright green birefringence, often referred to as "apple green birefringence" (see Figure 1).
NOTE: For polarization analysis the microscope must be equipped with both a polarizer, positioned in the light path before the specimen, and an analyzer (a second polarizer) placed in the optical pathway between the objective rear aperture and the observation tubes. Image contrast arises from the interaction of plane-polarized light with a birefringent (or doubly-refracting) specimen to produce two individual wave components that are each polarized in mutually perpendicular planes (25). After exiting the specimen, the light components become out of phase, but are recombined with constructive and destructive interference when they pass through the analyzer.
Thioflavin S staining
Thioflavin S and thioflavin T are sulfur-containing compounds that bind to amyloid fibrils being the latter mostly used in spectrofluorometric studies while the former is preferably employed in histological protocols. Thioflavin staining is currently very popular for amyloid studies, not only for the detection of amyloid in tissue sections, but also for the study of fibril formation in vitro. The staining is easy to perform, but the requirement of fluorescence microscopy creates limitations for some non-fully equipped facilities.
Materials
4 % paraformaldehyde in PBS
Thioflavin S (Sigma)
80% (v/v) ethanol
Mounting media for fluorescence microscopy (Vector Laboratories, Inc., Burlingame, CA)
Olympus BX60 epi-fluorescence microscope or equivalent
Procedure
-
Fix the isolated amyloid fractions to be analyzed with 4 % paraformaldehyde for 10 min at room temperature following the steps 5–9 of the fixation procedure for Congo red staining.
NOTE: The type of fixation procedure is not critical; different available methodologies are compatibles with the immunofluorescence staining
-
Incubate sections in 1% (w/v) thioflavin S in distilled water for 5–10 min
NOTE: It is recommended that a new solution is freshly prepared the day of use and maintained protected from light [e. g. in amber-color, or aluminum-foil-covered containers]. Incubation of slides with thioflavin must also be performed in the absence of light.
-
Differentiate in 80% (v/v) ethanol to remove excess fluorochrome and facilitate visualization.
Mount with fluorescence microscopy mounting media (Vector Laboratories, Inc., o r equivalent).
Visualize in an Olympus BX60 or comparable fluorescence microscope, equipped for evaluation of green fluorescence [excitation 495 nm/emission 519 nm] (see Figure 1).
Electron microscopy
Electron microscopy (EM), with a resolution of approximately 2 nm, offers a useful technique for the ultrastructural characterization of proto-filaments, and mature fibrils formed during in vitro fibrillogenesis. The method constitutes also an invaluable tool to follow-up the isolation of amyloid plaque material described above. For contrast enhancement of specimens, the samples to be evaluated are typically subjected to negative staining techniques (5, 26).
It is beyond the scope of this unit to describe the preparation of EM-grids and the use of the EM. Below is a description of the procedure to load the samples on the grid and perform the negative staining.
Materials
300 mesh, electron microscope cooper or nickel grids (Canemco & Marivac, Quebec, Canada)
1% uranyl acetate, pH 6.0 (Electron microscopy grade, Spi-Chem, West Chester, PA)
Milli-Q water (Purified water with resistivity values at 25 °C <18.2 Mho/cm)
CM12 Philips Transmission Electron Microscope or equivalent
Procedure
Apply 5 µl of the sample to be analyzed (e. g. a suspension of the washed pellet containing the amyloid fraction isolated from the sucrose gradient) on Formvar-carbon-coated, copper or nickel, 300 mesh, electron microscope grids (Canemco & Marivac, Quebec, Canada) and let stand for approximately 2 min.
Gently rinse with sterile milli-Q filtered water
-
Add 5 µl of freshly prepared aqueous (milli-Q filtered water) 1% (w/v) uranyl acetate, pH 6.0 (Electron microscopy grade, Spi-Chem, West Chester, PA) and incubate for 15–20 sec for negative-contrast stain
NOTE: Uranyl salts are both toxic and radioactive (low intensity emitter of α-particles). Follow general safety precautions for handling radioactive compounds and dispose of contaminated waste in accordance with Institutional Policies.
-
Blot dry with a strip of filter paper until the last drop is drained off, leaving only a thin film on the grid, and air-dry.
NOTE: The stained grids can be stored at room temperature without adverse effects
Evaluate amyloid fibrillar structures by transmission electron microscopy on a CM12 Philips Transmission Electron Microscope, or equivalent. Electron microscopy requires specialized equipment, handled by experienced-operators and it is typically performed at dedicated facilities. For detailed description of microscope operation, image capture and evaluation consult dedicated reviews (17, 27)
BIOCHEMICAL ANALYSIS OF AMYLOID IN THE BRAIN EXTRACTS
Immunoprecipitation of amyloid and pre-amyloid extracted fractions
Immunoprecipitation is a widely used methodology to enrich a preparation in a given protein, allowing subsequent elution of the precipitated protein and further analysis by gel electrophoresis, mass spectrometry, western blotting, amino acid sequence analysis or any other method for identifying protein constituents in a sample. Different methods are available for the immobilization of the formed antigen-antibody complex, among them those based on its capture by immobilized Protein A or Protein G. More recently new methods have been developed based on the use of paramagnetic beads pre-coated with secondary antibodies which can be easily immunoreacted with the desired primary antibodies. After immunoprecipitation and following respective washes, paramagnetic beads are rapidly and efficiently collected with the aid of a magnet yielding high recoveries.
Materials
Paramagnetic beads coated with goat anti-mouse IgG (Dynabeads M-280, Dynal/Invitrogen)
Eppendorf tube-rack equipped with a removable slide-out magnet (Dynal MPC-S)
4G8 and 6E10 monoclonal anti Aβ antibodies (Covance, Princeton, NJ)
Phosphate buffered saline (PBS)
Blocking buffer: PBS containing 0.1% (w:v) Bovine Serum Albumin (BSA, Sigma)
0.5 M Tris-base, pH 11.0
SDS-OUT (Pierce Biotechnology, Inc., Rockford, IL)
Milli-Q water (Purified water with resistivity values at 25 °C <18.2 Mho/cm)
Micro-reverse-phase chromatography tips (Zip-Tip C18, Millipore Corp., Billerica, MA)
Mini labRoller bi-directional rotator (Labnet International; Woodbridge, NJ)
Savant SpeedVac concentrator (Global Medical Instrumentation, Inc.; Ramsey, MN)
Detailed Procedure
Coating paramagnetic beads with anti-Aβ antibodies
-
Resuspend the mouse-IgG-coated paramagnetic beads by inverting several times the vial. Tranfer 50 µl of the suspension to a 1.5 ml-Eppendorf tube and position the tube in the rack equipped with a removable slide-out magnet.
NOTE: It is very important the use of specially designed racks which are equipped with potent magnets allowing the compacting of the beads at the bottom of the tube for volumes of 0.5 µl – 2 ml. The strong magnetic field permits total recovery of the beads without losses of material in the subsequent steps of the immunoprecipitation.
-
Wash the beads 3-times with 1 ml PBS.
NOTE: For washing, remove the tube from the magnetic rack, add the PBS, resuspend by inverting the tube, position it back in the magnet-equipped rack, and remove the supernatant after beads have compacted down.
-
Incubate pelleted beads with 3 µg each of anti-Aβ 4G8 and 6E10 overnight, at 4°C with bi -directional rotation in a Mini labRoller rotator (Labnet International) or equivalent in a final volume of 100 µl.
NOTE: Coating with primary antibodies is also successfully performed by incubation for 2–3 hrs at room temperature. The proportions shown above are enough for one immunoprecipitation; if more samples are to be processed, the protocol should be scaled up accordingly.
Collect the beads by placing the tube on the magnet rack for 2 min; remove and discard the supernatant.
-
Block the beads by resuspension in 1 ml PBS containing 0.1% BSA and subsequent 3-time-washes with the same solution
NOTE: Blocked-beads can now be safely stored at 4°C; otherwise, procceed with the immunoprecipitation steps below.
Immunoprecipitation
-
6
Pre-treatment of the brain extracts: Prior to incubation with the anti-Aβ coated beads, brain extracts require pre-treatment conditions to allow for a successful immunoprecipitation. SDS-extracts should be treated with SDS-OUT reagent, following the manufacturer’s instructions to eliminate SDS. Formic acid extracts require neutralization using 0.5 M Tris-base pH 11 (10).
NOTE: Incomplete neutralization or lack of SDS removal will result in partial or total failure to immunoprecipitate Aβ from the brain extracts. Immunoprecipitation is based on the specific antigen-antibody reaction, in this case the interaction of Aβ species with the immobilized anti-Aβ 4G8 and 6E10 antibodies. Extreme pH values and presence of detergents are among the known elements that disrupt antigen-antibody interactions.
-
7
Incubate anti-Aβ coated beads with neutralized amyloid- or SDS-free pre-amyloid rich-extracts overnight in a 4°C cold-room and with bi-directional rotation, as above.
NOTE: The volumes of the tissue-extracted fractions to be incubated with the beads depend on the Aβ load of the different cases, as well as to the detection method that follows. Typically, immunoprecipitation of ~4% of the formic-acid- and ~20% of the SDS-extracts prepared in accordance to Protocol 1 yield enough material for subsequent Western blot and mass spectrometry analyses.
-
8
Wash the magnetic beads 3 times with PBS.
-
9
Elute the material bound to the paramagnetic beads in accordance to the assays that will be performed subsequently on the eluted material.
For Western blot analysis
Resuspend the beads in 10 µl of Tris-Tricine SDS sample buffer (BioRad, Richmond VA) containing 10% β-mercaptoethanol (Sigma) and directly apply onto 16% Tris-Tricine gels for SDS-PAGE and Western blot analysis, as described in detail below.
NOTE: β-mercaptoethanol may be substituted by 5 µl of 1 M dithiothreitol (Sigma).
For MALDI-TOF mass spectrometry
Wash the beads 3 times with Milli-Q water and dry them in a SpeedVac concentrator system. Elute bound Aβ peptides with 5 µl of a 4:4:1 mixture of isopropyl alcohol/water/formic acid (28). The eluate is then stored at −80°C until MALDI-TOF mass spectrometry analysis. This analysis requires specialized equipment and is typically performed at dedicated facilities; therefore, it will not be described herein.
Western blot analysis
Materials
Cathode buffer: Tris-Tricine-SDS buffer 10× concentrate (Sigma) [1M Tris-HCl, 1M Tricine, 1% (w:v) SDS, pH 8.2
Anode Buffer: 10× concentrate: 2 M Tris-HCl, pH 8.9
Gel Buffer: 3 M Tris-HCl, 0.3% (w:v) SDS pH 8.45
Acrylamide Stock: 40% Acrylamide/Bis solution, 29:1 (3.3% C; BioRad)
10% (w/w) Ammonium persulfate (APS)
TEMED (N,N,N,N’- Tetra-methyl-ethylendiamine (BioRad)
Tris-tricine sample buffer (BioRad)
Transfer buffer: 10 mM 3-cyclohexylamino-1-propanesulfonic acid (CAPS, Sigma), pH 11.0 containing 10% v:v methanol
Blocking solution: 5% non-fat dry milk in PBS containing 0.1% Tween 20 (Sigma)
Tris-buffered saline (Fisher Scientific) containing 0.1% Tween 20 (TBST).
Nitrocellulose membranes for chemiluminescence (Hybond ECL; Amersham Pharmacia Biotechnology, Piscataway NJ)
Monoclonal anti-Aβ antibodies, 4G8 and 6E10, Covance)
HRP-labeled F(ab’)2 anti-mouse IgG (Amersham Pharmacia)
Western Blotting ECL Detection Substrate (SuperSignal West Pico, Pierce Biotechnology, Rockford, IL).
Film for chemiluminescence (Hyperfilm ECL, Amersham Pharmacia)
Hoeffer MiniVE Mini Vertical Electrophoresis Unit (Fisher Scientific, Pittsburgh, PA)
Hoeffer TE22 Mini Tank Blotting Unit (Fisher Scientific, Pittsburgh, PA)
Power Station 300 plus (Labnet International, Inc.; Woodbridge, NJ) or equivalent
Orbital Shaker (Bellco Biotechnology, Vineland, NJ), or equivalent
M35A X-OMAT Film Processor (Eastman Kodak Company, Rochester, NY) or equivalent
Detailed procedure
Preparation of slab gels for Tris-Tricine SDS-PAGE (29)
Running gel: for two 16% gels (12 × 10 × 1.5 mm) combine
12.4 ml Acrylamide stock solution
10 ml Gel buffer
3.2 ml glycerol
4.5 ml deionized water
Add 150 µl 10% APS and 15 µl TEMED and pour immediately between the two previously cast glass plates. Lay with isopropanol and leave at room temperature until polymerization. Once polymerized, remove the isopropanol layer, and pour the stacking gel prepared as follows.
Stacking gel
1.6 ml Acrylamide stock solution
3 ml Gel buffer
7.4 ml deionized water
Add 80 µl 10% APS and 14 µl TEMED, pour on top of the running gel, and carefully insert the comb avoiding the formation of bubbles.
Electrophoresis
Resuspend the samples to be analyzed -either purified and liophylized amyloid and pre-amyloid extracts or paramagnetic beads containing the immunoprecipitated material (see above protocol, step 4) - in ~20 µl Tris-Tricine sample buffer.
Boil for 5 min and load onto the gel previously assembled into the electrophoresis unit with the cathode buffer in the upper chamber and the anode buffer in the lower chamber.
-
Run electrophoresis at ~45V (20 mA) for 15 min to ½ hour until samples have entered the running gel; at this point, voltage can be increased to 120–150V until completion (~2–3 h).
NOTE: For organization purposes, sometimes it is convenient to run the gels overnight. In this case, after the sample is inside the running gel, lower the voltage to ~20V (<10 mA) for overnight run.
-
Remove the gel, equilibrate in transfer buffer for few minutes, and assemble the transfer cassette positioning the pre-wetted nitrocellulose membrane carefully on top of the gel.
Note: Avoid touching gel, nitrocellulose, as well as transfer sponges and cassettes without gloves. Make sure there are no air bubbles trapped between the gel and the nitrocellulose which will prevent successful transfer.
-
Electrotransfer 45 min at 400 mA in a Hoeffer TE22 Mini Tank Blotting Unit, or equivalent
NOTE: To analyze degree of Aβ oligomerization in pre-amyloid extracts increase the transfer time up to 2 h to allow proper electrotransference of higher molecular mass assemblies.
-
Carefully disassemble the transfer cassette and remove the nitrocellulose sheet. Rinse the membrane with PBS, and block with blocking solution for 3h at 4°C while rocking in a rotating platform
NOTE: Blocking time is not critical and it can be extended overnight or even performed during week-end depending on individual schedules.
Remove the blocking solution and incubate with a combination of 4G8 and 6E10 (1 µg/ml of each antibody in TBST) for 3h at room temperature, while on shaker.
Wash the membrane 3 times for 10 min with TBST while rocking vigorously
Incubate with the secondary antibody at 1:10,000 dilution for 1h at room temperature
Wash the membranes 3-times for 10 min with TBST while rocking vigorously
-
Prepare the two-component ECL substrate, consisting of a stable luminol solution with an enhancer and a stable peroxide solution, by mixing the two components together at a one-to-one ratio.
NOTE: Once prepared, the ECL substrate working solution is stable for a minimum of 24 hours at room temperature.
Immerse the nitrocellulose sheet in the ECL substrate working solution and incubate for 2 minutes. Assemble the autoradiography cassette positioning the drained nitrocellulose membrane between regular plastic sheet protectors making sure there are no bubbles remain on top of the nitrocellulose membrane.
-
In a dark-room, assemble the autoradiography cassette by putting a film on top of the sheet protector sandwich containing the transferred membrane covered by the ECL substrate. Close the cassette and exposed the membrane for ~30 sec to 1min.
NOTE: Exposure times should be determined empirically and range from 3–5 seconds to 10–20 minutes depending on the intensity of the signals which in turn are related to the protein load on the gel, the concentration of Aβ of the samples analyzed as well as the strength of the primary antibody. It is recommended to start with a medium time, ~30 sec to 1 min, each time developing the film as below; depending on the quality of the image obtained, either decrease or increase the exposure time, accordingly.
-
Develop the film in a M35A X-OMAT Film Processor, or equivalent.
NOTE: Chemiluminescent substrates have been steadily gaining in popularity throughout the past decade to become the detection method of choice in most protein laboratories due to their several advantages over other detection methods. ECL not only allows multiple exposures to obtain the best image but also the detection reagents can be stripped away and the entire blot reprobed to optimize detection conditions, test different antibodies, or visualize other proteins, including control proteins for normalization purposes. A large linear response range allows detection and quantitation over a large range of protein concentrations. Most importantly, chemiluminescence yields the greatest sensitivity of any available detection method with detection limits in the low picogram range.
Amino acid sequence analysis
Determination of the primary amino acid sequence of a protein is the gold standard for protein identification delivering picomole-order sensitivity. Most sequence analyzers determine the N-terminal amino acid sequence through the Edman degradation reaction, labeling the amino terminal residue which is then cleaved from the rest of the peptide, derivatized, and identified through the elution time in high pressure liquid chromatography in comparison with standards (30, 31). In this unit we will restrict only to the preparation of the samples for amino acid sequencing since the procedure requires specialized equipment and is performed at dedicated facilities.
Materials
Polyvinylidene difluoride membranes (Immobilon-P; Millipore Corp.)
Protein stain solution: 0.125 % (w:v) Coomassie Blue R-250 in 50 % methanol
Destain solution: 50 % methanol
494 Procise Protein Sequencer (Applied Biosystems, Foster City, CA) or equivalent
Protocol
-
Separate the sample of interest in SDS-PAGE and electrotransfer to PVDF membranes following the procedure for Western blot analysis (see above).
NOTE: PVDF membranes are hydrophobic and need to be pre-wetted in 100% methanol for 15 seconds before being transferred to a container with Milli-Q water for 2 minutes, and equilibrated in CAPS transfer buffer prior to the assembly of the transfer cassette. Do not leave any dry spots that can result in an unsuccessful transfer.
-
After transfer, rinse the membrane with Milli-Q water, stain for 1 min with Coomassie Protein Stain, and differentiate with several washes (15 seconds each) of destaining solution.
NOTE: The destaining procedure should be performed under continuous, vigorous shaking and with several changes of the destaining solution for more efficient removal of excess dye.
-
Rinse the transferred membrane with Milli-Q water, excise the bands of interest with a scalpel and keep them in a microfuge tube under Milli-Q water at 4°C until sequencing at a dedicated facility.
NOTE: It is recommended that PVDF membranes do not dry at any time, since due to their hydrophobicity they will require re-wetting in 100 % methano l t o re-establish their hydrophilicity.
PURIFICATION AND CHARACTERIZATION OF PAIRED-HELICAL FILAMENTS
Neurofibrillary tangles found in Alzheimer’s disease brain are composed of twisted fibers known as paired helical filaments (PHFs). The biochemical characterization of the components of PHF eluded investigators for many years principally due to the difficulties in disrupting their structure and achieving solubilization. Eventually, it was demonstrated that PHF was constituted by self-assembled tangles of hyperphosphorylated tau proteins, a family of various isoforms of microtubule-associated proteins abundant in neurons. Through their interaction with tubulin tau proteins promote tubulin assembly into microtubules and stabilize these microtubules mostly by phosphorylation [reviewed in (3)].
Protocols employed for the purification of PHF are, like in the case of amyloid, mostly based on a combination of different solubilization strategies [e. g. use of various detergents, sonication and boiling, addition of chaotropes] together with enrichment by sedimentation centrifugation and in some cases column chromatography. Below we describe two basic procedures successfully employed for the isolation of PHF from AD tissues (8, 12).
PROTOCOL 5: Isolation of PHF by sedimentation centrifugation (12) (Figure 4)
Figure 4.

Schematic representation of the isolation of PHF by the sedimentation centrifugation procedure described in Protocol 5.
Materials
Frozen brain tissue enriched in NFT, as determined by standard immunohistochemistry.
Homogenization buffer: 0.75 M NaCl in RAB buffer [100 mM 2-(N-morpholino) ethanesulfonic acid (MES), 1 mM EGTA, 0.5 mM MgSO4, 2 mM DTT, pH 6.8]
PHF extraction buffer: 10 mM Tris-HCl, 10% sucrose, 0.85 M NaCl, 1 mM EGTA, pH 7.4
Sucrose
Protease Inhibitors Cocktail (Roche)
Sarkosyl (Sodium Lauroyl Sarcosinate)
2M guanidine isothiocyanate
Ultracentrifuge XL100K (Beckman Coulter, Fullerton, CA) equipped with 70.1 and SW40 Ti rotors, or equivalent
Detailed protocol (Figure 3)
Dissect the gray matter clean of leptomeninges and large blood vessels
Homogenize in homogenization buffer at a ratio of 1.5 ml buffer per gram of tissue.
Incubate at 4°C for 20 min to depolymerize any residual microtubules
Centrifuge at 11,000 × g for 20 min at 4°C using the 70.1 rotor
Collect the supernatant and re-centrifuge at 100,000 × g for 60 min at 4°C using the same rotor. The resulting supernatant contains primarily soluble normal tau while PHF remains in the pellet.
Combine the pellets from the first and the second cold centrifugations and resuspend in PHF extraction buffer [1:10 (w:v); e. g. for 1 g starting material 10 ml extraction buffer].
-
Spin down at 15,000 × g for 20 min at 4°C
NOTE: In the presence of 10% sucrose and at low speed centrifugation, isolated PHF as well as small PHF aggregates remain in the supernatant whereas intact or fragmented NFTs and larger PHF aggregates are pelleted.
Re-extract the pellet repeating steps 6 and 7 and pool the supernatants.
-
Add Sarkosyl to a final 1% concentration and stir at room temperature for 1h.
NOTE: Sarkosyl treatment removes membranous material from the crude preparation thereby enriching the solution in PHF-tau.
Centrifuge for 30 min at 4 ° C in the 70.1 Ti rotor at 100,000 × g.
Resuspend the pellet containing PHF in 1–5 ml RAB buffer depending on the amount of starting material (ratio: 1 ml buffer for 25 g of starting gray matter), sonicate until smooth, and boil for 5 min.
Load 0.5 ml aliquots onto a discontinuous 1.0 – 2.5 M sucrose gradient, prepared essentially as described in protocol 2.
Centrifuge for 16 h at 4°C using the SW40 Ti swinging bucket rotor at 175,000 × g.
-
Discard the white flocculent layer containing mostly membranes on the top of the gradient. A thick brown band is recovered between the 1.25 and 1.5M sucrose interface, thick brownish material is found on the 1.75 and 2.0 M interface, and a small light brown material between the 2.25 and 2.5 M sucrose layers.
NOTE: typically only the heaviest fraction contains PHF uncontaminated with amorphous material. However, this fraction represents <20% of the total PHF-tau recovered from all three fractions of the sucrose gradient –from 10 g of enriched gray matter only ~1µg of nearly pure intact PHFs is generated from this heaviest fraction.
Fractions from the two lightest sucrose interfaces may be used to further purify PHF-tau. After collecting the material, add 2M guanidine isothiocyanate (about 1 ml per gram wet tissue) and stir for 1h at 37°C.
-
Centrifuge at 50,000 × g for 30 min at 25°C, discard the pellet, dialyze the supernatant against several changes of distilled water to remove the guanidine isothiocyanate and lyophilize. PHF-tau proteins are ready for further use; its fibrillar structure may be confirmed by Thioflavine-S fluorescence assay or EM as described for amyloid preparations.
NOTE: The measurement of Thioflavine-S fluorescence is a good indicator of PHF formation and it is generally employed in in vitro assays of tau assembly. Nevertheless, it is not an absolute proof of PHF existence since not only it is positive for tau aggregation into amorphous structures but also a shift in the thioflavin fluorescence is seen in the presence of amyloid fibrils and protofibrils, as described above.
The ultimate demonstration of PHF purification is achieved by EM, revealing the typical 10 to 20 nm-wide filaments and showing the characteristic twist with a crossover repeat of approx 80 nm (32–34).
PROTOCOL 6: An alternative for the isolation of PHF by sedimentation centrifugation
This alternative protocol is also based on density centrifugation enrichment of NFTs, but incorporates an additional glass beads chromatography step to eliminate contamination with capillary vessels (8).
Materials
Tissue
Sucrose
SDS
Dounce homogenizer
Glass bead column; bead sizes 0.25–0.30 mm and 0.45 – 0.5 mm
Ultracentrifuge XL100K (Beckman Coulter, Fullerton, CA) equipped with 70.1 and SW40 Ti rotors, or equivalent
Protocol
Separate gray matter from meninges and white matter, homogenize in 5-fold volume of 0.32 M sucrose in a Dounce homogenizer, and sieve through 150- and 70-µm nylon meshes (as in Protocol 1).
Bring up the sucrose concentration of the filtrate to 1 M by addition of an equal volume of 2 M sucrose.
Centrifuge in the SW40 Ti swinging bucket rotor at 4,800 × g for 40 min.
Remove the floating material as well as the supernatant by aspiration and discard.
Resuspend the pellet in 1 M sucrose, rehomogenize and lay over a discontinuous density gradient of 20 ml each of 1.8, 1.2, 1.15, 1.1, and 1.05 M sucrose in 150 ml capacity tubes.
Centrifuge at 4,800 × g for 50 min.
Remove the floating pad and all material above the 1.2–1.8 M sucrose interface and discard it. Pool together the layer banding at the 1.2–1.8 M sucrose interface and the pellet, which are enriched in NFTs, for further purification.
Dilute the pooled NFTs fractions five- to six-fold with deionized water, centrifuge as above, and discard the supernatant.
Resuspend the pellet in 0.32 M sucrose as above using a Douncer homogenizer, and further sieve the suspension through 35-µm mesh.
Pass the filtrate through a glass bead column to remove the bulk of the capillaries present as a contaminant. Elute the column with the 0.32 M sucrose equilibrating buffer.
Centrifuge the eluate as above, discard the supernatant, and re-homogenize the pellet in 0.32 M sucrose.
-
Add SDS to a 2% final concentration and incubate at room temperature 3–5 min.
Note: Non-ionic detergents like Triton X-100 are considerably milder in their solubilization capacity and as a consequence leave a number of subcellular structures intact (e. g. neurofilaments). Therefore, their use for PHF isolation is not recommended.
-
Bring the sucrose concentration to 1 M by addition of an equal volume of 2 M sucrose. Layer on a discontinuous gradient of 5 ml of 2.2 M and 10 ml of 1.1 M sucrose in a 30-ml tube. Centrifuge as above, but increasing the temperature to 20 °C.
Note: SDS-containing samples cannot be maintained at low temperatures (see comments on Protocol 1 for amyloid isolation).
Harvest NFTs, typically in the 1.1–2.2 M sucrose interface; a minor fraction may be found at the 1.0–1.1 M interface.
-
Assess the purity of NFTs by EM using the same procedure as described above for amyloid and visualization by transmission electron microscopy.
NOTE: PHFs extracted from Alzheimer’s brain exhibit a characteristic twist with a crossover repeat of approximately 80 nm (Figure 1). The filaments have a typical width of 10 to 20 nm and a minimum width at crossing points of 9–9.5 nm. Single filaments twist over themselves to give the appearance of flat ribbons.
PROTOCOL 7: NFT Isolation by Laser Capture Microdissection
LCM provides advantages for the purification of NFTs, as in the case of amyloid plaques, being the most significant the capability of obtaining samples without cross contamination with other tissue structures. The protocol is essentially the same as the described for the LCM of amyloid plaques (Protocol 4) using also10 µm-thick cryostat sections of AD brain tissue. The individualization of NFT prior to the dissection is performed by routine immunohistochemistry using as primary antibody mouse monoclonal anti-tau antibodies (tau-2, Sigma, St. Louis, MO) (35) or equivalent. This may be followed by either immunofluorescence detection –via secondary antibodies conjugated to fluorescent dyes- or by traditional HRP-labeled secondary antibodies followed by ABC complex and diaminobenzidine detection.
Protocol
Follow steps 1–4 for tissue preparation for LCM
Fix sections in cold acetone for 10 min and permeabilize with 0.1% Triton X-100 for 10 min and follow routine immunohistochemical procedures for NFT detection (35).
Follow steps 9–11 of the microdissection procedure in Protocol 4. Collect about 2000 NFT for successful proteomic analysis.
Solubilize microdissected samples in 70% formic acid with 1 min sonication. Dry samples through vacuum centrifugation and proceed for mass spectrometry analysis. Typically, Liquid Chromatography coupled with ion trap tandem mass spectrometry (LC-MS/MS) is one the most sensitive and widely used methodologies for minute samples of complex protein mixtures. Due to the sophisticated equipment and elaborate methodology involved in these analyses, readers are referred to specially dedicated reviews in the field (22, 24).
COMMENTARY
Background Information
Cerebral amyloid diseases are considered part of an emerging complex group of chronic and progressive entities collectively known as “Disorders of Protein Folding” that include sporadic and familial Alzheimer’s disease, cerebellar ataxias, Parkinson’s and prion diseases, tauopathies, type-II diabetes, systemic amyloidosis, Huntington’s disease and cataracts, among others (36–39). In these diseases, through mechanistic pathways poorly understood, soluble proteins normally found in biological fluids change their conformation and form either insoluble structures that accumulate in the form of either intra- and extra-cellular aggregates or fibrillar lesions usually resulting in cell damage, organ dysfunction and eventually death. Only about one-third of amyloid proteins known to be linked with human disease are associated with neurodegenerative disorders (36, 40). In AD two proteins aggregate in an abnormal fashion, the Aβ peptide which builds the plaques in the parenchymal extracellular space and deposit around blood vessels and the microtubule-associated protein tau which polymerizes in the form of intraneuronal paired helical filaments, the building blocks of NFTs (41, 42).
Regardless of the nature of the misfolded proteins involved, all extracellular fibrillar deposits, generically referred to as amyloid, share common physical, structural, and tinctorial properties (see Figure 1). In general, they are i) highly polymerized and poorly soluble assemblies, features that require the use of strong detergents, harsh acid conditions or concentrated chaotropes to partially extract them from the tissue deposits; ii) structurally rich in β-pleated sheet conformations, a property accountable for the apple-green birefringence of the deposits when observed under polarized light after Congo red staining as well as for their yellow-green fluorescence after thioflavin S staining; and iii) fibrillar in shape when negatively stained and observed under the electron microscope (2, 43, 44). These properties are also shared by PHF, showing high degree of insolubility, an enrichment in β-sheet configuration when compared with the unfolded structure of soluble tau (45) and a typical fibrillar structure under the electron microscope (5, 46) (Figure 1).
The high insolubility of the amyloid deposits and NFTs challenged investigators for many years and prevented the individualization of the respective proteins constituting the lesions. The methods employed to isolate plaques and tangles were mostly based on their physical properties, and consisted in various combinations of sieving through different size-meshes to eliminate microvascular components, density centrifugation to enrich preparations in heavier components –plaques and tangles-, addition of different detergents and chaotropic agents, heating and sonication in attempts to solubilize the materials (5, 6, 9, 16, 47–49). Above, we have presented a group of protocols exemplifying the use of these different methodological approaches. Other protocols, not described here, represent variations of the main procedures and are based on the same principles (15, 47, 48, 50, 51). An exception is constituted by a few methods that in addition to the traditional tissue homogenization and gradient centrifugation steps employ Fluorescence-Activated Cell Sorting (FACS) techniques to separate plaques and tangles after their immunoreaction with either anti-Aβ or anti-tau antibodies, respectively, followed by secondary antibodies conjugated to fluorescent dyes (6, 9). We did not extend in these protocols due to their requirement of Cell Sorting equipment which is not always widely available.
The advent of mass spectrometry methodologies provided invaluable tools for the analysis of the components of plaques and tangles and were instrumental in the assessment of post-translational modifications associated with both deposits. In the case of Aβ, mass spectrometry corroborated the presence of cyclic pyroglutamate-modified fragments, exclusively associated with deposited N-terminally truncated Aβ species not detected in biological fluids, and demonstrated an abundance of soluble N-, and C-terminal degraded species likely representing the action of an array of diverse proteases and clearance mechanisms (10, 52, 53). Mass spectrometry was also instrumental in the identification of many of the abnormal hyper-phosphorylated sites of PHF-tau protein extracted from AD cases (49, 54, 55). The recent development of proteomic technologies based on the use of more sophisticated mass spectrometry methods, capable of identifying minute components in complex protein mixtures became an invaluable tool for the analysis of AD-related lesions. Their extraordinary sensitivity, in combination with the high selectivity of laser-capture microdissection techniques allows the isolation of plaques and tangles without cross-contamination with other tissue structures. Using this approach, more than 400 proteins have been demonstrated in AD senile plaques (21, 22) while 155 different components have been shown to form part of the protein deposits in NFTs (35).
We have limited the scope of the protocols presented above to the isolation of amyloid and NFTs from AD brain. Nevertheless, the same methodological approaches may be adapted to the isolation of plaques and tangles found in other cerebral amyloidosis. It should be emphasized that although AD is by far the most common brain amyloidosis, other disorders share the presence of parenchymal amyloid and pre-amyloid deposits and in some cases even NFTs with identical pattern of PHF-tau [reviewed in (2)]. Among the non-Aβ amyloidosis, two diseases -familial British and Danish dementias- show striking clinical and neuropathological similarities to AD [reviewed (56)]. We have adapted the protocols described above for the extraction and biochemical identification of the vascular and parenchymal amyloid and pre-amyloid deposits in familial British and Danish dementia cases and successfully achieved the identification of the deposited species via mass spectrometry (10). Through slight modifications, the methodology described above may be also employed for other amyloid disorders either cerebral or systemic, being differences in solubility the major consideration.
Critical parameters and troubleshooting
The accurate biochemical evaluation of amyloid and PHF extracted from brain specimens of affected individuals requires minimization of the mostly enzymatic-driven protein modifications occurring after death. It is therefore imperative to use tissue that was collected with the shortest post-mortem delay –ideally no more than 2 to 4h– to ensure high recovery and minimal changes. In addition, the appropriate selection of tissues is perhaps one of the most critical factors in determining a good recovery. The extension of the neuropathological lesions is highly variable not only among different AD cases but also among various regions of the same brain. It is therefore advisable to select specimens with abundant AD-related pathology to guarantee high yields in the preparations. The use of widely available standardized protocols and abundant commercial sources of antibodies for both Aβ and PHF-tau allows the immunohistochemical evaluation of the neuropathological compromise, which should be performed prior to starting the isolation procedure and should also serve as a guidance as to the starting amount of tissue.
All the procedures described in this unit involve tissue homogenization prior to the different extraction protocols. The use of protease inhibitors and the maintenance of the specimens at 4°C are imperative to prevent undesired enzymatic degradation after the release of intracellular proteases occurring during cell lysis. We have described the use of a cocktail of inhibitors which is routinely employed in our laboratory. Nevertheless, there are in the market multiple available options (including individual inhibitors) which could replace the one we suggested. After homogenization, many of the protocols require density gradient centrifugation. It should be emphasized that it is primordial to observe the recommended temperatures during the full procedure, since the density of the different solutions composing the various gradients, either sucrose, Percoll or Ficoll depends on the temperature. The localization of amyloid and PHF in the different gradient interfaces may vary slightly with the preparation of the different solutions. It is advised that, at least during the first time in which the protocols are run in the laboratory, the presence of fibrillar materials –either amyloid or PHF– is confirmed by electron microscopy.
Anticipated results
A typical purification of amyloid plaques results in their enrichment in the 1.4 M –2.0 M sucrose interfaces (Protocol 2). In the case of PHF isolation (Protocol 5), the most pure fraction is typically located between the 2.25 M and 2.5 M sucrose layers, although representing only a minor part (~20%) of the total PHF-tau; the rest of PHF is recovered from the 1.25 – 1.5 and 1.75 – 2.0 M interfaces. The ultimate confirmation of the presence of amyloid and PHF requires electron microscopy evaluation after negative staining with uranyl acetate as described above. Figure 4 shows the expected morphological features of the purified elements. Amyloid fibrils, irrespective of their origin, are arranged in random arrays and are non-branching with a typical 8–10 nm width. PHF exhibits a characteristic twist with a crossover repeat of approximately 80 nm; the filaments have a typical width of 10 to 20 nm and a minimum width at crossing points of 9–9.5 nm. Single PHF filaments twist over themselves to give the appearance of flat ribbons. The biochemical evaluation of amyloid Aβ deposits by mass spectrometry typically demonstrates high heterogeneity. The major species expected are Aβ1-40 and Aβ1-42, for vascular and parenchymal deposits, respectively. Nevertheless, N-, a n d C-terminal truncated species representing proteolytic degradation of the deposited species, as well as a variety of different post-translationally modified fragments including oxidation-derived and pyroglutamate derivatives are common findings.
Time Considerations
The protocols for the isolation of plaques and PHF involve several rounds of sedimentation centrifugation and require about a week for completion, although much of this time is spent waiting for centrifugations and does not involve continual lab-bench work. On the contrary, the sequential extraction of amyloid and pre-amyloid deposits described in Protocol 1 utilizing short time centrifugations, requires a more constant dedication to the procedure which will take about three days for completion.
Extra time should be allotted to the characterization of the purified material by Western blot, mass spectrometry, amino acid sequence analysis and electron microscopy studies which will easily use up 7–10 days, depending on the experience of the operator, his/her work-day schedule and the availability of the equipment. In many circumstances the evaluation of the isolated material by mass spectrometry, sequence analysis and electron microscopy requires the use of especially dedicated facilities. Although the analysis themselves do not require more than few hours, the work load of the dedicated facilities may in some cases add extra time to the overall procedure.
Acknowledgements
This work was supported in part by NIH grants NS051715, AG010491, AG008051 ADC Pilot and by the Alzheimer’s Association.
Literature Cited
- 1.Selkoe DJ. Normal and abnormal biology of the beta-amyloid precursor protein. Annu. Rev. Neurosci. 1994;17:489–517. doi: 10.1146/annurev.ne.17.030194.002421. [DOI] [PubMed] [Google Scholar]
- 2.Ghiso J, Frangione B. Amyloidosis and Alzheimer's disease. Adv. Drug Delivery Rev. 2002;54:1539–1551. doi: 10.1016/s0169-409x(02)00149-7. [DOI] [PubMed] [Google Scholar]
- 3.Ballatore C, Lee V, Trojanowski JQ. Tau-mediated neurodegeneration in Alzheimer's disease and related disorders. Nat. Reviews Neurosci. 2007;8:663–672. doi: 10.1038/nrn2194. [DOI] [PubMed] [Google Scholar]
- 4.Grundke-Ikbal I, Iqbal K, Tung YC, Quinlan M, Wisniewski HM, Binder LI. Abnormal phosphorylation of the microtubule-associated protein tau in Alzheimr cytoskeletal pathology. Proc Natl Acad Sci U S A. 1986;83:4913–4917. doi: 10.1073/pnas.83.13.4913. [DOI] [PMC free article] [PubMed] [Google Scholar]
- 5.Gorevic P, Goni F, Pons-Estel B, Alvarez F, Peress N, Frangione B. Isolation and partial characterization of neurofibrillary tangles and amyloid plaque core in Alzheimer's disease: Immunohistological studies. J. Neuropathol. Exp. Neurol. 1986;45:647–664. doi: 10.1097/00005072-198611000-00004. [DOI] [PubMed] [Google Scholar]
- 6.Selkoe DJ, Abraham CR, Podlisny MB, Duffy LK. Isolation of low-molecular-weight proteins from amyloid plaque fibers in Alzheimer's disease. J. Neurochem. 1986;46:1820–1834. doi: 10.1111/j.1471-4159.1986.tb08501.x. [DOI] [PubMed] [Google Scholar]
- 7.Grundke-Ikbal I, Iqbal K, Quinlan M, Tung YC, Zaidi MS, Wisniewski HM. Microtubule-associated protein tau. J. Biol. Chem. 1986;261:6084–6089. [PubMed] [Google Scholar]
- 8.Iqbal K, Zaidi T, Thompson CH, Merz PA, Wisniewski HM. Alzheimer pair helical filaments: bulk isolation, solubility, and protein composition. Acta neuropathol. 1984;62:167–177. doi: 10.1007/BF00691849. [DOI] [PubMed] [Google Scholar]
- 9.Roher A, Wolfe D, Palutke M, Kukuruga D. Purification, ultrastructure, and chemical analysis of Alzheimer disease amyloid plaque core protein. Proc Natl Acad Sci U S A. 1986;83:2662–2666. doi: 10.1073/pnas.83.8.2662. [DOI] [PMC free article] [PubMed] [Google Scholar]
- 10.Tomidokoro Y, Lashley T, Rostagno A, Neubert TA, Bojsen-Moller M, Braendgaard H, Plant G, Holton J, Frangione B, Revesz T, Ghiso J. Familial Danish dementia: Co-existence of ADan and Aβ amyloid subunits in the absence of compact plaques. J. Biol. Chem. 2005;280:36883–36894. doi: 10.1074/jbc.M504038200. [DOI] [PubMed] [Google Scholar]
- 11.Hyman BT, Trojanowski JQ. Consensus recommendations for the postmortem diagnosis of Alzheimer disease from the National Institute on Aging and the Reagan Institute Working Group on diagnostic criteria for the neuropathological assessment of Alzheimer disease. J. Neuropathol. Exp. Neurol. 1997;56:1095–1097. doi: 10.1097/00005072-199710000-00002. [DOI] [PubMed] [Google Scholar]
- 12.Lee V, Wang J, Trojanowski JQ. Purification of Paired Helical Filament tau and normal tau from human brain tissue. In: Wetzel R, editor. Methods in Enzymology. New York: Elsevier Inc.; 1999. pp. 81–89. [DOI] [PubMed] [Google Scholar]
- 13.Braak H, Braak E. Neuropathological stageing of Alzheimer-related changes. Acta neuropathol. 1991;82:239–259. doi: 10.1007/BF00308809. [DOI] [PubMed] [Google Scholar]
- 14.Golde TE, Eckman CB, Younkin SG. Biochemical detection of Abeta isoforms: implications for pathogenesis, diagnosis, and treatment of Alzheimer's disease. Biochim. Biophys. Acta. 2000;1502:172–187. doi: 10.1016/s0925-4439(00)00043-0. [DOI] [PubMed] [Google Scholar]
- 15.Roher A, Kuo Y-M. Isolation of amyloid deposits from brain. Methods Enzymol. 1999:309. doi: 10.1016/s0076-6879(99)09006-0. [DOI] [PubMed] [Google Scholar]
- 16.Selkoe DJ, Ihara Y, Salazar FJ. Alzheimer's disease insolubility of partially purified helical filaments in sodium dodecyl sulfate and urea. Science. 1982;215:1243–1245. doi: 10.1126/science.6120571. [DOI] [PubMed] [Google Scholar]
- 17.Westermark GT, Johnson KH, Westermark P. Staining methods for identification of amyloid in tissue. Methods Enzymol. 1999;309:3–25. doi: 10.1016/s0076-6879(99)09003-5. [DOI] [PubMed] [Google Scholar]
- 18.Morelli L, Llovera R, Mathov I, Lue L-F, Frangione B, Ghiso J, Castaño EM. Insulin-degrading enzyme in brain microvessels: Proteolysis of amyloid β vasculotropic variants and reduced activity in cerebral amyloid angiopathy. J. Biol. Chem. 2004;279:56004–56013. doi: 10.1074/jbc.M407283200. [DOI] [PubMed] [Google Scholar]
- 19.Pardridge WM, Vinters HV, Yang J, Eisenberg J, Choi TB, Tourtellotte WW, Huebner V, Shively JE. Amyloid angiopathy of Alzheimer's disease: amino acid composition and partial sequence of a 4,200-dalton peptide isolated from cortical microvessels. J. Neurochem. 1987;49:1394–1401. doi: 10.1111/j.1471-4159.1987.tb01005.x. [DOI] [PubMed] [Google Scholar]
- 20.Tennent GA. Isolation and characterization of amyloid fibrils from tissue. Methods Enzymol. 1999;309:26–47. doi: 10.1016/s0076-6879(99)09004-7. [DOI] [PubMed] [Google Scholar]
- 21.Liao L, Cheng D, Wang J, Duong DM, Losik TG, Gearing M, Rees HD, Lah JJ, Levey AI, Peng J. Proteomic characterization of postmortem amyloid plaques isolated by laser capture microdissection. J. Biol. Chem. 2004;279:37061–37068. doi: 10.1074/jbc.M403672200. [DOI] [PubMed] [Google Scholar]
- 22.Gozal YM, Cheng D, Duong DM, Lah JJ, Levey AI, Peng J. Merger of laser capture microdissection and mass spectrometry: A window into the amyloid plaque proteome. Methods Enzymol. 2006;412:77–93. doi: 10.1016/S0076-6879(06)12006-6. [DOI] [PubMed] [Google Scholar]
- 23.Ahram M, Flaig MJ, Gillespie JW, Duray PH, Linehan WM, Ornstein DK, Niu S, Zhao Y, Petricoin EF, 3rd, Emmert-Buck MR. Evaluation of ethanol-fixed, paraffin-embedded tissues for proteomic applications. Proteomics. 2003;3:413–421. doi: 10.1002/pmic.200390056. [DOI] [PubMed] [Google Scholar]
- 24.Nesvizhskii AI. Protein identification by tandem mass spectrometry and sequence database searching. Methods Mol. Biol. 2007;367:87–119. doi: 10.1385/1-59745-275-0:87. [DOI] [PubMed] [Google Scholar]
- 25.Howie AJ, Brewer DB, Howell D, Jones A. Physical basis of colors seen in Congo red-stained amyloid in polarized light. Lab Invest. 2008;88:232–242. doi: 10.1038/labinvest.3700714. [DOI] [PubMed] [Google Scholar]
- 26.Ward RV, Jennings KH, Jepras R, Neville W, Owen DE, Haukins J, Christie G, Davis JB, George A, Karran EH, Howlet DR. Fractionation and characterization of oligomeric, protofibrillar and fibrillar forms of β-amyloid peptide. Biochem J. 2000;348:137–144. [PMC free article] [PubMed] [Google Scholar]
- 27.Holm Nielsen E, Nybo M, Svehag S-E. Electron microscopy of prefibrillar structures and amyloid fibrils. Methods Enzymol. 1999;309:491–496. doi: 10.1016/s0076-6879(99)09033-3. [DOI] [PubMed] [Google Scholar]
- 28.Ghiso J, Holton J, Miravalle L, Calero M, Lashley T, Vidal R, Houlden H, Wood N, Neubert TA, Rostagno A, Plant G, Revesz T, Frangione B. Systemic amyloid deposits in Familial British Dementia. J. Biol. Chem. 2001;276:43909–43914. doi: 10.1074/jbc.M105956200. [DOI] [PubMed] [Google Scholar]
- 29.Schagger H, von Jagow G. Tricine-sodium dodecyl sulfate-polyacrylamide gel electrophoresis for the separation of proteins in the range from 1 to 100 kDa. Anal. Biochem. 1987;166:368–379. doi: 10.1016/0003-2697(87)90587-2. [DOI] [PubMed] [Google Scholar]
- 30.Niall HD. Automated Edman degradation: the protein sequenator. Methods Enzymol. 1973;27:942–1010. doi: 10.1016/s0076-6879(73)27039-8. [DOI] [PubMed] [Google Scholar]
- 31.Edman P. Method for the determination of aminoacid sequences in peptides. Acta Chem. Scand. 1950;4:283–293. [Google Scholar]
- 32.Barghorn S, Biernat J, Mandelkow E. Purification of recombinant tau protein and preparation of Alzheimer-paired helical filaments in vitro. Methods Mol. Biol. 2005;299:35–51. doi: 10.1385/1-59259-874-9:035. [DOI] [PubMed] [Google Scholar]
- 33.von Bergen M, Li L, Mandelkow E. Intrinsic fluorescent detection of tau conformation and aggregation. Methods Mol. Biol. 2005;299 doi: 10.1385/1-59259-874-9:175. [DOI] [PubMed] [Google Scholar]
- 34.Wisniewski HM, Wen GY. Substructures of paired helical filaments from Alzheimer's disease neurofibrillary tangles. Acta neuropathol. 1985;66:173–176. doi: 10.1007/BF00688696. [DOI] [PubMed] [Google Scholar]
- 35.Wang Q, Woltjer RL, Cimino PJ, Pan C, Montine KS, Zhang J, Montine TJ. Proteomic analysis of neurofibrillary tangles in Alzheimer disease identifies GAPDH as a detergenti-insoluble paired helical filament tau binding protein. Faseb J. 2005;19:869–871. doi: 10.1096/fj.04-3210fje. [DOI] [PubMed] [Google Scholar]
- 36.Taylor JP, Hardy J, Fischbeck KH. Toxic proteins in neurodegenerative disease. Science. 2002;296:1991–1995. doi: 10.1126/science.1067122. [DOI] [PubMed] [Google Scholar]
- 37.Lovestone S, McLoughlin DM. Protein aggregates and dementia: is there a common toxicity? J. Neurol. Neurosurg. Psychiatry. 2002;2002:152–161. doi: 10.1136/jnnp.72.2.152. [DOI] [PMC free article] [PubMed] [Google Scholar]
- 38.Temussi PA, Masino L, Pastore A. From Alzheimer to Huntington: why is a structural understanding so difficult? EMBO J. 2003;22:355–361. doi: 10.1093/emboj/cdg044. [DOI] [PMC free article] [PubMed] [Google Scholar]
- 39.Dobson CM. Protein folding and its links with human disease. Biochem Soc Symp. 2001;68:1–26. [PubMed] [Google Scholar]
- 40.Rostagno A, Ghiso J. Amyloidosis. In: Aminoff M, Daroff R, editors. Encyclopedia of neurological sciences. San Diego: Academic Press; 2003. pp. 129–135. [Google Scholar]
- 41.Selkoe DJ. Folding proteins in fatal ways. Nature. 2003;426:900–904. doi: 10.1038/nature02264. [DOI] [PubMed] [Google Scholar]
- 42.Johnson GV, Bailey CD. Tau, where are we now? J. Alzheimers Dis. 2002;4:375–398. doi: 10.3233/jad-2002-4505. [DOI] [PubMed] [Google Scholar]
- 43.LeVine H. Thioflavine T interaction with amyloid β-sheet structures. Amyloid: Intl. J. Exp. Clin. Invest. 1995;2:1–6. [Google Scholar]
- 44.Klunk WE, Jacob RF, Mason RP. Quantifying amyloid by Congo red spectral shift assay. Methods Enzymol. 1999;309:285–305. doi: 10.1016/s0076-6879(99)09021-7. [DOI] [PubMed] [Google Scholar]
- 45.Vallet PG, Guntern R, Hof PR, Golaz J, Delacourte A, Robakis NK, Bouras C. A comparative study of histological and immunohistochemical methods for neurofibrillary tangles and senile plaques in Alzheimer's disease. Acta Neuropathol. 1992;83:170–178. doi: 10.1007/BF00308476. [DOI] [PubMed] [Google Scholar]
- 46.Barghorn S, Davies P, Mandelkow E. Tau Paired Helical Filaments from Alzheimer's disease brain and assembled in vitro are based on β -structure in the core domain. Biochemistry. 2004;43:1694–1703. doi: 10.1021/bi0357006. [DOI] [PubMed] [Google Scholar]
- 47.Masters CL, Multhaup G, Sims G, Pottigiesser J, Martins RN, Beyreuther K. Neuronal origin of cerebral amyloid: neurofibrillary tangles of Alzheimer's disease contain the same protein as the amyloid of plaque cores and blood vessels. EMBO J. 1985;4:2757–2763. doi: 10.1002/j.1460-2075.1985.tb04000.x. [DOI] [PMC free article] [PubMed] [Google Scholar]
- 48.Greenberg SG, Davies P. A preparation of Alzheimer paired helical filaments that displays distinct tau proteins by polyacrylamide gel electrophoresis. Proc Natl Acad Sci U S A. 1990;87:5827–5831. doi: 10.1073/pnas.87.15.5827. [DOI] [PMC free article] [PubMed] [Google Scholar]
- 49.Iqbal K, Grundke-Ikbal I. Discoveries of tau, abnormally hyperphosphorylated tau and others of neurofibrillary degeneration: A personal historical perspective. J. Alz. Dis. 2006;9:219–242. doi: 10.3233/jad-2006-9s325. [DOI] [PubMed] [Google Scholar]
- 50.Ihara Y, Abraham CR, Selkoe DJ. Antibodies to paired helical filaments in Alzheimer's disease do not recognize normal brain proteins. Nature. 1983;3034:727–730. doi: 10.1038/304727a0. [DOI] [PubMed] [Google Scholar]
- 51.Rubinstein R, Kascsak RJ, Merz PA, Wisniewski HM. Paired helical filaments associated with Alzheimer disease are readily soluble structures. Brain Res. 1986;373:80–88. doi: 10.1016/0006-8993(86)91460-5. [DOI] [PubMed] [Google Scholar]
- 52.Vigo-Pelfrey C, Lee D, Keim P, Lieberburg I, Schenk DB. Characterization of-amyloid peptide from human cerebrospinal fluid. J. Neurochem. 1993;61:1965–1968. doi: 10.1111/j.1471-4159.1993.tb09841.x. [DOI] [PubMed] [Google Scholar]
- 53.Kuo YM, Emmerling MR, Woods AS, Cotter RJ, Roher AE. Isolation, chemical characterization, and quantitation of A beta 3-pyroglutamyl peptide from neuritic plaques and vascular amyloid deposits. Biochem. Biophys. Res. Comm. 1997;237:188–191. doi: 10.1006/bbrc.1997.7083. [DOI] [PubMed] [Google Scholar]
- 54.Hasegawa M, Morishima-Kawashima M, Takio K, Suzuki M, Titani K, Ihara Y. Protein sequence and mass spectrometric analyses of tau in the Alzheimer's disease brain. J. Biol. Chem. 1992;267:17047–11754. [PubMed] [Google Scholar]
- 55.Hanger DP, Betts JC, Loviny TLF, Blackstock WP, Anderton B. New phosphorylation sites identified in hyperphosphorylated tau (paired helical filament-tau) from Alzheimer's disease brain using nanoelectrospray mass spectrometry. J. Neurochem. 1998;71:2465–2476. doi: 10.1046/j.1471-4159.1998.71062465.x. [DOI] [PubMed] [Google Scholar]
- 56.Ghiso J, Rostagno A, Tomidokoro Y, Lashley T, Bojsen-Moller M, Braendgaard H, Plant G, Holton J, Lal R, Revesz T, Frangione B. Genetic alterations of the BRI2 gene: familial British and Danish dementias. Brain Pathol. 2006;16:71–79. doi: 10.1111/j.1750-3639.2006.tb00563.x. [DOI] [PMC free article] [PubMed] [Google Scholar]