The Medicare Modernization Act of 20031 brought with it sweeping changes to community-based oncology practices. As Medicare payment for both drugs and drug administration services have changed, oncology practices have become more aware of their business practices and have responded by closely evaluating and monitoring operations. In a January 2006 report to the Centers for Medicare & Medicaid Services and Congress, titled “The Effects of Medicare Payment Changes on Oncology Services,”2 the Medicare Payment Advisory Commission stated that “oncologists responded by cutting costs and increasing efficiency.” As oncology practices continue to strive to further improve practice efficiency, they will need to develop metrics to measure current performance and trend improvements. They also will need to benchmark key practice business indicators specific to oncology.
The Medical Group Management Association (MGMA), a professional association that includes medical practice managers and administrators throughout the United States, conducts a comprehensive annual cost survey that reports key practice business indicators and related benchmarks. However, the resulting benchmarks lack specificity for the oncology specialty. In the late 1990s, the Assembly of Oncology and Hematology Administrators, an MGMA specialty assembly, developed additional survey questions to report benchmarks specifically for oncology. MGMA published an oncology-hematology survey for several years. However, because of low participation and high administrative burden, the collection of oncology-specific data was discontinued. The last MGMA oncology-specific report was published in 2003 and was based on 2002 data. More recently, MGMA published its Cost Survey for Single Specialty Practices 2006 Report, which was based on 2005 data. The survey contained 138 questions and had participation from only 12 oncology practices nationwide.3
To meet the growing demand for oncology-specific business benchmarks, Onmark created a user-friendly survey tool to collect data on business operations from its member practices. Onmark Inc, an OTN company in South San Francisco, California, is one of the largest group purchasing organizations in the community-based treatment setting, with more than 2,100 members representing more than 3,600 physicians and more than $4 billion in annual drug purchases. To ensure confidentiality, Oncology Metrics LP, was commissioned to conduct the survey and report the results. The goal was to develop a number of key practice business indicators, or benchmarks, by which to measure and trend changes in oncology practice efficiency. To simplify the survey process, the 34-question survey was offered as a Web-based survey tool. A total of 178 oncology practices participated in this First Annual Onmark Office-Based Oncology Business Benchmarking Survey.
Methods
The survey was designed to be simple to complete, to ensure that a substantial portion of the target population would respond. First, a number of key benchmarks were identified, including total full-time equivalent (FTE) staff per FTE physician and new patients per FTE physician. Questions were then developed for these benchmarks and organized into four categories (ie, demographics, staffing, revenue and procedure volume, and expenses) so that the easiest questions could be answered first. Participants were not required to answer all questions.
The calculation formula for each of the benchmarks was written using data elements that are available to a typical practice administrator. These formulas were then analyzed to determine a minimum number of data elements sufficient to calculate the benchmarks. Wherever possible, any data element that could be calculated from other data elements was eliminated to reduce the total number of survey questions. For example, the survey asked respondents for the number of treatment chairs and the number of initial drug administration services. The number of patients per treatment chair per working day was then calculated from these data. Definitions were developed in conjunction with the construction of the formulas so they could be incorporated into the survey instrument.
After alpha testing by a small group of practice administrators, the final survey instrument was posted to the survey Web site. The entire target survey group was notified by email about two national audio conference presentations that were held to explain the survey instructions and definitions. After the first audio conference was completed, invitations to take the survey were emailed to the target audience, and the Web site was launched.
A total of 829 Onmark member practices, consisting of single-site and multisite community-based oncology practices throughout the United States, received the emailed invitation to take the survey. Responses were received from 178 practices (21%). Of those, 171 practices identified their group type: 42 as multispecialty, 114 as hematology/oncology only, and 15 as gynecologic oncology only. Data were requested for calendar year 2005 or the practice's most recently completed fiscal year. Practices with multiple sites of service were instructed to report total data for all sites, with only one response accepted from each reporting practice.
After 1 week, the survey was closed. The data elements were formatted into an Excel (Microsoft Corp, Redmond, Washington) spreadsheet, and the appropriate formulas were run against the collected data elements. Some individual respondent surveys included questionable data elements, but no data were excluded from the analysis. The apparent outlier data are not thought to have materially affected the benchmark outcomes.
Survey results were categorized as financial and operational. Most benchmarks were reported at the mean and the 25th, 50th, and 75th percentiles. The complete survey report included 11 financial benchmarks and 10 operational benchmarks; this article will focus only on key operational benchmarks. These survey data are based on voluntary responses by Onmark member practices and may not be representative of all medical oncology practices in the United States.
Results
Physician Productivity
Physician productivity is generally measured by the number of patient encounters per FTE physician during a specified period. For this benchmarking survey, an FTE physician was defined as a physician who sees patients in the office or clinic a minimum of 4 days per week. (In this survey, we left the definition of FTE at “4 days per week” and did not stipulate how many hours per day the physician worked.) Each practice was asked to report the number of FTE physicians, as well as the number of FTE hematology/oncology physicians and the number of FTE gynecologic oncology physicians. (Practices were allowed to report fractional FTEs; ie, 4.5 or 3.8.)
New patient encounters are an important metric to determine physician productivity, as the volume of new patients drives virtually all practice activity—from staffing levels to the addition of new practice services. New patient encounters per FTE physician are also frequently used by medical oncology practices to determine when additional physicians should be added to the practice. The survey instrument identified new patients by CPT code4 and included new patients and consultations in the office setting as well as inpatient consultations using the codes noted in Table 1.
Table 1.
Codes for New Patient and Consultation Visits
| Code (range) | Type of Visit |
|---|---|
| 99201–99205 | Office/outpatient, new patient |
| 99241–99245 | Office/outpatient, consultations |
| 99251–99255 | Initial inpatient consultations |
The survey found that the mean number of new patients per FTE physician (including multispecialty, hematology/oncology, and gynecologic oncology physicians) was 265. The mean number for physicians in hematology/oncology only practices was significantly higher, at 300 patients.
The number of established patient visits per FTE physician is another important physician productivity indicator. Survey participants reported the number of established patient visits at the practice level in both the office and hospital settings using the codes noted in Table 2. Results showed that established patient visits per FTE physician (including multispecialty practice physicians) were 2,800 visits at the mean, with 1,003 visits at the 25th percentile and 3,925 visits at the 75th percentile. Results for hematology/oncology–only practices were higher, with a mean of 3,481 visits, and 1,375 visits at the 25th percentile and 4,616 at the 75th percentile.
Table 2.
Codes for Established Patient Visits
| Code (range) | Type of Visit |
|---|---|
| 99211–99215 | Office/outpatient, established patient |
| 99217–99223 | Hospital observation services |
| 99231–99236 | Subsequent hospital care |
| 99238–99239 | Hospital discharge services |
| 99261–99263 | Follow-up inpatient consultations |
| 99271–99275 | Confirmatory consultations |
| 99281–99285 | Emergency department services |
| 99291–99292 | Critical care services |
Staffing
Survey respondents were asked to indicate the number of FTE staff in their practices, defined as individuals working for 1 year at 40 hours per week, or 2,080 hours per year. Practices were instructed to calculate the number of FTE staff by dividing the number of hours worked per week by 40 for each staff member, then calculating the total number of FTEs in their practice.
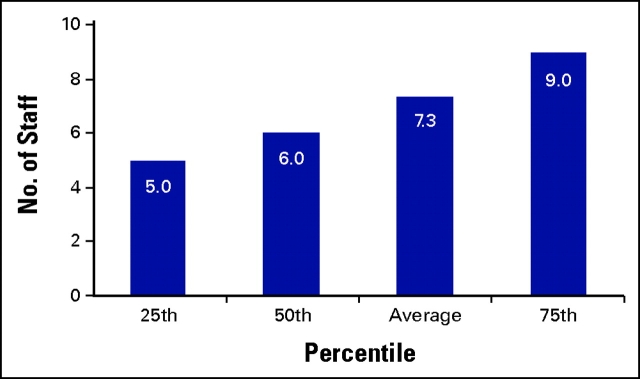
Hematology/oncology only practices reported five FTE staff per FTE physician at the 25th percentile, six FTE staff at the 50th percentile, and nine FTE staff at the 75th percentile (Fig 1). The average reported FTE staff per FTE hematology/oncology physician was 7.3. When the data were reported per FTE physician (including multispecialty practices), results showed a lower average, with 6.6 FTE staff per FTE physician.
Figure 1.
Total full-time equivalent (FTE) staff per FTE hematology/oncology physician.
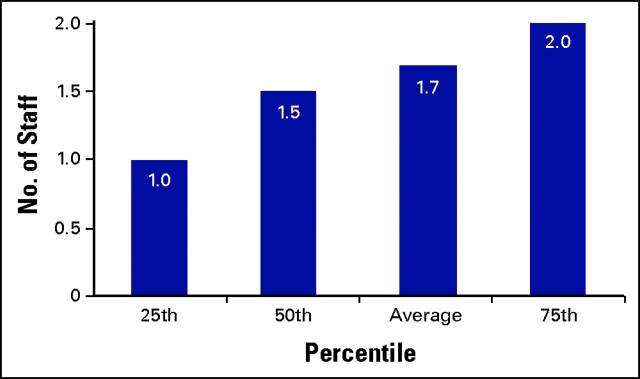
In addition to total FTE staff, respondents were asked to report the number of FTE registered nurses involved in chemotherapy administration. Practices in which nurses split their duties between chemotherapy administration and other tasks were asked to estimate the time spent by each nurse on chemotherapy administration and to calculate that as an FTE. They were then asked to add and report the total number of FTE nurses involved in chemotherapy administration. The survey found that the average number of FTE nurses administering chemotherapy per FTE hematology/oncology physician was 1.7, with a range of one FTE nurse at the 25th percentile to two FTE nurses at the 75th percentile (Fig 2).
Figure 2.
Full-time equivalent (FTE) chemotherapy nurses per FTE hematology/oncology physician.
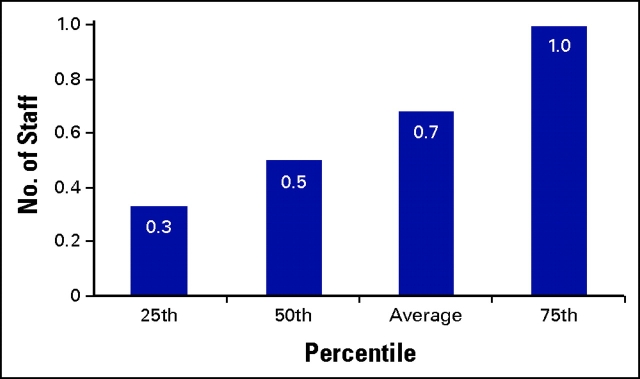
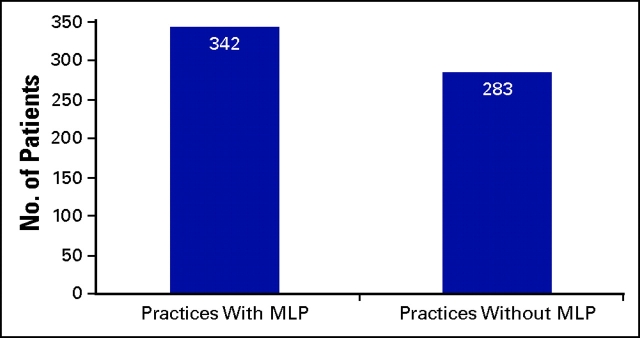
Survey respondents also were asked to identify the number of FTE midlevel providers in their practice. Midlevel providers were defined as health care professionals licensed by the state to provide certain services traditionally provided by physicians, including physician assistants and nurse practitioners. Results showed an average of 0.7 FTE midlevel providers per FTE physician (Fig 3). When the impact of midlevel providers on physician productivity was evaluated, the survey results indicated that physicians in hematology/oncology practices with midlevel providers see significantly more new patients per FTE physician than practices that do not utilize midlevel providers (Fig 4).
Figure 3.
Midlevel providers per full-time equivalent physician in 2005.
Figure 4.
New patients per full-time equivalent hematology/oncology physician in practices with and without midlevel providers (MLP).
Resource Utilization
Respondents were asked to indicate the total number of chemotherapy treatment chairs in their practice. These data were then used to calculate several benchmarks to measure resource utilization.
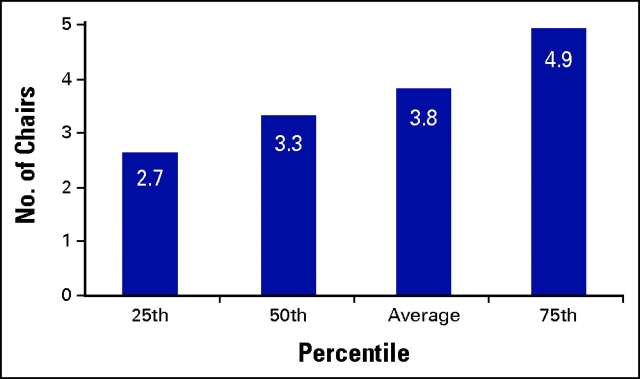
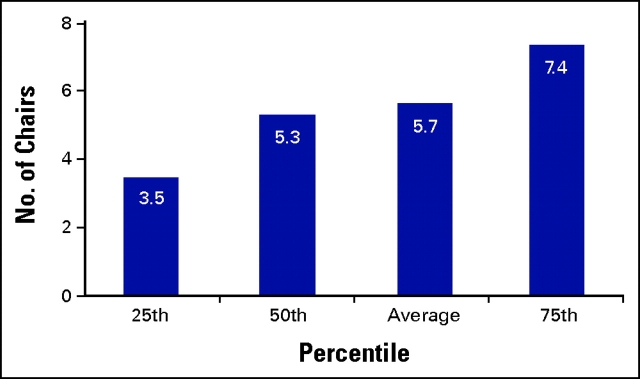
According to the survey results, the number of treatment chairs per FTE chemotherapy nurse ranged from 2.7 at the 25th percentile to 4.9 at the 75th percentile, with an average of 3.8 treatment chairs per FTE nurse (Fig 5). The number of treatment chairs per FTE medical oncologist ranged from 3.5 at the 25th percentile to 7.4 at the 75th percentile, with a mean of 5.7 (Fig 6).
Figure 5.
Treatment chairs per full-time equivalent chemotherapy nurse.
Figure 6.
Treatment chairs per full-time equivalent hematology/oncology physician.
Infusion patients per treatment chair per working day, and infusion patients per FTE nurse per working day also were calculated from survey data. The numerator for each of these metrics was determined by adding the number of initial drug administration codes (hydration, therapeutic, and chemotherapy) reported by the practice, using the 2005 code set: G0345, G0347, 90780, G0353, 90784, G0357, 96408, G0359, and 96410. Although this calculation does not capture total hours of treatment chair time, it is considered to be a surrogate for the number of patients in treatment chairs per day.
The number of patients per treatment chair per working day was calculated by dividing the total number of initial drug administration codes by the number of treatment chairs. This total, the number of initial drug administrations per treatment chair in 2005, was then divided by the number of working days in 2005 (250 days) to establish the number of initial drug administrations per treatment chair per working day. As a patient receives only one initial drug administration per chemotherapy encounter, the count of initial drug administrations is a reasonable surrogate for the count of individual patients. Results showed that patients per treatment chair per working day ranged from 0.6 at the 25th percentile to 1.6 at the 75th percentile, with a mean of 1.3 patients.
The number of infusion patients per FTE nurse per working day was calculated in a similar manner. The number of initial drug administration codes (not including injections or other services) was divided by the number of FTE nurses and then divided by the number of working days in 2005. Patients per FTE nurse per working day ranged from 2.1 at the 25th percentile to 5.8 at the 75th percentile, with a mean of 4.1.
Conclusion
Improving practice efficiency has become an essential component of managing today's medical oncology practice, as practices continue to experience the effects of the Medicare Modernization Act of 2003. Physician owners and practice administrators must continually evaluate and measure every aspect of practice operations. Benchmarking is a valuable tool to compare one's practice to regional or national standards and to evaluate practice performance over time.
It can be difficult for practices to find meaningful specialty-specific data to use in the benchmarking process. The metrics provided in this article include benchmarks that are frequently requested by practice administrators at meetings and on listservs, such as the number of staff per medical oncologist. Practices should use these easily measured benchmarks as a tool to assess themselves. After conducting their own measurements, practices should then identify and explore significant variances between their data and these national benchmarks. While variances do not necessarily indicate a problem, they do represent areas for further assessment and evaluation. This survey provides meaningful operational metrics by which practices can benchmark current performance and perhaps more importantly, trend practice improvements over time. Practices that use this tool, and others as they are available, will be the successful practices of the future.
Footnotes
Current Procedural Terminology (CPT) is copyright 2005 American Medical Association. All Rights Reserved. No fee schedules, basic units, relative values, or related listings are included in CPT. The AMA assumes no liability for the data contained herein. Applicable FARS/DFARS restrictions apply to government use.
References
- 1.Medicare Prescription Drug, Improvement, and Modernization Act of 2003. Pub L No. 108–173, 117 Stat 2066; 2003
- 2.Medicare Payment Advisory Commission: Report to the Congress: Effects of Medicare Payment Changes on Oncology Services. Available at http://www.medpac.gov/publications/congressional_reports/Jan06_Oncology_mandated_report.pdf. Accessed October 15, 2006
- 3.Cost Survey for Single-Specialty Practices, 2006 Report Based on 2005 Data. Medical Group Management AssociationEnglewood, CO, 2006
- 4.CPT 2006 Current Procedural Terminology, Professional Edition. Chicago, IL, American Medical Association, 2005


