As community-based oncology practices continue to adjust to changes made by payers, both government and private, the metrics needed to assess business changes become increasingly more important. A January 2007 Report to Congress by the Medicare Payment Advisory Commission (MedPAC) stated that “physicians reorganized their practices to become more efficient and control costs by obtaining lower prices on drugs,” and “all practices made at least some changes to lower their expenses, particularly their drug and staffing costs.”1
In 2006, Onmark, an Oncology Therapeutics Network (OTN) company, conducted the Office-Based Oncology Business Benchmarking Survey, and reported highlights of the results in the Journal of Oncology Practice.2 Recognizing that community-based oncology has a strong desire to monitor and trend the key practice indicators (KPIs) that were established last year, the company conducted the second annual Business Benchmarking Survey in Spring 2007. The oncology-specific business benchmarks contained in this article update these KPIs and also compare the 2007 survey results with those from 2006.
Onmark is one of the largest group purchasing organizations in the community-based treatment setting, with more than 2,400 members representing more than 4,000 physicians and more than $6 billion in annual drug purchases. As with the 2006 survey, Oncology Metrics LLC was commissioned to conduct the survey and report the results to ensure that the identity of the participating oncology practices was kept confidential.
To provide comparative results, the operational and financial benchmarks remained essentially the same as last year. One specific addition to this year's report is the metric of established patient visits per full-time equivalent (FTE) medical oncologist per year. This was included to help validate physician workload as it relates to new patients per FTE medical oncologist per year. An optional section was also added to the 2007 survey that included questions about staffing and staff compensation. This year's report in the Journal of Oncology Practice includes both business operational and financial benchmarks.
Methods
The survey methods were generally unchanged from those used in the 2006 report on 2005 data.2 The survey was designed to be simple to complete, and virtually all questions from the 2006 survey were repeated in 2007.
Approximately 1,300 Onmark member practices were invited to participate in the 2007 survey. This target audience was notified by e-mail that the survey instrument was available, and the e-mail included a link to the survey site. Data were received from 164 practices, a response rate of 13%. When asked to identify their group type, the majority of respondents (124 practices) classified themselves as hematology/oncology only.
The 2007 survey instrument was divided into three sections and included a total of 36 questions: part A, General Medical Practice Information with 16 questions; part B, Medical Oncology Collections in 2006 with 14 questions; and Part C, Medical Oncology Only Operating Costs.
The report of the 2006 survey results included responses from all sites that contributed data on specific points in the analytic data set. For the 2007 report, sites that provided implausible data were excluded. Examples include a practice that entered the same amount for total revenue and for cost of drugs, entered revenue from discrete payer sources totaling more than total revenue reported, and reported new patient consults totaling more than 1,000 per physician in a year. Even with the exclusion of obviously incorrect data, there remained a significant difference between the average and median for several metrics. This suggests that there are additional data anomalies and/or reporting inconsistencies.
Consistent with the 2006 survey, the reporting format characterized the metrics as financial or operational, with most metrics reported at the 25th, 50th, and 75th percentile, and the average. No effort was made to audit the data submitted, other than to omit data points as previously discussed. The survey data, which are limited to Onmark member practices, may not be representative of all medical oncology practices in the United States.
Key Practice Indicators: Operational
Staffing
Survey participants were asked to report the number of FTE staff in several categories. A FTE staff member was defined as one that works 1 year at 40 hours per week, or 2,080 hours per year. Participants were instructed to divide the number of hours worked per week by 40 to calculate the FTE status. This definition was used consistently for all staff categories.
Consistent with the 2006 survey, an FTE physician was defined as one who sees patients in the office or clinic 4 days per week (the number of hours per day that the physician worked was not stipulated). Practices reported the number of FTE physicians as well as the number of FTE hematology-oncology physicians and FTE gynecologic physicians. Many of the metrics presented here are reported per FTE hematology-oncology physician (FTE Hem-Onc).
Practices in this survey population reported a slight increase in FTE staff per FTE Hem-Onc in 2006 as compared to 2005 (Fig 1A). At the 25th percentile, results were identical for 2005 and 2006, at 4.3. At the average, there was a slight increase from 6.6 in 2005 to 7.8; this increase is more pronounced at the 75th percentile, with 8.0 FTE staff/FTE Hem-Onc reported in 2005, and 9.4 in 2006. These results are consistent with 2005 data reported by the Medical Group Management Association, which showed 7.4 FTE staff at the median and 9.5 at the 75th percentile.3
Figure 1.
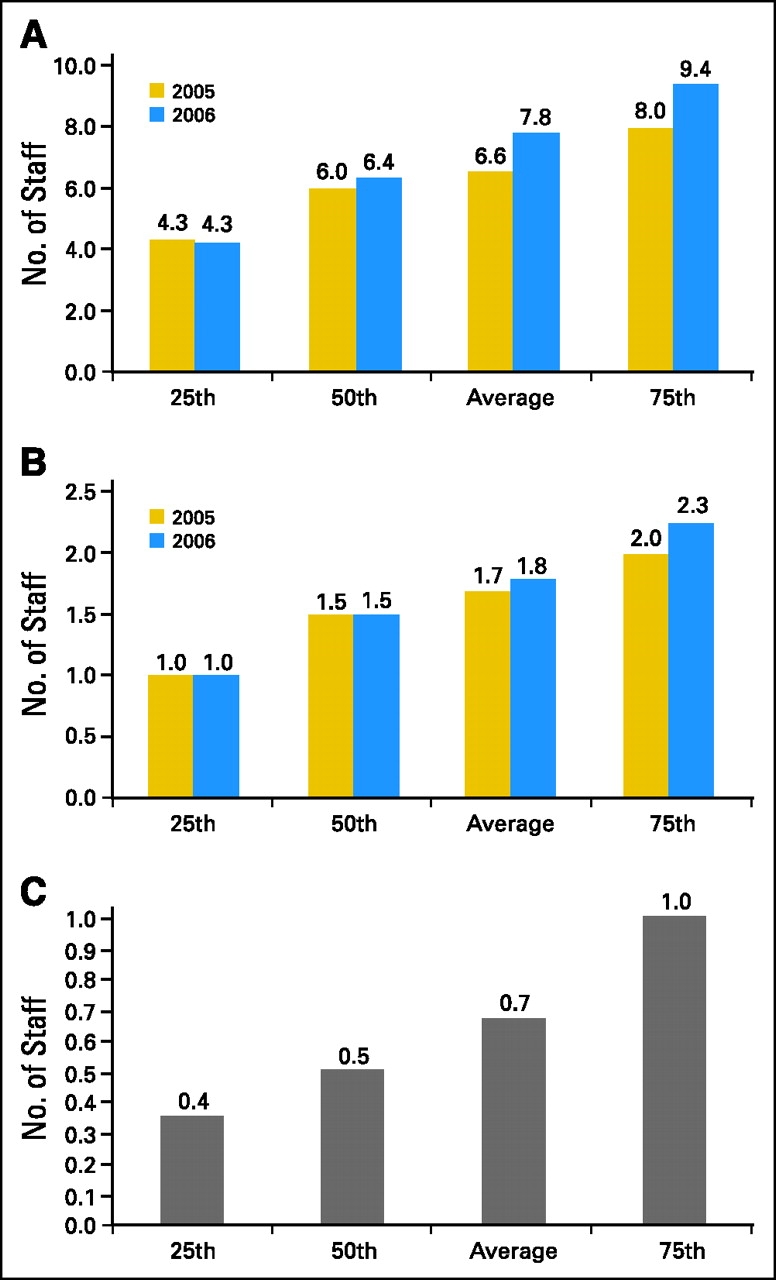
(A) Full-time equivalent (FTE) staff/FTE hematology-oncology physician (Hem-Onc); (B) FTE chemotherapy nurse/FTE Hem-Onc; (C) midlevel providers/ FTE Hem-Onc.
Survey respondents were asked to report the number of FTE registered nurses involved in chemotherapy administration. Practices in which the nurses split their time between chemotherapy administration and other duties were asked to estimate the time each nurse spent in chemotherapy administration and report the total number of FTE nurses based on this estimate. 2006 data on this metric were virtually identical to data reported in 2005. Figure 1B shows 1.5 FTE chemotherapy nurses/FTE Hem-Onc at the 50th percentile in 2006, and an average of 1.8 in 2007.
Participating practices were asked to report the number of midlevel providers working in their practice. A midlevel provider was defined as a health care professional licensed by the state to provide certain services traditionally provided by physicians. Nurse practitioners and physician assistants were identified as midlevel providers commonly employed by oncology practices; 47% of survey respondents reported having midlevel providers on staff and reported an average of 0.7 midlevel providers per FTE Hem-Onc (Fig 1C). These data were unchanged from 2005.
Productivity
Survey participants were asked to report the number of services rendered in several categories based on CPT codes.4 Data were collected on new patient encounters and established patient visits. New patient encounters were measured using CPT codes for new patient visits and consultations in both the office and inpatient hospital setting (codes 99201 to 99205, 99241 to 99245, and 99251 to 99255). 2006 data revealed a marked increase in the number of new patients per FTE Hem-Onc (Fig 2A), with an increase at the 50th percentile from 288 in 2005 to 343 in 2006, and a comparable increase from 300 in 2005 to 363 in 2006 at the average.
Figure 2.
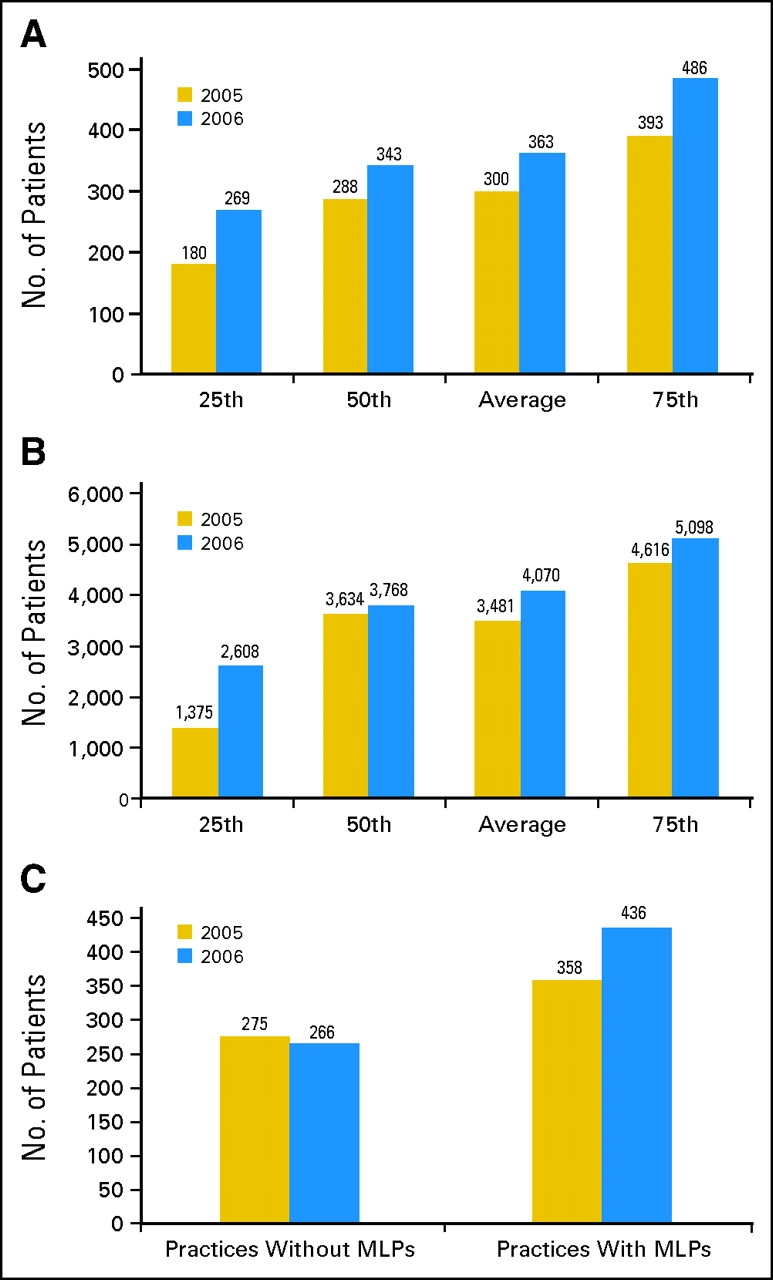
(A) New patients/full-time equivalent hematology-oncology physician (FTE Hem-Onc); (B) established patient visits/FTE Hem-Onc; (C) impact of midlevel providers (MLPs) on physician productivity.
Similarly, the number of established patient visits per FTE Hem-Onc increased from 2005 to 2006 (Fig 2B). Established patient visits were reported in both the office and hospital settings using CPT codes 99211 to 99215, 99217 to 99223, 99231 to 99236, 99238 to 99239, 99281 to 99285, and 99291 to 99292. At the 25th percentile, 1,375 established patient visits/FTE Hem-Onc were reported in 2005 compared with 2,608 in 2006, with an average of 3,481 visits in 2005 and 4,070 visits in 2006.
Survey results continue to indicate that practices with midlevel providers are able to see significantly more new patients than practices that do not work with midlevel providers. Practices without midlevel providers reported an average of 275 new patients/FTE Hem-Onc in 2005 and 266 in 2006 (Fig 2C). Practices with midlevel providers reported an average of 358 new patients/FTE Hem-Onc in 2005 and 436 in 2006, an increase of 64% over practices without midlevel providers.
Key Practice Indicators: Financial
Accounts Receivable
Survey participants were asked to report their adjusted (collectible) accounts receivable. This was defined as the “total accounts receivable as of December 31, 2006, that you expect to be collected” and further defined as “your total billed charges less all collections less all contractual adjustments less your expected bad debt.” These data were used to calculate average days in accounts receivable (days in A/R), which indicates the average time it takes a practice to collect money due on billed charges. Days in A/R was calculated as follows: adjusted accounts receivable/(total collections/254 working days).
Note that this calculation was made using working days rather than calendar days. Calendar days can also be used, but results will be approximately 30% higher. Readers should reconcile their formula for this calculation with the survey formula before benchmarking to this metric.
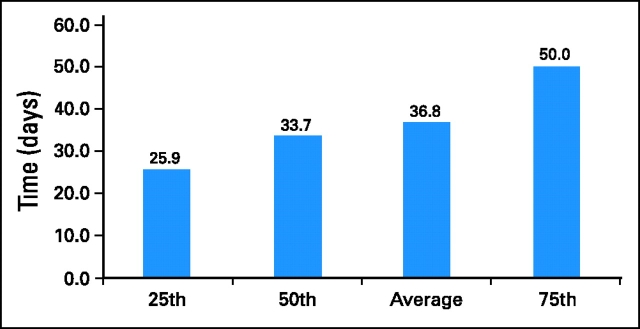
Several practices reported data that resulted in what the authors perceived to be nonsensical results for days in A/R, and after analysis, these data were excluded. The median of 33.7 days and mean of 36.8 days are considered to be accurate representations of days in A/R and represent current best practices in the industry (Fig 3).
Figure 3.
Days in accounts receivable.
Revenue Mix
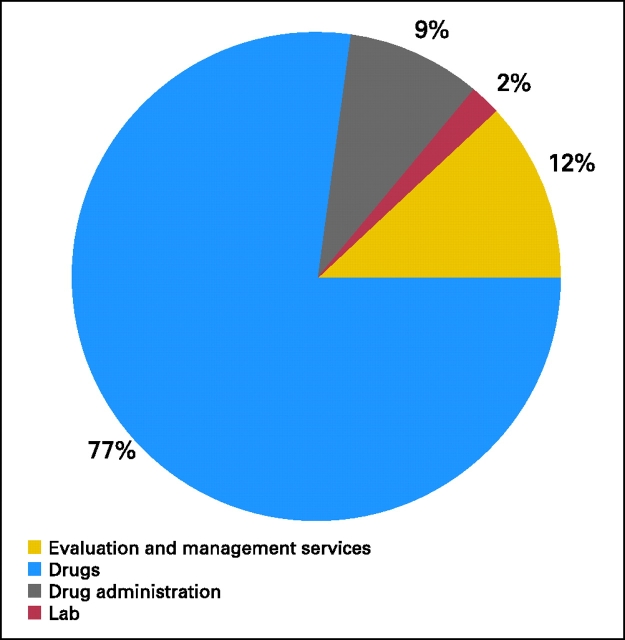
Revenue mix was reported based on collected revenue (Fig 4). Drugs continued to dominate the revenue mix in medical oncology practices, at 77%, up from 73% in last year's survey data. Drug administration services represented 9% of the revenue mix in 2006, down from 10% in 2005, and evaluation and management services represented 12%, down from 15% in 2005.
Figure 4.
Revenue mix.
Drugs
Figure 5A shows the cost of drugs per FTE Hem-Onc in 2005 and 2006. These data revealed an increase in the cost of drugs per FTE Hem-Onc of approximately 20% from 2005 to 2006 at the 50th percentile and the average. Drug cost as a percentage of total cost (Fig 5B), however, showed a less dramatic increase, rising from 60.6% to 64.6% at the 50th percentile. This suggests that practice costs other than drugs have also increased, keeping pace with rising drug costs. After drug costs, the largest component of practice expense was salary expense; it is reasonable to expect that cost increases in that category are likely to account for much of the observed cost increase.
Figure 5.
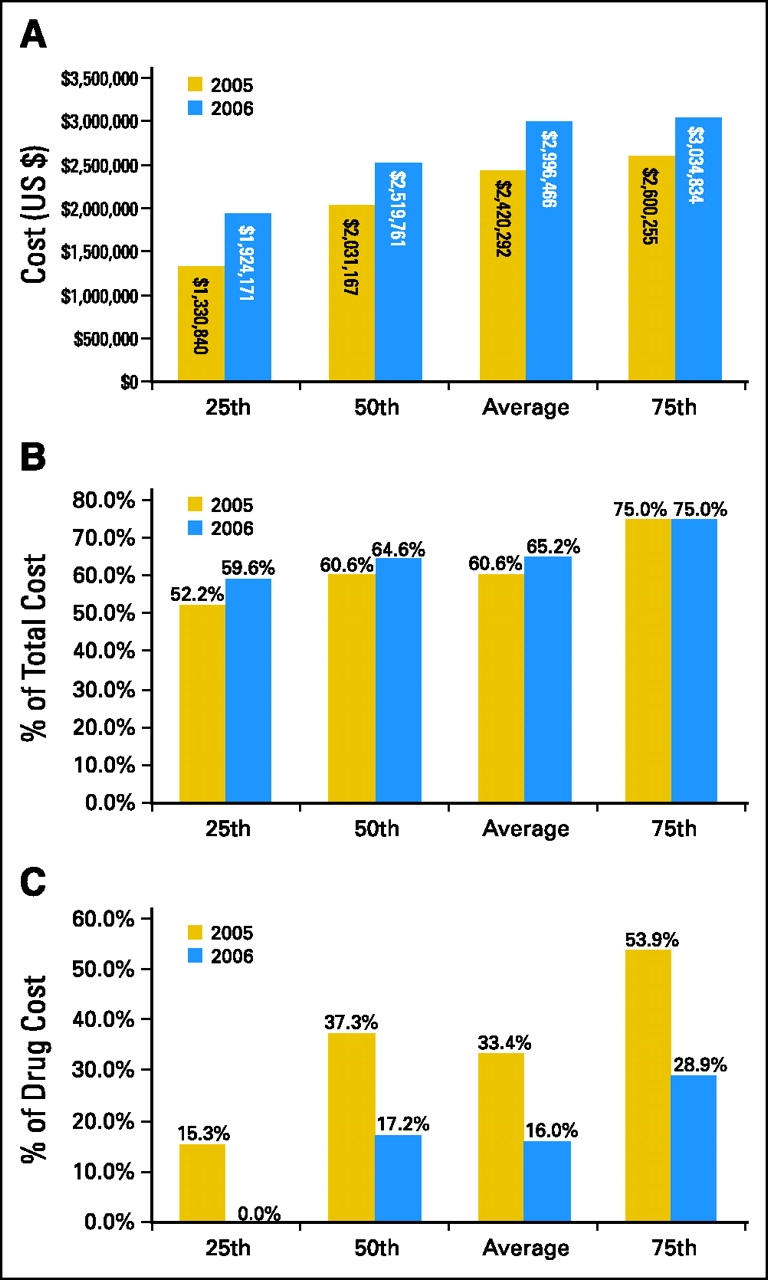
(A) Cost of drugs/full-time equivalent hematology-oncology physician; (B) drug cost as percent of total cost; (C) drug margin as percent of drug cost.
Figure 5C depicts a dramatic decrease in reported drug margin as a percentage of drug cost in 2006. This metric is reported across all payers and showed a decrease from 37.3% in 2005 to 17.2% in 2006 at the 50th percentile, and a similar decrease from 33.4% in 2005 to 16.0% in 2006 at the average. As the impact of cost transparency of drugs increases, it is reasonable to expect that the rate of erosion of drug margin will slow. The present media focus on manufacturer rebates may lead to reforms that will ultimately result in additional declines in drug margin. Continued and/or accelerated loss of marginal revenue is likely to impact clinical operations.
Conclusion
There is no doubt that improving practice efficiency continues to be an essential component of managing today's community-based medical oncology practice. As the private payer sector adopts some of the government payment policies and methodologies, physician owners and practice administrators must continually evaluate and measure every aspect of practice operations. Benchmarking is a valuable tool to compare one's practice to regional or national standards and to evaluate practice performance over time.
The metrics provided in this article not only update earlier findings, but also should begin the process of developing trends of the results. Practices should use these easily measured benchmarks as a tool for self-assessment. After conducting their own measurements, practices should then identify and explore significant variances between their data and these national benchmarks. While variances do not necessarily indicate a need for corrective action, they do represent areas for further assessment and evaluation. Those that use this tool and others as they become available will help ensure that they will be the most successful practices of the future.
Reference
- 1.Medicare Payment Advisory Commission Report to the Congress: Impact of Changes in Medicare Payments for Part B Drugs. http://www.medpac.gov/publications/congressional_reports/Jan07_PartB_mandated_report.pdf
- 2.Akscin J, Barr TR, Towle EL: Benchmarking practice operations: Results from a survey of office-based oncology practices. J Oncol Pract 3:9-12, 2007 [DOI] [PMC free article] [PubMed] [Google Scholar]
- 3.Cost Survey for Single-Specialty Practices, 2007 Report Based on 2005 Data, Englewood, CO, Medical Group Management Association, 2006
- 4.CPT 2006 Current Procedural Terminology, Professional Edition. Chicago, IL, American Medical Association, 2005


