Short abstract
Long-term trends in the cost of pharmaceutical goods purchased by community oncology practices seem to have dramatically changed in 2007, potentially ending an era of practice growth built on the economic engine of in-office chemotherapy provision.
Long-term trends in the cost of pharmaceutical goods purchased by community oncology practices seem to have dramatically changed in 2007, potentially ending an era of practice growth built on the economic engine of in-office chemotherapy provision. These same data support the hypothesis that many practices have and continue to respond to this economic challenge by adding nonphysician practitioners, electronic medical record systems, or both, to better leverage physician time. This trend seems consistent with the predictions of economic theory and may presage opportunity for better, more efficient clinical operations that will lower the cost of care and so improve value.
Background
There have been several notable benchmarking efforts in community oncology over the years. The Medical Group Management Association (MGMA), a professional association that includes medical practice managers and administrators from all medical specialties throughout the United States, conducts a comprehensive annual cost survey that reports key practice business indicators and related benchmarks. The Assembly of Oncology and Hematology Administrators, an MGMA specialty assembly, developed additional survey questions to report benchmarks specifically for oncology-hematology and published an oncology-specific survey report for 2000,1 2002,2 and 2003.3 Subsequent oncology survey data has been published in this journal for 20054 and 2006.5 This article brings forward several benchmarks from all of these prior works and describes the results of a 2007 survey conducted by Oncology Metrics, llc. These benchmarks across time are notable for how some have changed rapidly while others are moving more slowly. The conclusion of the article points the way to new benchmarking that links the managerial information available in the practice management system with the growing body of clinical information available in electronic repositories. The significant progress from 2000 through 2007 in producing useful benchmarking that is relevant to management of the modern oncology enterprise is likely to be eclipsed as reliable clinical information at the patient, practice, and physician levels is linked to financial information at the regimen and payer levels.
Methods
The National Practice Benchmark survey was developed and conducted by Oncology Metrics, llc. The survey was open to all oncology practices in the United States, and over 2000 oncologists and practice administrators were invited to participate. Participation was solicited by e-mail, and the survey was completed entirely online. Practices were instructed to submit only one survey per practice, and the results were reviewed to eliminate duplicate responses. Practices were not required to complete all questions, and data from incomplete surveys were included in the final survey results.
The survey requested data for calendar year 2007 or the most recently completed 12-month accounting period and included 42 questions in four sections. Section 1 provided an introduction and instructions; section 2 collected practice demographic information; section 3 requested financial and operational data; and section 4 collected procedure and service data. A total of 274 practices from 44 states submitted data for the National Practice Benchmark, with the numberof responses to individual questions varying from 46 to 274. The majority of responding practices (87%) identified themselves as physician owned, with 10% reporting hospital ownership, and 3% reporting management company ownership. Data was submitted by hematology-oncology single specialty practices as well as by multispecialty practices.
In addition to a complete survey report, incentives for participation included gift cards for the first 125 participants that completed sections 2 and 3 of the survey and entry in a drawing for an Apple iPhone for those completing sections 2, 3, and 4. The latter group was also provided with a personalized practice benchmarking report, comparing practice results with the survey averages.
Trends and Changes to Trends
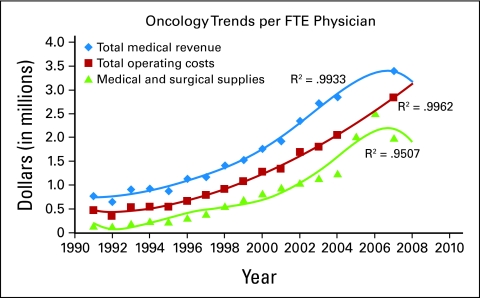
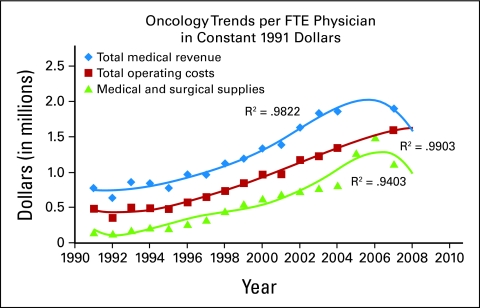
Information presented in Figure 1 tracks total medical revenue, total practice expense and the cost of medical and surgical supplies (predominantly drugs) on a per full-time equivalent (FTE) physician basis from 1991 to 2007. Figure 2 presents these same data but in constant 1991 dollars. The values in Figure 2 were calculated by applying the sum of the annual inflation rates for individual years between the reference year, 1991, and the reported year. The inflation rate figures used were obtained from Financial Trend Forecaster–InflationData.com, as published at www.miseryindex.us.
Figure 1.
Oncology trends per full-time equivalent (FTE) physician.
Figure 2.
Oncology trends per full-time equivalent (FTE) physician in constant 1991 dollars.
The data have been compiled from MGMA surveys, the Onmark surveys published previously in the Journal of Oncology Practice, and from the 2007 Oncology Metrics National Practice Benchmark. A remarkably long trend may be over; 2007 is the first year where the amount spent for drugs declined. Notably, total operating costs continued to climb, as did total revenue. The lines that were fit to these data are fifth-order polynomial equations, and some readers will correctly note that given enough variables, a good fit can be achieved to most data. Still, the rate of change of these three trends looks to be real. Each trend has been projected for 1 year revealing the dramatic intersection of revenue and expense in 2008. Certainly, the financial impact of the reduction in the use of erythropoietic-stimulating agents is a likely contributor to this observed decline in spending for drugs and collected revenue. What does this mean to the financial and operational reality of the individual practices that are the core of the oncology delivery system?
Financial and Operational Conditions in Oncology Practices
When looking at either Figure 1 or Figure 2, it is obvious that 2008 will be a challenge as rising costs meet declining revenue. Will there be mass closings of oncology practices? There are two common business structural elements present in most community oncology practices that suggest that won't happen—low capitalized debt and cash-basis accounting.
Most medical oncology practices have almost no capitalized equipment in their operations and so have a very low debt burden. That is not to say that they don't have large accounts payable, as many practices do for the chemotherapy drugs that they administer. But this is a trade account and terms can be reached in most cases to sustain the business entity. Drug distributors have a real stake in keeping their customers in business. Generally, this debt won't force an oncology practice to close.
Almost every physician-owned oncology practice uses the cash basis for accounting and for tax purposes. Cash-basis accounting records revenue when it is actually received and expenses only when they are paid. Physician-owned oncology practices generally operate on a break-even basis each year. Any money that is in the practice bank account at the end of the year is distributed to the owners of the business as a pay bonus, part of the overall physician compensation for the year. This pay bonus is an expense to the practice business entity, and this eliminates any tax liability at the practice level, although taxes are paid personally by the physician so this is not a tax avoidance strategy.
We would suggest that the effect of this accounting convention blends two distinct sources of compensation to the physician owners in oncology practices. The first portion of compensation is the amount earned for the performance of physician services, generally paid as a monthly salary. The second portion of the combined compensation is earned as a business owner for efficient business management and for the risk taking associated with any small business. In oncology practices, this risk taking is directly related to the procurement and management of high-cost drugs. The trend lines in Figures 1 and 2 show a significant decrease in total medical revenue with a continued increase in total operating costs for 2008, resulting in less cash for distribution to the physician owners as compensation. It is the second portion of the physician paycheck—the business owner portion—that is likely to go down. We don't mean to trivialize the impact to the individual physician owner of this loss of income—lower pay for any reason is not easy to accept. But the opportunity for the oncology physician to find a job working for another business owner that will pay both components of the former compensation, clinical service provision, and business risk and management, is very low. For the physician employee, the decision of where to work is a relatively simple mix of payment received for work produced, in addition to job satisfaction and quality of life. For the physician owner, the decisions are more complex. We expect most physician owners to continue to work in their own business and to accept that the financial benefits of ownership are not what they once were. But the owner's mind will naturally turn to ways to restore the rewards associated with business ownership. What needs to be done to improve quality, lower cost, and grow revenue?
New Patients/FTE Physician
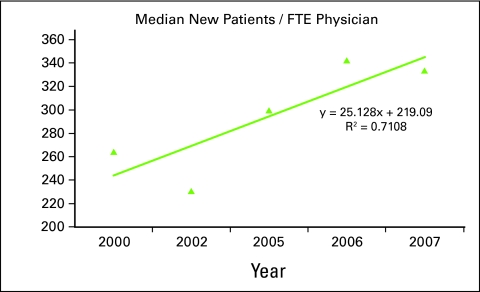
Oncology practice management involves three distinct domains of activity: clinical, operational, and financial. The most powerful benchmark, at the intersection of these three domains, is the rate of new patient accrual at the physician level. This is important because new patients drive clinical progress in both patient accruals to clinical trials and in the development of a robust clinical body of knowledge and experience. Additionally, treatments provided to these patients provide the operational throughput needed for efficient production of the clinical services and produce the revenue necessary to sustain the enterprise. In 2000, the Assembly of Oncology and Hematology Administrators/MGMA survey reported a median of 264 new patients per physician per year with 26 practices reporting. In 2002 the number of reporting practices grew to 42, and the median number of new patients treated per FTE physician fell to 231. Surveys published since then have not reported the number of practices contributing to that benchmark but did show growth to 300 and 343 new patients per physician per year. In the National Practice Benchmark, 57 practices reporting this data indicate a median of 334 new patients per physician in 2007. The r-value of the trend line is fairly high and the equation shows growth of approximately 25 patients per year per physician during the period. This data is shown in Figure 3.
Figure 3.
Median new patients per full-time equivalent (FTE) physician, 2000 to 2007.
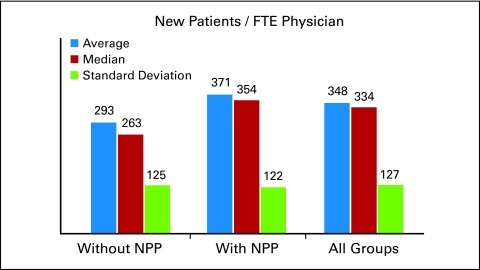
The 2007 data is the largest cohort of practices yet surveyed and offers the opportunity to look at new patients per FTE physician in a number of ways. Figure 4 supports earlier presented data5 and the prior observation that when physicians work with nonphysician practitioners (NPPs), significantly more new patients are seen per FTE physician. Studying the sample population as a whole and then in cohorts of practices with and without NPPs, the underlying distribution of each separate cohort is very similar to the complete sample. This similarity, shown in Figure 4, is reflected in the consistent standard deviation in the three cohorts.
Figure 4.
New patients per full-time equivalent (FTE) physician, with and without nonphysician practitioners (NPPs).
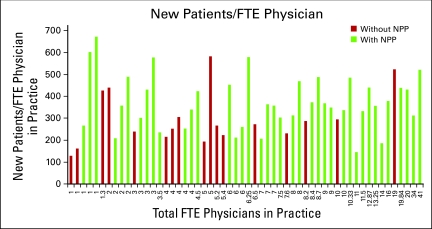
Figure 5 shows a distribution of practices on the horizontal axis in increasing practice size as measured by the number of FTE physicians; and the vertical height of the bar is the number of new patients seen per FTE physician in 2007. The presence of NPPs does not appear to be correlated with practice size.
Figure 5.
New patients per full-time equivalent (FTE) physician, with and without nonphysician practitioners (NPPs), arrayed by practice size.
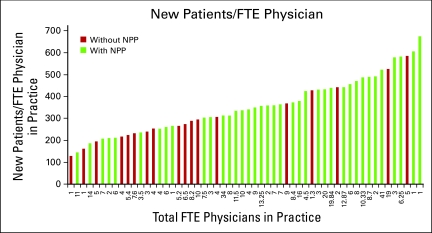
Figure 6 is the same data as presented in Figure 5, with the horizontal axis representing the number of FTE physicians in each practice, but now this data is arranged lowest to highest number of new patients per FTE physician. Again, the even distribution of practices without NPPs along the horizontal axis reveals that NPPs, while correlated with higher numbers of new patients per FTE physician, are not necessary to achieve these numbers.
Figure 6.
New patients per full-time equivalent (FTE) physician, with and without nonphysician practitioners (NPPs), arrayed by number of new patients.
We believe that the 2007 data support a hypothesis that NPPs are effectively utilized in practices where underlying demand for clinical services is the driver that causes the addition of these staff. This demand is independent of practice size. The relative density of practices with 250 to 300 new patients per year that do not have NPPs may suggest a sustainable plateau of production at that level of new patient management. The dominance of practices with NPPs which are seeing more than 400 new patients per year per FTE physician seems, at least in this data sample, to support the necessity of NPPs above that level of new patient accrual.
These data show that it is usual to find NPPs in community based oncology practices that are seeing more than 400 new patients per physician per year. Financial pressures will reinforce this trend in 2008.
Electronic Medical Record Systems
In Figure 3 we note that the median number of new patients per FTE physician is rising, and in Figure 6 we see that the use of NPPs appears to be nearly universal when practices have over 400 new patients per FTE physician per year. Electronic medical record systems (EMR) offer a technology solution to the production problem. In an interview in Health Affairs,6 Clayton Christensen, a professor at Harvard Business School, argues that the answer for more affordable health care will come with innovations that aim to make more and more areas of care cheaper, simpler, and more in the hands of patients, what he calls “disruptive innovation.” “I think there are … medical problems … amenable to precise diagnosis, which then enables rules-based therapy. And I actually would put even cancer in that category, in that I bet you fifteen years from now, most cancers—which at this point seem to be just very nonstandard and expertise-intensive to diagnose and treat—have the potential to become rules based. So it's that class of rules-based acute diseases, I think, that are most amenable to a disruptive approach.”6 He further states that “LASIK surgery [laser-assisted in situ keratomileusis] follows a very clear disruptive-innovation paradigm in that the ‘skill’ has moved from an eye surgeon to a machine. While you still need a high-cost person to do a diagnosis, the bulk of the work has been completely routinized.”
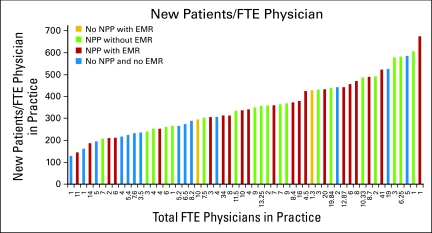
We believe that the data continue to show that the marketplace of surveyed oncology practices is reacting to lower reimbursement by seeking lower costs. In Figure 7, we look again at the presence or absence of NPPs in conjunction with the number of new patients per FTE physician, shown previously in Figure 6, but now with the added dimension of the presence of an EMR. Both the NPP and the EMR can be seen as innovations to increase the ability of practices to utilize the “high-cost person to do the diagnosis,” as Christensen suggests, by facilitating patient management in other areas of the practice.
Figure 7.
New patients per full-time equivalent (FTE) physician, with and without nonphysician practitioners (NPPs) and electronic medical record systems (EMRs).
In Figure 7, the red bars represent practices of any size that have both NPPs and an EMR. These bars dominate the right portion of the figure, where higher numbers of new patients per physician are represented. Conversely, the blue bars, where neither a NPP nor an EMR is utilized, are more prevalent on the left, lower new patient portion of the figure. There are only two instances where the practice has elected to implement the EMR first (represented by the yellow bars), in the absence of a NPP. Adding NPPs before or in conjunction with an electronic medical record, would seem to be a reasonable, stepwise approach to the problem of how to increase the ability of the practice to maximize the valuable cognitive work of the physician.
Survey Results
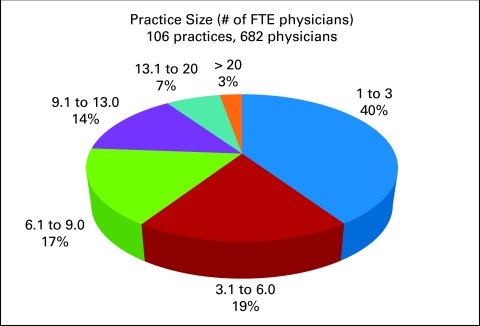
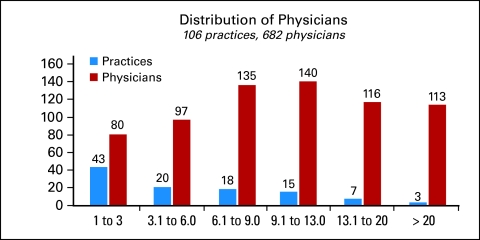
One hundred six reporting practices representing 682 physicians provided detailed information about the number of FTE physicians in the practice. This data is provided in Figure 8. Fifty-nine percent of survey respondents reported six or fewer FTE physicians in the practice and 31% reported seven to 13 FTE physicians. The distribution of physicians by practice size in the data set is presented in Figure 9.
Figure 8.
Practice size. Number of full-time equivalent (FTE) physicians.
Figure 9.
Distribution of physicians by practice size.
Finally, Table 1 provides a summary of many of the results from the National Practice Benchmark, at both the median and the average. The count indicates the number of responses to each particular data point in the survey. Many practice management consultants recommend benchmarking and development of a practice dashboard for management purposes. These results are provided for readers to use in their own practice benchmarking exercise.
Table 1.
Key Results From the 2007 National Practice Benchmark
| Benchmark | Median | Average | Count |
|---|---|---|---|
| New patients per FTE hem onc | 308.41 | 361.01 | 45 |
| Revenue per FTE hem onc | $3,632,141 | $4,159,702 | 84 |
| Chemotherapy administrations per FTE staff in department per year | 711 | 791 | 67 |
| Drug revenue per FTE hem onc | $2,485,294 | $2,818,580 | 78 |
| Drug cost per FTE hem onc | $2,000,397 | $2,019,970 | 66 |
| Drug margin per total revenue | 11.4% | 12.3% | 65 |
| Drug cost per total cost | 67.4% | 63.2% | 75 |
| FTE staff per FTE physician | 6.1 | 7.6 | 98 |
| Revenue per new patient | $11,895 | $11,645 | 58 |
| E & M revenue per FTE physician | $297,811 | $329,531 | 67 |
| Drug margin per FTE hem onc | $466,136 | $525,596 | 54 |
Abbreviations: Count, number of responses to each particular data point in the survey; FTE, full-time equivalent; hem onc, hematology and oncology physician; E & M, evaluation and management.
Conclusion
These data, revealing as they are, beg for answers to the clinical significance of the changes that we observe in the operational and financial results. Is quality of care affected when the average number of new patients seen in a year by a medical oncologist goes from 250 to 350 or higher? Does erythropoiesis-stimulating–agent reduction result in more dose delays and dose reductions, and if so, are important therapeutic end points harmed by that reduction? To answer questions like these, the data available from the practice management system must be linked to data in the EMR for individual patients. This matching of clinical and financial data can best, and perhaps only, be accomplished at the practice level and only in practices with a fully integrated electronic medical record. Today there are a limited number of practices with this capability, but in these practices, the clinical and financial data taken together provide an opportunity to measure the quality, and sometimes the quantity, of life gained or lost through interventions. The cohorts of these therapies which offer the greatest value in terms of cost and benefit are the common ground where patients, physicians, and payers who are affected by cancer can agree.
References
- 1.Medical Group Management Association: Cost survey for Hematology/Oncology Practices: 2001 Report Based on 2000 Data. Englewood, CO, Medical Group Management Association, 2001
- 2.Medical Group Management Association: Cost Survey for Hematology/Oncology Practices: 2003 Report Based on 2002 Data. Englewood, CO, Medical Group Management Association, 2003
- 3.Medical Group Management Association: Cost Survey for Hematology/Oncology Practices: 2004 Report Based on 2003 Data. Englewood, CO, Medical Group Management Association, 2004
- 4.Akscin J, Barr TB, Towle EL: Benchmarking practice operations: Results from a survey of office-based oncology practices. J Oncol Pract 3:9-12, 2007 [DOI] [PMC free article] [PubMed] [Google Scholar]
- 5.Akscin J, Barr TB, Towle EL: Key practice indicators in office-based oncology practices: 2007 report on 2006 data. J Oncol Pract 3:200-203, 2007 [DOI] [PMC free article] [PubMed] [Google Scholar]
- 6.Smith MD: Disruptive innovation: Can health care learn from other industries? A conversation with Clayton M. Christensen. Health Affairs 26:w288-w295, 2007 [DOI] [PubMed] [Google Scholar]


