Abstract
The accurate computational prediction of transcription start sites (TSS) in vertebrate genomes is a difficult problem. The physicochemical properties of DNA can be computed in various ways and a many combinations of DNA features have been tested in the past for use as predictors of transcription. We looked in detail at melting temperature, which measures the temperature, at which two strands of DNA separate, considering the cooperative nature of this process. We find that peaks in melting temperature correspond closely to experimentally determined transcription start sites in human and mouse chromosomes. Using melting temperature alone, and with simple thresholding, we can predict TSS with accuracy that is competitive with the most accurate state-of-the-art TSS prediction methods. Accuracy is measured using both experimentally and manually determined TSS. The method works especially well with CpG island containing promoters, but also works when CpG islands are absent. This result is clear evidence of the important role of the physical properties of DNA in the process of transcription. It also points to the importance for TSS prediction methods to include melting temperature as prior information.
INTRODUCTION
Despite improvements in accuracy in recent years, the prediction of vertebrate transcription start sites (TSS) remains an open problem in computational biology. Experimentally determined CAGE tags (1) have shown that many start sites are not predicted with these methods. Current methods use a mixture of motif, compositional and structural features in conjunction with various statistical and machine learning techniques. There is growing evidence that structural parameters alone may be sufficient, in some cases, for TSS prediction (2,3). Specifically, the use of both base-stacking energies (3) and DNA flexibility calculations (2) for successful predictions underlines the importance of helix stability in the promoter region for successful transcription. In this paper we look at the use of one such stability measure, DNA melting temperature, for TSS prediction.
In order for transcription and replication to take place, the two strands of the DNA must be separated. This process is known as melting, because the double-helix unwinds with increasing temperature. This transition from single to double-stranded DNA is a highly cooperative process; consecutive base pairs behave like melting domains, where all base pairs have the same melting temperature. DNA melting profiles are normally described using the temperature (Tm or Tm50) for each base pair, at which there is a 50% chance of melting occurring i.e. a 50% chance of the nucleotide being unpaired. Melting profiles are loosely correlated with GC-content (4), but this correlation breaks down completely at resolutions smaller than about 500 base pairs (5).
The Poland-Scheraga model enables calculation of melting profiles computationally with quadratic time complexity (6). Fixman and Freire introduced a linear-time approximation of this algorithm (7), which enabled its use on larger sequences. FORTRAN implementations of this algorithm are available (8,9) an optimised version, of which enabled for the first time the calculation of the complete melting profile of the human genome (5).
Melting profiles have been used several times to predict sequence features. Yeramian pioneered this work by predicting genes in several genomes using his quadratically scaling SIMEX algorithm (4,10). In Plasmodium falciparum, which is unusually AT-rich, he found an almost perfect correlation between coding regions and stable melting domains (11). The results for other organisms were less clear. Other, more complex models of DNA denaturation exist, such as Stress-Induced Duplex Destabilization (SIDD) (12), which takes into account torsional stress of the DNA double-helix. Stress-Induced Duplex Destabilizations (SIDDs) have been computed for the Escherichia coli and Bacillus subtilis genomes to predict promoters using sliding window techniques (13). Promoters of stress response genes were particularly well predicted by this technique (14), suggesting that conformational changes in the helix are involved in the regulation of these genes. Although these analyses were restricted to prokaryotes, it has been shown that eukaryotic promoters share certain structural DNA features with their prokaryotic counterparts e.g. lesser bendability and lower stability (15). A sophisticated recent analysis (16) demonstrated that the ability to form a transcription bubble is sufficient for transcription to occur, even in the absence of transcription factors.
In this article, we show that the output of the linear-time DNA melting algorithm of Liu et al. (5) has applications in promoter prediction in mammalian genomes. Peaks in the melting profile correspond to TSS of both CpG island and non-CpG island associated promoters, although in the case of non-CpG promoters, the peaks are less distinct. Predictions derived from these peaks achieve comparable accuracy to the current state-of-the-art in promoter prediction. We name our method Profisi—PROmoter Finding In SIlico (pronounced ‘prophesy’). Our findings add to the growing body of evidence that the topology and the physical features of the DNA itself is an important factor in the regulation of transcription.
MATERIALS AND METHODS
Methods
Our method consists of analysing profiles of melting temperature, which have been computed along chromosomes, and using peaks as potential TSS. Melting profiles of the human ENCODE (17) regions have already been computed and were downloaded from the human genomic melting map website (5). The melting profile of mouse chr19 was calculated using FORTRAN code obtained from the same site. Portions of these profiles (per-nucleotide plots of Tm) were uploaded to the UCSC Genome Browser (18) as a custom track, and the promoters of individual genes were examined.
To evaluate the performance of our method we benchmarked it against a number of state-of-the-art methods, described below.
High quality, experimentally determined transcription start site data are available for both human and mouse. We chose mouse chr19 as a representative chromosome for the mouse genome, as it has an average gene density and was small enough to calculate the full melting map on a standard desktop machine. Although there is extensive coding sequence similarity between these two species, there are major differences in transcription regulation. Crucially, mice have lost many CpG islands still present in humans (19), leaving only 40% of mouse genes having associated CpG islands, as opposed to 70% of human genes.
Average melting profiles for CpG-associated promoters, non-CpG associated promoters, and the ENCODE regions as a whole were calculated. Locations of TSS were taken from RIKEN CAGE (1) and CpG islands from a UCSC Genome Browser track (20), determined using standard criteria (21). Rare transcripts were filtered out, with only TSS having two or more CAGE tags considered.
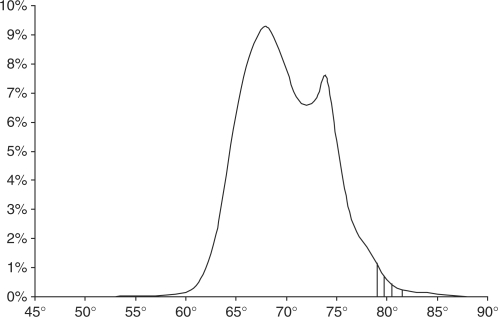
The average Tm at the TSS for human ENCODE promoters was 82.7°C for CpG promoters and 75.6°C for non-CpG promoters. This is higher than 99.57 and 90.75%, respectively, of all nucleotides in general. Because of these high values, we explored prediction by thresholding, at various values between 79 and 82°C. In Figure 1 we have shown the four different thresholds we used for the human analysis. The great advantages of thresholding are speed and simplicity compared to machine learning or sliding window approaches. In the results section we give the true and false positive rates for all of these thresholds. Each continuous area above a threshold is counted as a prediction, with the exact location determined by the highest value within that area. If there are multiple contiguous values (common due to the relatively flat melting domains), the middle value is used. Multiple predictions, less than 1000 base pairs apart, were merged.
Figure 1.
Histogram of melting temperatures in the human ENCODE regions (∼30 million base pairs) showing the four cut-offs (79–81.5°) used in our human TSS evaluation.
Supplementary Data, including a Java executable, instructions to compile the FORTRAN code, and downloadable predictions, is available at http://mlg.ucd.ie/profisi
Evaluation rules
The EGASP promoter prediction review (22) examined promoter predictions in the ∼30 million base pairs of the ENCODE regions of the human genome. The reference set was a manual gene annotation from the HAVANA group (23). Predictions within 1000 base pairs of the start of the 5′ UTR were counted as true positives. Only predictions within transcribed areas were counted as false positives. Subsequent promoter prediction programs (2,24) have also followed these rules.
CAGE (Cap Analysis of Gene Expression) (25) uses cap trapping to isolate the 5′-ends of full-length transcripts, and hence accurately determine both transcript levels and exact TSS locations. The 5′-end of each 20 bp CAGE tag is normally considered to represent a single transcription event. Isolated CAGE tags are scattered throughout the genome, but are usually ignored for prediction validation purposes (3,26). It is thought that these isolated tags are often due to post-transcriptional modification and recapping, rather than transcription (27). Therefore, we only count tags when more than one tag is present at an exact location. For the CAGE data, we used a stricter tolerance of 100 base pairs.
pppBenchmark (28) is a promoter prediction evaluation tool. It is a human promoter prediction evaluation tool, evaluating predictions versus both gene and CAGE references sets. It ranks predictions using a variety of scoring systems. The most important scores given by pppBenchmark are the 2A score—a distance-based validation protocol using CAGE data, and the PPP score, an overall measure of predictive performance.
Alternative methods
There are many methods for TSS prediction. Most of these have been extensively compared in (2) and (22). We evaluated our method (Profisi), in detail, versus a selection of the best performing methods from these reviews (six in total) as well as versus thresholded GC content. We ran these methods with as wide a range of thresholds as the software would allow in order to produce ROC-like curves so overall performance could be better visualised. Where region predictions were given, these were converted to appropriate point predictions. In addition, the pppBenchmark evaluation allowed us to compare performance versus a total of 17 methods.
EP3 (3) is a promoter prediction program based on dinucleotide base-stacking energy. There is some correlation between base-stacking energy and melting temperature, but unlike our approach, EP3 does not take into account the cooperative nature of the denaturation process. EP3 is available as both a Java Web Start application and a standalone download. It can process an entire chromosome in a few seconds. EP3 supplies range predictions, but following consultation with the authors it was decided to evaluate using point predictions, with the point taken as the middle of the predicted region. The thresholds we used for EP3 were 0 (the default), 0.1 and 0.2.
Eponine (29) relies on a mixture of Gaussian distributions of position weight matrices which, together, account for common promoter features such as CpG enrichment and TATA boxes. It uses a relevance vector machine (RVM) for classification (30). Compared to the more common support vector machine (SVM), an RVM has the advantage of not requiring parameters (such as error penalty) that often require computationally intensive cross-validation to determine. An RVM, however, is not guaranteed to find a globally optimum solution. The thresholds we used for Eponine were 0.999 (the default), 0.9993 and 0.9996.
N-SCAN (31) attempts to model the entire structure of a gene using hidden Markov models (HMMs). It is thus a descendant of GENSCAN (32) and similar methods. The start of the 5′ UTR was considered the TSS location. Whole-gene prediction is known to be beneficial in promoter prediction in cutting down the number of false positives in non-coding areas (22). N-SCAN depends on homology between the species being examined and an informant species. For human gene prediction, N-SCAN uses mouse as the informant species, and for mouse it uses human. N-SCAN predictions for human and mouse with scores were downloaded from http://mblab.wustl.edu/predictions/.
FirstEF (First Exon Finder) (33) predicts promoters implicitly by predicting the whole first exon of a gene. It predicts 5′ exons using a decision tree that incorporates both structural and compositional features. For promoter recognition, it uses a mix of k-mer scores, GC content, and CpG content. Predicted promoters are given as a region with 500 bp upstream and 70 bp downstream. It distinguishes between CpG-associated and non-CpG promoters, using different models for each. The thresholds we used for FirstEF were 0.9, 0.99 and 1.0 for human, and 0.99, 0.999, 0.9996, 0.999 and 1.0 for mouse.
ProSOM (24) uses a self-organising map (SOM) trained with around 90 000 sequences, consisting of promoters, transcripts and intergenic sequences. As with EP3, it is based on a promoter having a characteristic base-stacking energy profile. Also as with EP3, we converted the range prediction to a point prediction following consultation with the authors. The ProSOM web application has SOMs trained for mouse and human. Our thresholds for ProSOM were the default, 0.8 and 0.9.
ARTS (34) is a method, which relies on an SVM using a custom kernel incorporating both sequence and structural information. The thresholds we used for ARTS were 1.0, 1.1, 1.2, 1.3 and 1.4 for human, and 1.4, 1.5, 1.6, 1.7 and 1.8 for mouse.
The above programs (plus 11 other methods) have previously been evaluated by pppBenchmark (28).
As GC-content is superficially correlated with melting temperature, we thresholded and evaluated GC-content, using a 100 base-pair window, in the same fashion as the melting profiles.
RESULTS
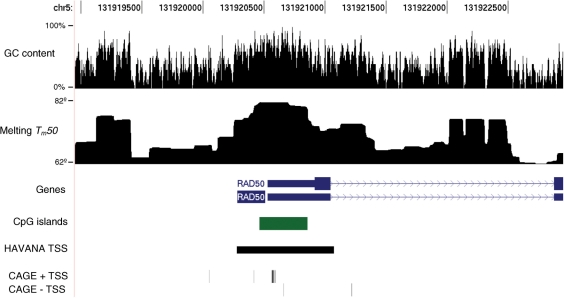
Figure 2 shows the melting profile of the human RAD50 promoter. RAD50 is a gene involved in the repair of double stranded DNA breaks. As is typical of CpG island promoters, there are multiple transcription start sites over a range of several hundred base pairs. There is also some evidence of a low level of antisense transcription. This is common in active promoters (35). The majority of the TSS fall within a flat peak or plateau in the melting profile, corresponding to an extremely stable melting domain. We manually examined the promoter regions of several other human genes (e.g. CFTR, DECR2, PIK4CB, SH3GLB2 and TES) and all showed similar TSS peaks, whether CpG-associated or not.
Figure 2.
Melting profile of ∼4000 base pairs around the human RAD50 promoter, viewed using the UCSC genome browser. RAD50 is a homologue of a yeast gene involved in double-stranded break repair. Like many human genes, RAD50 has a CpG island overlapping the first exon. The annotation (RefSeq, HAVANA, CAGE) shows multiple transcription start sites, clustered around the area with the highest melting temperature. The melting profile takes the form of multiple flat domains, due to cooperativity.
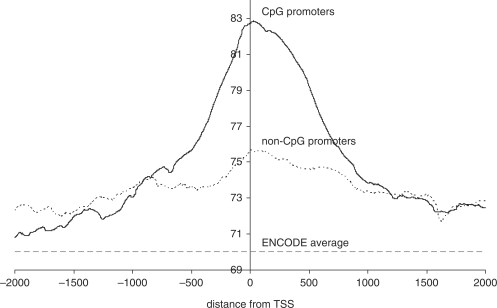
Figure 3 shows average melting profiles for both CpG and non-CpG associated promoters versus the average melting temperature for the ENCODE regions as a whole. We examined 2000 base pairs either side of the TSS, using CAGE tags as the TSS reference. TSS with more tags (higher levels of transcription) are weighted more heavily i.e. each tag was counted separately. Both types show a clear peak, which is centred on the TSS. The profiles are asymmetrical; the downstream regions are more stable than the upstream regions. The central regions of CpG-associated promoters have much higher melting temperatures than those of non-CpG promoters, but both are in turn more stable than the surrounding DNA. The melting average for the ENCODE regions as a whole was 70.01°. The median 90% of base pairs had melting temperatures of between 63.8° and 77.1°. Equivalent plots of GC-content for both types of promoter were correlated with the equivalent melting temperature plots, but noisier, with less distinct peaks.
Figure 3.
Average melting profiles of CpG and non-CpG associated promoters in human, relative to the transcription start site. As reference set, we used RIKEN CAGE (2 tags or greater) for the human ENCODE regions. Nine thousand five hundred and sixty seven profiles were averaged for CpG-associated promoters. Four thousand three hundred and sixty seven profiles were averaged for non-CpG-associated promoters. The average melting temperature for the ENCODE regions as a whole is 70°C, indicated by the dotted line.
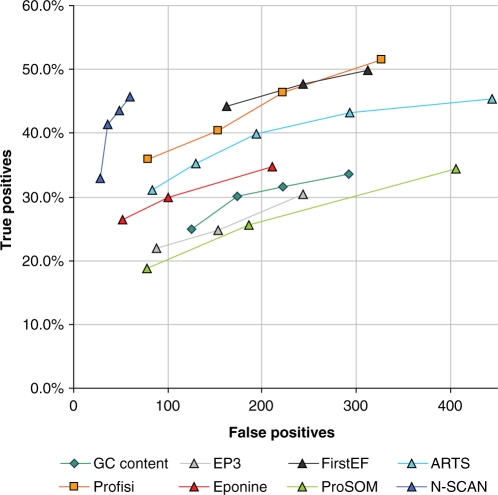
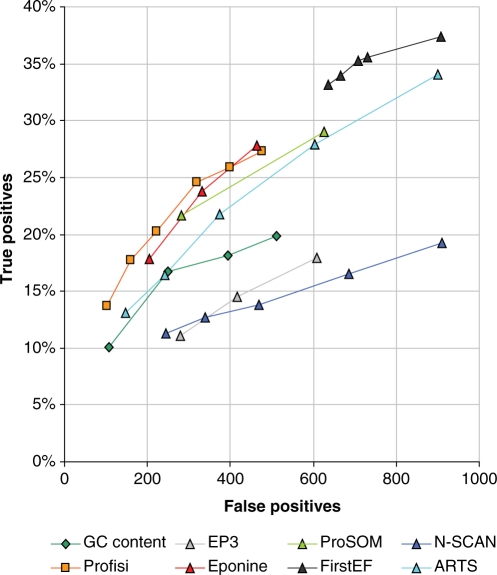
The evaluation of Profisi versus other promoter prediction methods is covered in Figures 4 and 5. These plot true positives versus false positives in human (ENCODE regions, HAVANA annotation) and mouse (chr19, CAGE annotation). True positives are given as a percentage, while false positives are given as a quantity, as any number of false positives is possible. Broadly speaking, the better predictions are closer to the top left corner of the graph. It is clear, that, despite its great simplicity, Profisi is competitive with existing, state-of-the-art prediction methods. In fact, overall, it produces consistently high quality results in a wide variety of situations.
Figure 4.
Prediction accuracy on the human ENCODE regions (NCBI build 35). Points that are closer to the top left of the graph indicate better performance. The evaluation rules were taken from the EGASP promoter prediction review. The reference set is coding and non-coding 5′-ends from the 20 May 2005 version of the manual HAVANA annotation (2071 start sites). Predictions must be within 1000 base pairs of the annotation. Only false positives in transcribed areas are counted. Where scores were available, a range of cut-offs were used to plot performance at increasing specificity.
Figure 5.
Performance using CAGE data as reference set for mouse chromosome 19 (12 357 locations). Predictions must be within 100 base pairs of the tag. As reference set, we used all locations with two or more CAGE tags. Where scores were available, a range of cut-offs were used to plot performance at increasing specificity.
Figure 4 shows the results on the HAVANA reference set for the human ENCODE regions. The best performer here was N-SCAN. This is consistent with the results of the original program performance review (22). This is unsurprising, as HAVANA is a gene, rather than start site annotation, and N-SCAN is a gene prediction program. N-SCAN performance was noticeably poorer, however, on the mouse CAGE dataset (Figure 5). This may be due to a reliance on prediction of downstream exons. The improved performance of ProSOM on both evaluations, versus EP3 (which also uses base stacking energies) points to the improvements possible with use of appropriate machine learning techniques. Profisi was arguably the best performer on the CAGE evaluation in mouse, and only comprehensively beaten by N-SCAN on the HAVANA evaluation in human. Profisi clearly outperforms the GC content method, despite using the same thresholding and clustering algorithm, showing that melting temperature is not merely a function of GC content. Older methods such as FirstEF and Eponine remained very competitive. On the pppBenchmark whole human genome evaluation, Profisi scored 0.41 on the 2A protocol (joint 4th) and 0.25 on the PPP score (5th) out of 18 total methods. The best performing method was ARTS, with a 2A score of 0.47, and a PPP score of 0.34.
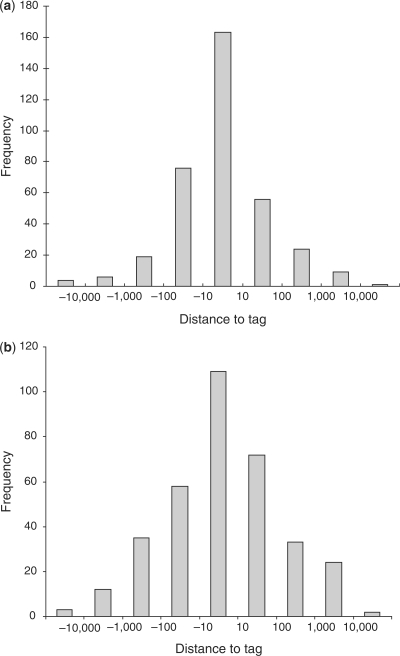
In Figure 6 we examine the distance of each TSS that is predicted at 81°C to the nearest real TSS, as determined by CAGE tags, in mouse. The results are striking. There were 358 predictions. Forty-six percent of them are within 10 base pairs of the nearest CAGE tag. This makes melting temperature a highly accurate measure for locating the precise location of the TSS. The equivalent figure for human is 31%.
Figure 6.
Histogram of distance in base pairs between each Profisi prediction and its nearest CAGE tag for (a) mouse chr19 and (b) human ENCODE regions. The distance is a log scale with the central column representing an accuracy of 10 base pairs or better. The Tm threshold was 81°C.
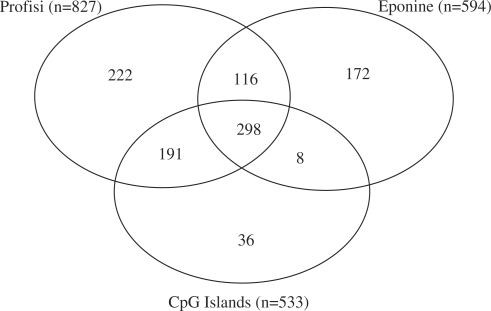
To test the uniqueness of our predictions, and to see whether we were merely detecting CpG islands, we measured the overlap between Profisi, Eponine, and a list of CpG islands for mouse chr19. As seen in Figure 7, there were a significant number of predictions that did not overlap between the three, suggesting both that Profisi and Eponine are able to find also non-CpG promoters, and that there is scope for improvement of performance by integrating predictions from multiple programs.
Figure 7.
Overlap in Profisi melting-based predictions, Eponine motif-based predictions, and CpG islands on mouse chr19. Predictions within 1000 base pairs of each other were considered to be overlapping. Tm threshold of 78° used for Profisi prediction.
DISCUSSION
The results of our three evaluations show that Profisi is competitive with the leading promoter prediction methods. On one test set, it was the best predictor and overall, it gave consistently high results. Such testing is complex to set up and the results depend on parameter settings, sizes of training sets and on the benchmarks being used. Nevertheless, it is clear that the method works. What is surprising is that it is so simple to set up and use. Once the melting temperature maps have been calculated, the method is almost instant to use to make predictions. These maps have already been calculated for the entire human genome and are freely available (5). Our Tm calculations for Mouse chromosome 19 (61 million base pairs) took ∼5–10 min to calculate on a standard desktop PC.
Other groups have looked closely at the potential importance of the physical properties of DNA in explaining promoter action (16) and in promoter prediction (24). Abeel et al. (3) examined DNA denaturation profiles among other properties in the EP3 method. One difference between Tm and other measures of DNA stability is the notion of ‘co-operativity’. The melting temperature is not just a simple additive or ‘sliding window’ based function of the base composition or their stacking energy. It takes into account the cooperative physics of the melting process, where bases form a single domain with well defined boundaries, which unzip in one go. This is ignored by many programs for melting temperature prediction e.g. EMBOSS’ dan [as explained in (5)]. The possible uses of Tm in exon prediction have been examined in the past, (11) but not using a full benchmark test set like we have done, and not focussing specifically on TSS prediction, which is the equivalent of predicting the start of the first exon.
Why should TSS be more stable than non TSS? Naively, one might expect TSS and core promoters to be less stable so as to easily allow a transcription bubble to form. In fact, transcription can proceed automatically from unstable DNA regions, where such bubbles form spontaneously (16). However, the stability of mammalian promoter DNA has been highlighted in the past (3,29). In contrast, promoter regions of genomes from many other taxa including bacteria, plants and fungi are less stable than the regions surrounding them (15). Taking into account the cooperative behaviour of the melting process, one can see that the TSS forms a separate melting domain. By not melting as a single domain as soon as a transcription bubble forms, it might allow for sophisticated control during transcription initiation.
The melting algorithm that our method relies on does not take into account the methylation state of individual cell lines (5). Methylated DNA is known to have a lower Tm than unmethylated DNA (36), and is associated with repression of transcription. Hence, our Tm values for methylated DNA are too high, and may contribute to the rate of false positives. Unfortunately, Liu et al.’s source of stability parameters (37) does not include data for methylated cytosine. Whole genome human DNA methylation maps are available (38), but it is unclear how to incorporate data from multiple cell lines into a global prediction approach.
During the course of this work, we also investigated the use of Tm to predict TSS in other eukaryotic species. Our method requires gap-free chromosome assemblies to calculate accurate melting profiles, and obviously high quality test sets are needed for evaluation. These are not readily available for vertebrates other than human and mouse. Preliminary examination of partial profiles from chicken look like TSS prediction using Profisi may be possible in that species but it is too early to tell precisely. With zebrafish, the profiles look very flat with few peaks. This corresponds to a relative lack of heterogeneity of G + C content across the zebrafish genome (39). In Saccharomyces cerevisiae, Drosophila melanogaster and Caenorhabditis elegans, the correlation between Tm and TSS location is not clear.
In the long run, we do not expect to see Tm thresholds alone being used to predict TSS. It makes most sense to use a combination of sources of information and inference methods, including Tm. It also makes sense to test the method carefully on different kinds of promoters. In this paper, we can see a difference in performance between CpG island and non-CpG island promoters. The method works in the absence of CpG islands but the thresholds are less discriminating. Nonetheless, the results are so clear-cut that it makes sense to use Tm profiles as prior information. In Figure 2, we can also see an asymmetry in the averaged profiles across all genes. The downstream regions of TSS seem more stable than the upstream regions. This might also be used to help predict direction of transcription.
FUNDING
PhD studentship provided by the Irish Research Council for Science, Engineering & Technology and Hewlett Packard, and by Science Foundation Ireland. Funding for open access charge: Science Foundation Ireland.
Conflict of interest statement. None declared.
ACKNOWLEDGEMENTS
The authors wish to thank Paul McGettigan, Derek Greene, Ramon Goñi, Shigeo Fujimori, Thomas Abeel, Vladimir Bajic, Gerhard Steger, Eivind Hovig and Neil Hurley for their assistance.
REFERENCES
- 1.Kawaji H, Kasukawa T, Fukuda S, Katayama S, Kai C, Kawai J, Carninci P, Hayashizaki Y. CAGE Basic/Analysis Databases: the CAGE resource for comprehensive promoter analysis. Nucleic Acids Res. 2006;34:D632–D636. doi: 10.1093/nar/gkj034. [DOI] [PMC free article] [PubMed] [Google Scholar]
- 2.Goni JR, Perez A, Torrents D, Orozco M. Determining promoter location based on DNA structure first-principles calculations. Genome Biol. 2007;8:R263. doi: 10.1186/gb-2007-8-12-r263. [DOI] [PMC free article] [PubMed] [Google Scholar]
- 3.Abeel T, Saeys Y, Bonnet E, Rouzé P, Van de Peer Y. Generic eukaryotic core promoter prediction using structural features of DNA. Genome Res. 2008;18:310–323. doi: 10.1101/gr.6991408. [DOI] [PMC free article] [PubMed] [Google Scholar]
- 4.Yeramian E. Genes and the physics of the DNA double-helix. Gene. 2000;255:139–150. doi: 10.1016/s0378-1119(00)00301-2. [DOI] [PubMed] [Google Scholar]
- 5.Liu F, Tøstesen E, Sundet JK, Jenssen T, Bock C, Jerstad GI, Thilly WG, Hovig E. The human genomic melting map. PLoS Comput. Biol. 2007;3:e93. doi: 10.1371/journal.pcbi.0030093. [DOI] [PMC free article] [PubMed] [Google Scholar]
- 6.Poland D, Scheraga H. Theory of Helix-coil Transitions in Biopolymers. New York: Academic Press; 1970. [Google Scholar]
- 7.Fixman M, Freire JJ. Theory of DNA melting curves. Biopolymers. 1977;16:2693–2704. doi: 10.1002/bip.1977.360161209. [DOI] [PubMed] [Google Scholar]
- 8.Lerman LS, Silverstein K. Computational simulation of DNA melting and its application to denaturing gradient gel electrophoresis. Methods Enzymol. 1987;155:482–501. doi: 10.1016/0076-6879(87)55032-7. [DOI] [PubMed] [Google Scholar]
- 9.Steger G. Thermal denaturation of double-stranded nucleic acids: prediction of temperatures critical for gradient gel electrophoresis and polymerase chain reaction. Nucleic Acids Res. 1994;22:2760–2768. doi: 10.1093/nar/22.14.2760. [DOI] [PMC free article] [PubMed] [Google Scholar]
- 10.Yeramian E. The physics of DNA and the annotation of the Plasmodium falciparum genome. Gene. 2000;255:151–168. doi: 10.1016/s0378-1119(00)00300-0. [DOI] [PubMed] [Google Scholar]
- 11.Yeramian E, Bonnefoy S, Langsley G. Physics-based gene identification: proof of concept for Plasmodium falciparum. Bioinformatics. 2002;18:190–193. doi: 10.1093/bioinformatics/18.1.190. [DOI] [PubMed] [Google Scholar]
- 12.Benham CJ. Sites of predicted stress-induced DNA duplex destabilization occur preferentially at regulatory loci. Proc. Natl Acad. Sci. USA. 1993;90:2999–3003. doi: 10.1073/pnas.90.7.2999. [DOI] [PMC free article] [PubMed] [Google Scholar]
- 13.Wang H, Benham C. Promoter prediction and annotation of microbial genomes based on DNA sequence and structural responses to superhelical stress. BMC Bioinformatics. 2006;7:248. doi: 10.1186/1471-2105-7-248. [DOI] [PMC free article] [PubMed] [Google Scholar]
- 14.Wang H, Benham CJ. Superhelical destabilization in regulatory regions of stress response genes. PLoS Comput. Biol. 2008;4:e17. doi: 10.1371/journal.pcbi.0040017. [DOI] [PMC free article] [PubMed] [Google Scholar]
- 15.Kanhere A, Bansal M. Structural properties of promoters: similarities and differences between prokaryotes and eukaryotes. Nucleic Acids Res. 2005;33:3165–3175. doi: 10.1093/nar/gki627. [DOI] [PMC free article] [PubMed] [Google Scholar]
- 16.Alexandrov BS, Gelev V, Yoo SW, Bishop AR, Rasmussen KØ., Usheva A. Toward a detailed description of the thermally induced dynamics of the core promoter. PLoS Comput. Biol. 2009;5:e1000313. doi: 10.1371/journal.pcbi.1000313. [DOI] [PMC free article] [PubMed] [Google Scholar]
- 17.The ENCODE Project Consortium. The ENCODE (ENCyclopedia Of DNA Elements) Project. Science. 2004;306:636–640. doi: 10.1126/science.1105136. [DOI] [PubMed] [Google Scholar]
- 18.Kent WJ, Sugnet CW, Furey TS, Roskin KM, Pringle TH, Zahler AM, Haussler D. The human genome browser at UCSC. Genome Res. 2002;12:996–1006. doi: 10.1101/gr.229102. [DOI] [PMC free article] [PubMed] [Google Scholar]
- 19.Jiang C, Han L, Su B, Li W, Zhao Z. Features and trend of loss of promoter-associated CpG islands in the human and mouse genomes. Mol. Biol. Evol. 2007;24:1991–2000. doi: 10.1093/molbev/msm128. [DOI] [PubMed] [Google Scholar]
- 20.Karolchik D, Kuhn RM, Baertsch R, Barber GP, Clawson H, Diekhans M, Giardine B, Harte RA, Hinrichs AS, Hsu F, et al. The UCSC Genome Browser Database: 2008 update. Nucleic Acids Res. 2008;36:D773–D779. doi: 10.1093/nar/gkm966. [DOI] [PMC free article] [PubMed] [Google Scholar]
- 21.Gardiner-Garden M, Frommer M. CpG Islands in vertebrate genomes. J. Mol. Biol. 1987;196:261–282. doi: 10.1016/0022-2836(87)90689-9. [DOI] [PubMed] [Google Scholar]
- 22.Bajic VB, Brent MR, Brown RH, Frankish A, Harrow J, Ohler U, Solovyev VV, Tan SL. Performance assessment of promoter predictions on ENCODE regions in the EGASP experiment. Genome Biol. 2006;7:S3. doi: 10.1186/gb-2006-7-s1-s3. [DOI] [PMC free article] [PubMed] [Google Scholar]
- 23.Harrow J, Denoeud F, Frankish A, Reymond A, Chen C, Chrast J, Lagarde J, Gilbert JG, Storey R, Swarbreck D, et al. GENCODE: producing a reference annotation for ENCODE. Genome Biol. 2006;7:S4. doi: 10.1186/gb-2006-7-s1-s4. [DOI] [PMC free article] [PubMed] [Google Scholar]
- 24.Abeel T, Saeys Y, Rouzé P, Van de Peer Y. ProSOM: core promoter prediction based on unsupervised clustering of DNA physical profiles. Bioinformatics. 2008;24:i24–i31. doi: 10.1093/bioinformatics/btn172. [DOI] [PMC free article] [PubMed] [Google Scholar]
- 25.Kodzius R, Kojima M, Nishiyori H, Nakamura M, Fukuda S, Tagami M, Sasaki D, Imamura K, Kai C, Harbers M, et al. CAGE: cap analysis of gene expression. Nature Methods. 2006;3:211–222. doi: 10.1038/nmeth0306-211. [DOI] [PubMed] [Google Scholar]
- 26.Wang X, Xuan Z, Zhao X, Li Y, Zhang MQ. High-resolution human core-promoter prediction with CoreBoost_HM. Genome Res. 2009;19:266–275. doi: 10.1101/gr.081638.108. [DOI] [PMC free article] [PubMed] [Google Scholar]
- 27.Affymetrix/Cold Spring Harbor Laboratory ENCODE Transcriptome Project. Post-transcriptional processing generates a diversity of 5[prime]-modified long and short RNAs. Nature. 2009;457:1028–1032. doi: 10.1038/nature07759. [DOI] [PMC free article] [PubMed] [Google Scholar]
- 28.Abeel T, Van de Peer Y, Saeys Y. Toward a gold standard for promoter prediction evaluation. Bioinformatics. 2009;25:i313–i320. doi: 10.1093/bioinformatics/btp191. [DOI] [PMC free article] [PubMed] [Google Scholar]
- 29.Down TA, Hubbard TJP. Computational detection and location of transcription start sites in mammalian genomic DNA. Genome Res. 2002;12:458–461. doi: 10.1101/gr.216102. [DOI] [PMC free article] [PubMed] [Google Scholar]
- 30.Bishop CM, Tipping ME. Proceedings of the 16th Conference on Uncertainty in Artificial Intelligence. San Francisco, CA, USA: Morgan Kaufmann Publishers Inc.; 2000. Variational relevance vector machines; pp. 46–53. [Google Scholar]
- 31.Gross SS, Brent MR. Using multiple alignments to improve gene prediction. J. Comput. Biol. 2006;13:379–393. doi: 10.1089/cmb.2006.13.379. [DOI] [PubMed] [Google Scholar]
- 32.Burge C, Karlin S. Prediction of complete gene structures in human genomic DNA. J. Mol. Biol. 1997;268:78–94. doi: 10.1006/jmbi.1997.0951. [DOI] [PubMed] [Google Scholar]
- 33.Davuluri RV, Grosse I, Zhang MQ. Computational identification of promoters and first exons in the human genome. Nat. Genet. 2001;29:412–417. doi: 10.1038/ng780. [DOI] [PubMed] [Google Scholar]
- 34.Sonnenburg S, Zien A, Ratsch G. ARTS: accurate recognition of transcription starts in human. Bioinformatics. 2006;22:e472–e480. doi: 10.1093/bioinformatics/btl250. [DOI] [PubMed] [Google Scholar]
- 35.Seila AC, Calabrese JM, Levine SS, Yeo GW, Rahl PB, Flynn RA, Young RA, Sharp PA. Divergent transcription from active promoters. Science. 2008;322:1849–1851. doi: 10.1126/science.1162253. [DOI] [PMC free article] [PubMed] [Google Scholar]
- 36.Aloui A, Tagourti J, El May A, Joseleau Petit D, Landoulsi A. The effect of methylation on some biological parameters in Salmonella enterica serovar Typhimurium. Pathol. Biol. doi: 10.1016/j.patbio.2009.03.011. doi:10.1016/j.patbio.2009.03.011. [Epub ahead of print] [DOI] [PubMed] [Google Scholar]
- 37.Gotoh O, Tagashira Y. Stabilities of nearest-neighbor doublets in double-helical DNA determined by fitting calculated melting profiles to observed profiles. Biopolymers. 1981;20:1033–1042. [Google Scholar]
- 38.Straussman R, Nejman D, Roberts D, Steinfeld I, Blum B, Benvenisty N, Simon I, Yakhini Z, Cedar H. Developmental programming of CpG island methylation profiles in the human genome. Nat. Struct. Mol. Biol. 2009;16:564–571. doi: 10.1038/nsmb.1594. [DOI] [PubMed] [Google Scholar]
- 39.Melodelima C, Gautier C. The GC-heterogeneity of teleost fishes. BMC Genomics. 2008;9:632. doi: 10.1186/1471-2164-9-632. [DOI] [PMC free article] [PubMed] [Google Scholar]


