

Abstract
Toxoplasma gondii has an unusual population structure consisting of three clonal lineages that predominate in North America and Europe. This simple pattern has encouraged the use of only a few laboratory isolates that are representative of each lineage. Principle among these is the type I RH strain, originally isolated from a child with encephalitis some 70 years ago. Comparison of different passages of the RH strain that have been propagated differently over the intervening time period revealed that the commonly used clonal line called RH-ERP was not representative of natural isolates of the type I lineage. Notably, RH-ERP formed much larger plaques than other type 1 strains, including a separate, earlier derived isolate of the RH strain. The RH-ERP variant also showed enhanced extracellular survival, faster growth, and decreased differentiation compared to the prototype type I strain GT1. Comparison of gene expression differences in the RH-ERP line revealed that several ABC transporters were upregulated, which may provide a growth advantage in vitro. These findings illustrate that dramatic phenotypic changes can arise in laboratory strains, emphasizing the need for comparison with recent clinical isolates.
Toxoplasma gondii is a widespread protozoan parasite in the phylum Apicomplexa, an ancient group of protozoan parasites containing more than 5,000 species (27). T. gondii infects a wide range of warm-blooded animals and, while not part of the natural transmission, human infections can lead to severe disease in immunocompromised individuals (19). Using a unique form of actin-based motility, T. gondii penetrates host cells, where it rapidly multiplies within a nonfusigenic vacuole and eventually causes lysis of the host cell (44). During the acute phase of the infection, repeated cycles of cell invasion, replication, and lysis contribute to rapid spread and tissue damage (2, 28). In addition to this rapid lytic form of growth, asexual replication by slow-growing bradyzoites contributes to long-term chronic infection in a variety of hosts (52). In contrast, sexual development occurs only in the intestinal epithelial cells of cats (11). Despite this sexual phase in the life cycle, T. gondii maintains a highly clonal population structure that consists of three lineages type I, II and III, which predominate in North America and Europe (1, 17). These three clonal lineages are the result of recent expansion from either a genetic bottleneck or selective sweep that occurred within the last 10,000 years (48). Within each lineage, all strains are thought to be genetically identical except for random mutations that have occurred since their recent origin. Differences between the three clonal lineages of T. gondii are also limited, and they display only 1 to 2% divergence at the nucleotide level for most loci (6). Despite this similarity, the different clonal lineages differ dramatically in biological traits such as growth (37), migration (2), and pathogenesis in laboratory mice (28). The type I lineage has been shown to exclusively contain those strains of T. gondii that are acutely virulent in laboratory mice (43, 49). The lethal dose of type I strains in outbred mice is estimated to be a single organism based on limiting dilution studies, whereas types II and III have 50% lethal dose that are ∼4 logs higher than this. It has been suggested that the virulence of type I strains may be due to continuous laboratory passage (12). However, more than 20 natural isolates that share this clonal genotype and acute virulence phenotype have been described (43, 49), indicating that acute virulence is genetically encoded and not simply a consequence of passage history. Consistent with this, genetic mapping has recently revealed that the acute virulence of type I strains in the mouse model is controlled by the rhoptry protein ROP18, which encodes a secretory serine threonine kinase (50). ROP18 shows dramatic levels of polymorphism and, although highly expressed in the type I and II lineages, it is expressed at very low levels in the type III lineage owing to the presence of an ancestral upstream region that influences expression (23).
The commonly used type I strain known as RH was originally isolated by Albert Sabin from a child who died with toxoplasmic encephalitis in 1939 (40). The RH strain was reported to be virulent on primary inoculation in laboratory mice (40). Since then, it has been serially passaged in mice by many laboratories. The RH strain was adapted for in vitro culture ca. 1977 by Elmer Pfefferkorn, who generated a clonal line that has also been widely distributed (36). This RH-ERP line was used to develop procedures for plaque formation on monolayers of host cells, providing a very useful in vitro assay that captures a combination of invasion, replication, egress, and spread. The ability of T. gondii to form such plaques has been used to generate temperature sensitive mutants (36), define the molecular basis of various chemically derived mutants (33-35), test drug sensitivity of parasite strains (29, 30), develop genetic transformation (45), and to test the phenotype of gene knockouts (20).
In the 70 plus years since its isolation, the RH strain has been widely distributed and become the most commonly used laboratory strain. Previous genetic analysis has shown that, whereas type I strains are highly similar, isolates of RH obtained from different laboratories show minor genetic differences in some polymorphic DNA markers (18). This likely reflects minor genetic drift; however, the significance of these relatively small differences is unclear. To determine whether long-term in vitro passage may have affected growth, we compared a number of type I strains by using a plaque formation assay. Surprisingly, this comparison revealed that the clonal isolate RH-ERP differed substantially in plaque size from other type I strains. Additional differences were apparent in extracellular survival after egress, growth rate, differentiation, and changes in gene expression. Our findings indicate that the isolation of cloned lines can give rise to variants that are no longer representative of natural isolates, demonstrating the plasticity of phenotypic traits and limiting the utility of laboratory isolates.
MATERIALS AND METHODS
Parasite strains.
The RH strain was originally isolated from a child with a lethal case of encephalitis in 1939 (40) and has since been propagated by continuous passage in mice or in vitro. We compared several lines that were derived from this original isolate, as diagramed in Fig. 1. A number of isolates were obtained from E. Pfefferkorn, Dartmouth Medical School, who acquired the RH strain from Ben Kean, Cornell University Medical School (36). The oldest of these is a clonal line that was derived from a single plaque on human foreskin fibroblast (HFF) cells in ca. 1977 (referred to as RH-ERP77) (36) (Fig. 1). This isolate was passaged serially on HFF monolayers until 1988, when it was cryopreserved (referred to as RH-ERP88). Both the original clone RH-ERP77 and the later isolate RH-ERP88 were cryopreserved in liquid N2 until the start of the present study. Continuous growth of this original isolate by serial passage on HFF monolayers was also used for comparison (referred to here as RH-ERP2009). The RH-JSR strain is a noncloned line of the original RH isolate that was obtained in 1988 from Jack Remington, Stanford University School of Medicine. It was adapted to growth on HFF monolayers by brief passage (i.e., several months) and cryopreserved prior to use. The type I GT1 strain, obtained as oocysts from J. P. Dubey, U.S. Department of Agriculture, Beltsville, MD, was originally isolated from skeletal muscle of a goat in 1980 (10), and it was adapted to growth in vitro on HFF cells. For the majority of experiments conducted here, we used a high-passage isolate of GT1 that had been serially passaged from 30 to 100 times since primary isolation. In selected experiments, we used a low-passage isolate (within five to six passages since primary isolation), and in these cases the strain is designated GT1-LP. In addition, we analyzed six other type I strains (MOR, ENT, VEL, GIL, FAJI, and PT) that were isolated from human congenital infections, as described previously (Table 1) (9, 17). The precise passage histories of these isolates are not known but did not exceed ∼30 passages in vitro, once obtained by our laboratory.
FIG. 1.

Schematic representation of propagation history of RH since it was isolated in 1939 (40). RH-JSR was maintained in mice since primary isolation, adapted for in vitro culture in 1988, and then cryopreserved. The RH strain was cloned by E. Pfefferkorn, Dartmouth Medical School, in 1977 to generate RH-ERP77 (36), which has been cryopreserved since. RH-ERP88 was propagated continuously until 1988 and then cryopreserved, whereas RH-ERP2009 was maintained by continuous passage in vitro.
TABLE 1.
Genotypes of T. gondii strains used in this study
 |
ATCC, American Type Culture Collection.
OH, Ohio; MD, Maryland; CA, California.
As defined previously (17).
The same genotype was obtained for RH-ERP77 and RH-ERP2009.
CT, congenital toxoplasmosis.
Growth and harvest of parasites.
Parasites were propagated in vitro in HFF cells grown in complete medium—Dulbecco modified Eagle medium containing 10% fetal bovine serum (FBS), 10 mM HEPES (pH 7.4), 1 mM glutamine, and 10 μg of gentamicin/ml—under 5% CO2 at 37°C. To assure high levels of viability, monolayers of HFF cells were inoculated at a high multiplicity of infection (∼ 5:1), leading to synchronous lysis at ∼40 h postinoculation. Parasites were harvested by mechanical scraping at the point where natural egress had reached ∼ 75%. In separate studies we have determined that this provides maximum viability for subsequent in vitro assays (data not shown). Parasites were concentrated by centrifugation at 400 × g for 10 min after filtration using 3.0-μm-pore-size polycarbonate filters (GE Water and Process Technologies, Tevose, PA), as described previously (39).
RFLP genotyping.
Parasites were genotyped by multilocus restriction fragment length polymorphism (RFLP) analysis based on 15 polymorphic markers—SAG1, SAG2, 850, ROP1, L328, 62, c29-2, BSR4, SAG5C, PK1, CS3, AK104, SRS1, GRA6, and AK37—as described previously (17). Amplified PCR products were digested with appropriate restriction enzymes, and the resulting fragments were separated by electrophoresis in 3% agarose gels, stained with ethidium bromide, and imaged with an Alpha Imager version 5.5 camera (Alpha Innotech Corp., San Leandro, CA).
Plaque assay.
HFF cells were grown to confluence in six-well plates in complete medium and infected with 200 T. gondii tachyzoites in each of three wells per isolate. Plates were incubated in complete medium 7 days under 5% CO2 at 37°C without movement so that individual plaques were obtained. After incubation, infected monolayers were fixed with 70% ethanol and stained with crystal violet (0.1%) (Sigma-Aldrich, St. Louis, MO). Plaque size was determined by measurement of 50 plaques from randomly selected microscopic fields that were examined by using a Zeiss Axioscope (Carl Zeiss, Inc., Thornwood, NY) equipped with a calibrated ocular micrometer. The area of the plaques was estimated from the formula: area = πab, where a and b are half of the length and width, respectively, of an oval-shaped plaque. Values were expressed as means ± the standard errors of the mean (SEM) from three separate experiments.
Intracellular growth assay.
Monolayers of HFF cells grown on triplicate 12-mm coverslips (FisherBrand, Pittsburgh, PA) were challenged with freshly isolated parasites in Dulbecco modified Eagle medium containing 1% FBS, incubated for 1 h at 37°C, washed, and incubated for 30 h at 37°C with complete medium, as described previously (50). After infection, monolayers were fixed and permeabilized in 4% formaldehyde and 0.25% Triton X-100 in phosphate-buffered saline (PBS) for 20 min. The coverslips were blocked by two 10-min incubations with 5% fetal bovine serum and 5% FBS and incubated for 1 h with directly conjugated MAb DG52 to SAG1 in 1% FBS. The slides were washed three times with PBS and mounted in Vectashield with DAPI (4′,6′-diamidino-2-phenylindole; Vector Laboratories, Inc., Burlingame, CA) and examined with a Zeiss Axioscope equipped with epifluorescence. The number of parasites per vacuole was determined by counting 50 vacuoles per coverslip (three coverslips per sample) and was expressed as means ± the SEM from three separate experiments.
Extracellular survival assay.
Parasite survival following natural egress was estimated by counting the number of plaques formed on monolayers of HFF cells. Freshly egressed parasites were incubated for defined intervals in complete medium at 37°C and then inoculated onto fresh monolayers of HFF cells and allowed to grow for 7 days, as described above. Values were expressed as means ± the SEM from three separate experiments.
Virulence assay.
Eight-week-old female CD-1 outbred mice (Charles River Laboratories, Wilmington, MA) were injected intraperitoneally with tachyzoites and monitored for 30 days. For each parasite strain, mice were infected with 10, 100, or 1,000 tachyzoites (10 animals/dose), and survival was monitored. The strains were also tested for viability in parallel by performing a plaque assay, and the results of this assay were used to normalize the infectious doses used in vivo. At the end of the 30-day observation period, mice were bled, and the sera were tested by Western blotting for antibodies against T. gondii. Sera were diluted 1:100 in PBS containing 1% nonfat dry milk and used to probe blots of GT1 strain lysate that had been separated by sodium dodecyl sulfate-polyacrylamide gel electrophoresis and transferred to a nitrocellulose membrane. Primary antibodies were detected by horseradish peroxidase-conjugated goat anti-mouse immunoglobulin G (Amersham Pharmacia/GE Healthcare, Piscataway, NJ), diluted 1:10,000, and enhanced chemiluminescent substrate (ECL Plus; GE Healthcare), followed by exposure to film.
In vitro differentiation of T. gondii strains.
In vitro bradyzoite induction was performed by using alkaline treatment of parasites grown in confluent monolayers of HFF cells cultured on coverslips, as described previously (47). Coverslips were infected with tachyzoites of each strain and differentiation was induced by culture in sodium bicarbonate-free RPMI 1640 containing 1% FBS-HEPES (pH 8.1) at 37°C without CO2. Cultures were incubated for 7 days with replacement of the medium every 2 to 3 days. After incubation, coverslips were fixed in 4% formaldehyde containing 0.25% Triton X-100 in PBS for 20 min. The coverslips were washed with PBS and blocked by two 10-min incubations with 5% fetal bovine serum and 5% FBS in PBS. Cysts were stained with fluorescein isothiocyanate-labeled Dolichos biflorus lectin (DBL; Vector Laboratories, Inc., Burlingame, CA) and tachyzoites were stained with monoclonal antibody (MAb) DG52 to SAG1 that was directly conjugated to Alexa 594 (Molecular Probes/Invitrogen, Carlsbad, CA). Slides were washed three times with PBS, mounted in Vectashield with DAPI (Vector Laboratories, Inc.,), and examined with a Zeiss Axioscope equipped with epifluorescence. Images were captured by using an AxioCam camera and processed similarly for all samples.
Gene expression microarray of T. gondii.
Total RNA was isolated from freshly egressed parasites by using the Qiagen RNeasy kit, according to the manufacturer's instructions (Qiagen, Valencia, CA). RNA quality was checked by using an Agilent Bioanalyzer 2100 (Agilent Technologies, Santa Clara, CA). A total of three μg of total RNA was transcribed to cRNA by using the Affymetrix One-Cycle kit (Affymetrix, Santa Clara, CA). Fragmented cRNA (5 μg) was hybridized to the T. gondii Affymetrix microarray (http://roos-compbio2.bio.upenn.edu/∼abahl/Array-Tutorial.html), as described previously (3). Hybridizations were carried out in triplicate from three separately grown samples. After hybridization, data were filtered with robust multi-array averaging (RMA), normalized using per-chip and per-gene median polishing, and analyzed by using the software package GeneSpring v7.2 (Agilent Technologies, Santa Clara, CA). Gene expression plots and heat maps were generated in GeneSpring. We used two procedures to identify genes differentially regulated between the strains. (i) Genes were grouped in GeneSpring by “strain” to define statistically significant differences (P ≤ 0.05) using a one-way Welch analysis of variance (ANOVA) and error model variances. Multiple testing correction was applied by using the Benjamin and Hochberg false discovery rate. (ii) The raw expression values from normalized GeneSpring data were compared in significance analysis of microarrays (SAM) (http://www-stat.stanford.edu/∼tibs/SAM/) using the multiclass response type with 100 permutations. A delta value of 2.92 was used to generate a list of genes at a median false discovery rate of 0.05%. Array data were archived at NCBI Gene Expression Omnibus under accession number GSE16115.
Real-time quantitative reverse transcription-PCR (qRT-PCR).
Total RNAs that had been exacted for the array experiments described above were transcribed into cDNA by using a reaction consisting of 50 μM oligo(dT)20, 200 U of SuperScript III reverse transcriptase (Invitrogen), and 2.5 μg of RNA in a volume of 20 μl. Quantitative PCR was carried out using a 25-μl reaction mixture containing 2× SYBR Advantage quantitative PCR premixed (Clontech, Mountain View, CA), 10 μM concentrations of each primer, and 2 μl of cDNA. Quantitative PCR was performed by using a Smart Cycler (Cepheid, Sunnyvale, CA) with gene-specific primers, designed using Primer Express software (version 1.0; Applied Biosystems, Foster City, CA). The reaction conditions were 95°C for 45 s, followed by 40 cycles of 95°C for 5 s and 62°C for 30 s. The data analysis was performed by using SmartCycler software (Cepheid). The relative gene expression levels were calculated as the fold change by using the formula 2−ΔΔCT, where ΔCT = the threshold cycle (CT) of a control gene − the CT of the target gene and ΔΔCT = the ΔCT of the reference strain (i.e., RH-ERP2009 cDNA) − the ΔCT of either of the strains GT1 or RH-JSR. Actin (gene ID TGME49_009030) or GAPDH (glyceraldehyde-3-phosphate dehydrogenase; gene ID TGME49_089690) were used as controls.
Sequence analysis.
The genomic sequences of chromosomes Ia and Ib for GT1 and RH-ERP strains were obtained from ToxoDB.org (http://toxodb.org/toxo/home.jsp) (15). The GT1 sequence was generated previously by the Institute for Genomic Research, while the Wellcome Trust Sanger Institute generated the RH-ERP sequence. The ends of the chromosomes were removed by deleting the sequences past the end of the first and last annotated genes. Differences were identified by comparison of the genome sequences with MUMmer 3.21 using the dnadiff script and default options (26).
Animal care and housing.
Animals were cared for by the Division of Comparative Medicine, and the Animal Studies Committee at Washington University approved all procedures conducted.
Statistical analysis.
Statistical analysis was performed using formulae provided in Microsoft Excel. Triplicate experiments were performed and the means, standard deviation, and standard error means were calculated for statistical comparisons. The Student t test was used to determine the significance level under the assumptions of two separate means with equal variance and using a two-tailed test. The frequency of different classes of genes within the differentially expressed gene list was compared to the whole genome using a hypergeometric distribution with the HYPGEOMDIST function in Excel.
RESULTS
Formation of plaques by different type I strains.
Because of the lytic growth pattern of tachyzoites, T. gondii forms plaques efficiently on monolayers of host cells in vitro, and this provides a useful measure of viability (36). Initially, we compared the size of plaques formed among different type I strains (Table 1). Somewhat surprisingly, we observed a dramatic difference in a common laboratory isolate of RH (referred to here as RH-ERP2009), which formed much larger plaques than the other type I strains (Fig. 2A). Although plaques formed by the other type I strains, including GT1, were not as large as those formed by RH-ERP2009, they were easily recognizable when examined under a microscope (Fig. 2A). Measurement of the average plaque area revealed that RH-ERP2009 developed significantly (P ≤ 0.00005) larger plaques than GT1 or a collection of other type I isolates (Fig. 2B). We considered that this difference might reflect the very different passage history of RH-ERP2009, compared to the other type I strains, which are relatively recent isolates (Table 1). RH-ERP2009 differs from these primary clinical isolates and other RH lines in two ways. First, it was obtained by subcloning the original RH line to isolate a line that grew well on HFF cells in vitro (36) (Fig. 1). Second, it has been maintained since ca. 1977 by continuous passage at 2-day intervals on HFF cell monolayers. In contrast, many other laboratories utilize RH lines that are passaged in mice (18). Since the plaque-forming assay is performed on HFF cells, the larger plaque size may reflect an adaptation to growth on this particular host cell or be a result of long-term passage history. To decipher between these alternatives, we compared the original RH clone that was isolated in 1977 (referred to as RH-ERP-77) to an isolate that was passaged for approximately 10 years in vitro (referred to as RH-ERP88) and to a mouse-passaged line that was propagated continuously since the original isolation in 1939 and then briefly adapted to growth on HFF cells (referred to as RH-JSR) (Fig. 1). Interesting, we observed that RH-JSR formed smaller plaques like GT1, whereas RH-ERP77 and RH-ERP88 formed larger plaques like RH-ERP2009 (Fig. 2B). A low-passage isolate called GT1-LP also developed smaller plaques like GT1. The large-plaque phenotype was also not unique to all RH strain isolates but rather was only expressed by derivatives of the clone that was isolated by Elmer Pfefferkorn in 1977 (36).
FIG. 2.

Plaque formation assay using different type I strains. (A) Example of plaques formed by RH-ERP2009 and GT1 when grown on HFF monolayers in six-well plates. On the left is a low-magnification image of one entire well. Scale bar, 1 cm. The image on the right was obtained by microscopic examination and shows a single plaque formed by GT1. Scale bar, 0.2 mm. (B) Quantification of the area of plaques developed by RH-ERP2009 and other type I strains. Plaques developed by RH-ERP77, RH-ERP88, and RH-ERP2009 were significantly (P ≤ 0.005) larger than other type I strains including from RH-JSR. Values are means ± the SEM (n = three separate experiments, 50 plaques/experiment) for RH-ERP77, RH-ERP88, RH-ERP2009, GT1, and GT1-LP, and means ± the standard deviation (SD) for each of two experiments, for remaining isolates.
The additional type I isolates used for comparison above were obtained from human congenital cases of toxoplasmosis in the United States and Europe (Table 1). The data in Table 1 indicate that these strains match the type I genotype at all 15 loci examined, making it extremely probable that they are members of this clonal lineage, rather than diverse genotypes. Although they provide recent clinical isolates of the type I lineage for comparison, their capacity to complete the life cycle and genetic makeup has not been extensively studied. Because GT1 has a similar genotype and phenotype to natural type I isolates and yet it is more completely characterized, we utilized GT1 as a representative type I strain for further comparison with RH-ERP2009. The GT1 strain is capable of completing the entire life cycle, has been used in several genetic crosses (24, 49), and is the isolate used for whole genome sequencing for the type I lineage (http://ToxoxdDB.org/).
Comparison of intercellular growth rates.
Previous studies have shown that the intracellular growth rate of T. gondii differs substantially between different strain types (38). To evaluate the difference in growth rate between RH-ERP2009 and GT1, we measured the rate of intracellular replication indirectly by evaluating the number of parasites within individual vacuoles at 30 h postinfection, prior to natural egress and reinvasion. GT1 lagged behind RH and the number of vacuoles with 16 parasites was significantly higher (P ≤ 0.05) in GT1 than RH-ERP2009, while the number of vacuoles with 32 parasites was significantly higher (P ≤ 0.005) in RH-ERP2009 than GT1 (Fig. 3A). As a consequence, the average number of parasites per vacuole was also significantly higher (P ≤ 0.05) in RH-ERP2009 (25.54 ± 0.53) than in GT1 (19.03 ± 0.61). Collectively, these results are consistent with RH-ERP2009 having a faster division time than GT1 or, alternatively, with GT1 having a considerable lag in the onset of division after cell invasion.
FIG. 3.

Comparison of intracellular growth and extracellular survival between strains of T. gondii. (A) Comparison of intracellular growth rate between RH-ERP2009 and GT1. Monolayers of HFF cells were infected with parasites, grown for 30 h, fixed, and stained with MAb DG52 to detect surface antigen SAG1. The average numbers of parasites present per vacuole was determined by microscopic examination and counting of 50 vacuoles/coverslip. GT1 contained significantly more vacuoles with 16 parasites/vacuole (*, P ≤ 0.05), while the number of vacuoles with 32 parasites was significantly higher in RH-ERP (**, P ≤ 0.005). Values indicate means ± the SEM (n = three separate experiments with three coverslips each). (B) Comparison of extracellular survival between RH-ERP2009, RH-JSR, and both low- and high-passage GT1. The number of tachyzoites surviving after natural egress was determined by incubation of parasites for at 37°C with CO2 in complete medium and subsequent plaque assay. The viability of RH-ERP2009 was higher at the outset and viability dropped by 50% over the next 24 h (**, P ≤ 0.005, comparison of 2 h versus 24 h). The initial viability of GT1 was significantly lower at 0 h after egress (**, P ≤ 0.005), and this dropped further to almost negligible levels by 12 h after egress (**, P ≤ 0.005, comparison of 2 h versus 12 h). There was also a significant difference in the viability of low passaged GT1-LP and RH-JSR isolates versus GT1 even at early time points (*, P < 0.05). Values are means ± the SEM (n = three experiments).
Survival after natural egress.
At the culmination of the intracellular cycle, tachyzoites emerge from the host cell by a process of natural egress, defined here as ∼75% lysis of host cell monolayers. Extracellular parasites are unable to replicate and remain viable for only a limited period of time. We tested the extracellular survival of RH-ERP2009 versus RH-JSR, GT1, and GT1-LP by incubating freshly egressed parasites at 37°C for various intervals, followed by plaquing on fresh monolayers of HFF cells. Interestingly, fewer numbers of GT1 tachyzoites were viable at the outset compared to RH-ERP2009 (P ≤ 0.005) (Fig. 3B). There was a significant (P ≤ 0.005) decrease in the survival rate for GT1 within a 12-h period, whereas it took 24 h for a similar decrease to be observed for RH-ERP2009 (Fig. 3B). There was also a significant difference in survival between low- and high-passaged parasites. The high-passage GT1 isolate showed higher initial viability and survived significantly better than the low-passage isolates GT-LP or RH-JSR (Fig. 3B). Collectively, these data indicated that the RH-ERP2009 parasites had a higher initial viability, survived for a prolonged time period (more than 24 h) outside the host cell, and were still able to invade new host cells.
In vitro induction of bradyzoite.
The finding that GT1 formed smaller plaques in vitro could result from spontaneous differentiation into slow-growing bradyzoites within tissue cysts during the 7-day incubation period. To check this possibility, we monitored cyst conversion by labeling with the fluorescent lectin DBL, which stains the cyst wall (25). First, we checked whether RH-ERP2009 and GT1 were able to undergo differentiation in response to stress. After in vitro induction under alkaline pH-induced stress for 7 days, GT1 stained strongly with DBL, indicating development of a normal cyst wall (Fig. 4). In contrast, RH-ERP2009 did not stain with DBL, indicating it failed to differentiate (Fig. 4). Despite readily differentiating under inducing conditions, GT1 failed to stain with DBL during growth in normal medium, which simulates the conditions used for plaque formation (Fig. 4). These results reveal that the small-plaque phenotype of GT1, and most probably the other type I strains as well, was unlikely to be due to spontaneous differentiation into tissue cysts.
FIG. 4.

Differentiation of tissue cysts after in vitro culture. Parasites were induced to differentiate by high-pH culture for 7 days (“Induced”), and cyst development was detected by staining with fluoresceinated lectin DBL (green), followed by MAb to the parasite surface protein SAG1 conjugated to Alexa 594 (red). GT1 readily formed cysts under these conditions, whereas RH-ERP2009 did not. Neither strain converted to tissue cysts under normal growth conditions used for the plaque assay (“Normal”). All pictures shown were recorded under similar optical conditions, imaged with the same exposure time, and processed identically. Scale bars: 15 μm in the top panel and 40 μm in the remaining panels.
Virulence assay.
Although RH-ERP2009 and GT1 are both type I strains, they differed in several in vitro phenotypic traits monitored above. To determine whether these in vitro phenotypes had any impact on infection in vivo, we tested virulence in the mouse model. The acute virulence of RH-ERP2009 and GT1 was determined from cumulative mortality and serological status of surviving mice after intraperitoneal inoculation in outbred mice, as described previously (49, 50). To control for viability of the inoculum, tachyzoite survival was determined by plaque assay, which showed that 20% of RH-ERP2009 were viable, whereas only 4% of GT1 parasites were viable. Inoculation with different numbers of purified tachyzoites of RH-ERP2009 resulted in 100% mortality of all infected mice within 12 days (Fig. 5A). In contrast, inoculation of GT1 led to 100% mortality at an adjusted dose of 4 and 40 tachyzoites but only limited mortality at an adjusted dose of 0.4 parasites (Fig. 5B). Animals that survived when challenged with GT1 parasites remained seronegative (data not shown), indicating that they did not become infected. When adjusted for the differences observed in viability, there was essentially no difference in the mortality induced by the two strains.
FIG. 5.
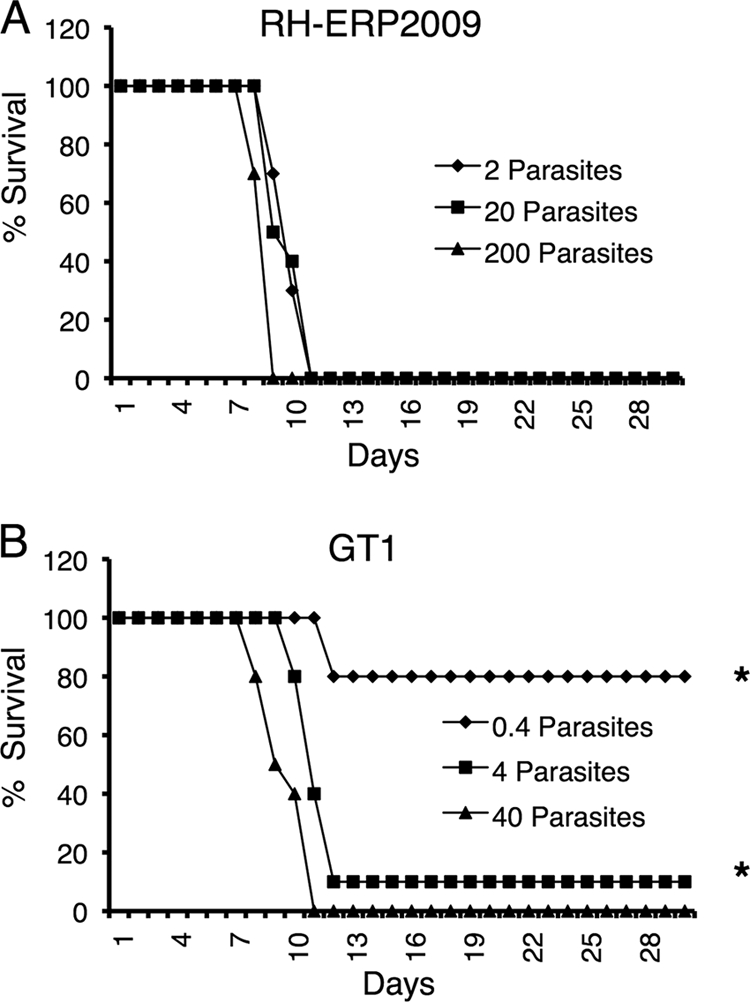
Acute virulence of RH-ERP2009 and GT1 strains as monitored by infection in outbred mice. (A) All animals inoculated with RH-ERP2009 died within 12 days, regardless of dose. (B) Animals injected with 4 or 40 tachyzoites of GT1 also died rapidly. Most of mice injected with 0.4 GT1 tachyzoites survived; however, surviving mice were not infected, as shown by a negative serological response in Western blot (*). The results shown are the combination of two experiments with five mice per group each. Inocula have been adjusted for viability based on efficiency of plaque formation (see Materials and Methods).
Comparison of gene expression profiles between type I isolates.
Previous studies have shown that continuous in vitro passage can result in changes to the global gene expression profiles in mammalian cells (32). To examine the extent of gene expression differences between highly homologous type I strains, we took advantage of the T. gondii Affymetrix microarray containing probes to more than 8,000 genes. We compared the RH-JSR and GT1 strains, two isolates that share the small plaque phenotype, to the large plaque isolate RH-ERP2009. After hybridization and normalization of data, we used two independent methods to generate lists of genes with expression differences that were twofold or greater in at least one sample and statistically significant between the two strains. ANOVA identified 520 genes that were significantly differentially expressed between GT1, RH-ERP2009, and RH-JSR (P ≤ 0.05). Independently, SAM (false discovery rate = 0.05%) analysis identified 475 transcripts that were differentially expressed. The lists were combined to yield 610 distinct genes that were used to perform pairwise comparisons between the three samples, with an emphasis on changes in gene expression that might underlie the phenotypic differences observed in RH-ERP. Pairwise comparisons identified 113 genes that were similarly expressed in GT1 and RH-JSR and differentially expressed in RH-ERP2009 (Fig. 6 and see Table S1 in the supplemental material). Codifferentially expressed genes were located across all chromosomes and showed no pattern of clustering to one particular region of the genome (see Table S1 in the supplemental material). A wide variety of functional annotations were found in the differentially expressed genes, including many hypothetical or unknowns. Interestingly, 3 of 34 ABC transporters (ToxoDB) were significantly upregulated in RH-ERP2009 relative to both RH-JSR and GT1 (hypergeometric distribution, P = 0.01). Comparison of genes that were unique expressed in other strains also revealed 37 genes that were significantly different only in GT1 and 177 that were different only in RH-JSR; however, neither of these sets showed a similar upregulation of transporters (the raw data can be retrieved from GEO).
FIG. 6.

Global gene expression differences between GT1, RH-ERP2009, and RH-JSR. After hybridization to T. gondii Affymetrix microarrays, two independent methods were used to identify genes with significant expression differences, and the combined set is shown here graphically. The color bar at the far right applies to both the heat map (A) and graph (B), where orange/red represents increased expression, and blue indicates decreased expression relative to RH-ERP2009. (A) Heat map of 113 differentially expressed genes, including 72 that showed greater expression in GT1 and RH-JSR and 41 that showed greater expression in RH-ERP2009. (B) Graphic display of the differences in gene expression of 113 genes that showed similar expression in RH-JSR and GT1 but that were upregulated (red) or downregulated (blue) in RH-ERP2009.
Quantitative PCR analysis of gene expression.
To validate the array data, we also tested a subset of genes by quantitative PCR and compared their expression levels between RH-ERP, RH-JSR, and GT1. Several hypothetical unknowns that showed widely different gene expression levels were tested using gene specific primers, including one gene that was predicted to be different among all three strains (i.e., 540.m00325) and two that were predicted to be selectively upregulated in RH-ERP relative to the other two strains (i.e., 583.m09210 and 83.m02139). The results of the quantitative PCR analysis revealed similar trends, although the magnitudes of the differences were slightly different (Table 2). We also analyzed three ABC transporters that were upregulated in the array data for RH-ERP with respect to RH-JSR and GT1. The predicted differences in upregulation of expression in RH-ERP were verified by quantitative PCR using gene-specific primers (Table 2). We also tested a fourth ABC transporter that was upregulated in RH-ERP relative to both RH-JSR and GT1, although in this case the array data indicated different levels of expression in all three strains (i.e., 80.m02212). Quantitative PCR analysis showed that this gene was also upregulated in RH-ERP relative to both RH-JSR and GT1, albeit to different extents (Table 2). Collectively, 4 of 34 ABC transporters found in the genome were selectively upregulated in the RH-ERP strain, which is unlikely to be due to chance.
TABLE 2.
Comparison of gene expression levels by qRT-PCRa
| ToxoDB IDb | Common name | Fold difference determined by microarray |
Fold difference determined by qRT-PCRc |
||||
|---|---|---|---|---|---|---|---|
| Actin |
GAPDH |
||||||
| RH-JSR | GT1 | RH-JSR | GT1 | RH-JSR | GT1 | ||
| 540.m00325 | Hypothetical protein | 3.595 | 61.594 | 0.281 | 46.200 | 0.413 | 87.426 |
| 49.m03125 | Multidrug resistance protein, putative/ABC transporter | 0.243 | 0.375 | 0.014 | 0.188 | 0.032 | 0.355 |
| 50.m03178 | ABC transporter | 0.284 | 0.208 | 0.002 | 0.130 | 0.004 | 0.246 |
| 31.m00887 | ABC1 domain-containing protein | 0.303 | 0.223 | 0.0001 | 0.076 | 0.0003 | 0.145 |
| 80.m02212 | ABC2 membrane | 0.375 | 0.055 | 0.014 | 0.096 | 0.032 | 0.182 |
| 583.m09210 | Hypothetical protein | 0.162 | 0.075 | 0.012 | 0.124 | 0.028 | 0.235 |
| 83.m02139 | Hypothetical protein | 0.359 | 0.046 | 0.007 | 0.047 | 0.016 | 0.088 |
Fold differences are determined compared to RH-ERP2009.
That is, the ToxoDB annotation 3 accession number.
Actin and GAPDH are normalization controls.
DISCUSSION
Previous studies have emphasized the large phenotypic differences that occur between lineages of T. gondii, while considering within lineage variation to be relatively insignificant (41, 42). We compared here in vitro growth phenotypes, acute virulence in the mouse model, and gene expression profiles of several common type I isolates of T. gondii. One clonal isolate, called RH-ERP, demonstrated a higher growth rate, prolonged survival time outside host cells, and greatly increased plaque size on host cell monolayers. These differences were common to all of the descendants of this original subclone of the RH strain. In contrast, another isolate of RH known as RH-JSR had a small-plaque phenotype, similar to more recent clinical type I isolates and the animal isolate GT1, which serves as the reference strain for this lineage. The greater extracellular survival of RH-ERP led to higher mortality in mice; however, when adjusted for differences in initial viability, it was similar to the type I strain GT1. These findings indicate that despite having a highly conserved genotype, type I strains can show substantial phenotypic variation and differences in gene expression.
Plaque formation is commonly used to measure growth of T. gondii, and this process is the result of several events including invasion, growth, egress, and migration (39). A previous study showed that type I strains exhibited a higher migratory capacity in vitro than either type II or III (2), and other studies have demonstrated type I strains grow faster in vitro (37). Although these prior studies might have predicted large phenotypic differences between lineages, our findings illustrate dramatic differences can also occur within a lineage. Specifically, RH-ERP2009 grew significantly faster and survived outside the host cells for a much longer time than GT1, or other small plaque isolates including the RH-JSR strain. Based on these results, we expect that RH-ERP would also show increased motility and invasion into monolayers of host cells, since these in vitro assays also depend on viability.
RH-ERP was derived by E. Pfefferkorn, Dartmouth Medical School, who isolated a single plaque from a culture of the RH strain obtained from B. Kean, Cornell University Medical School (36). In contrast, RH-JSR is a noncloned line of original RH strain that was maintained first at the National Institutes of Health, Laboratory of Parasitic Diseases, and then at the Stanford School of Medicine. Since isolation, RH-ERP has been maintained by growth on monolayers of HFF cells, while RH-JSR was maintained by serial passage in mice. Hence, several factors could potentially influence the phenotypic and gene expression differences observed here. The initial viability, and hence the efficiency of plaquing, was highly dependent on passage history. In contrast, the large-plaque phenotype was common to the original cloned isolate RH-ERP77, and all subsequent isolates derived from it, and was not seen in other type I strains. These results indicate that the large-plaque phenotype was not the result of long-term passage but instead represents a naturally occurring variant that was fortuitously chosen in the cloning process. However, we cannot not rule out the possibility that the RH-ERP line represents a unique type I lineage that was inadvertently mixed up with the original RH line. Deep sequencing of the genome of various type I isolates may eventually allow reconstruction of the ancestry and/or alteration(s) that led to this phenotype. Regardless of the exact basis of this trait, the large plaque size of RH-ERP provides an extremely convenient assay for growth, viability, drug resistance, etc., and so it is easy to appreciate why it would have been chosen as a laboratory model.
During differentiation into bradyzoites, the cell wall of the forming tissue cyst stains with DBL, which recognizes N-acetylgalactosamine (25). Differentiation can be induced in vitro using a variety of stress conditions, including cultivation at high pH (47). After in vitro culture under alkaline pH induction, RH-ERP2009 failed to stain with DBL, indicating an inability to undergo cyst wall development, whereas GT1 readily underwent stage conversion, as reported previously (14). The inability of RH-ERP2009 to express cyst wall markers indicates that it is impaired in development, which may be a consequence of long-term growth in vitro. Others have reported that the RH strain can undergo partial bradyzoite development in vitro under similar conditions (46); however, it is generally thought that type I strains are less capable of switching than type II strains (52) or type III strains (3).
The dramatic differences between in vitro growth phenotypes of type I strains observed here were somewhat surprising given the recent origin of the clonal lineages estimated at 104 years (48), and the even more recent common origin of the RH lines, since 1939 (Fig. 1). There are several sources of data that provide estimates of genetic polymorphisms within the clonal type I lineages. Genetic differences between RH isolates have previously been described based on a single nucleotide polymorphism detected by RFLP analysis (18). However, a broader sampling of sequences from introns and housekeeping genes failed to reveal differences between GT1 and RH-ERP88 (comparison based on 10,963 bp per strain) (22, 23). In addition, comparison of the entire sequence of chromosome 1a (Chr1a) and Chr1b derived from the GT1 and RH-ERP88 strain revealed only 24 and 45 SNPs located on Chr1a and Chr1b, respectively. These values are likely close the sequencing error rates, but in any case they indicate a very low level of genetic polymorphism within the clonal type I lineage. By comparison, there are 332 SNPs in Chr1a between the type I (RH-ERP) and type II lineages (ME49) (21). This level is also quite low since the three lineages inherited the same version of Chr1a at a recent time in the past, coinciding with the establishment of the clonal lineages (21). In contrast, the level of polymorphism on Chr1b between lineages is on the order of 1 change in 100 bp, which is much more similar to the rest of the genome (21). Collectively, these estimates suggest that the phenotypic differences between type I strains are unlikely to be due to sequence differences (i.e., mutations) but more likely stem from epigenetic differences in gene expression. Recent studies have emphasized the relative importance of epigenetic factors in controlling gene expression in T. gondii (5, 16). This suggests that a great deal of phenotypic variation might be expected based on passage history or other environmental influences. Consistent with this, serial passage of a highly virulent strain of the T. gondii led to attenuation in the mouse model (31) and, in a separate study, similar attenuation of the strain called S48 led to a vaccine strain that is used in animals (7, 8). As well, previously studies have highlighted the rapid loss of propagation through the cat phase of the life cycle with repeated passage of T. gondii strains (13). In this regard, it may be significant that the transcript for an oocyst wall protein (ToxoDB accession no. 76.m01650) was significantly underexpressed in RH-ERP2009 compared to RH-JSR and GT1 (see Table S1 in the supplemental material).
Although the molecular basis of the enhanced growth of RH-ERP is not defined here, differences in gene expression that were detected suggest a possible explanation. Microarray hybridizations identified 113 transcripts that were significantly differentially expressed in RH-ERP2009 relative to both RH-JSR and GT1. Among the genes that were differentially regulated, four ABC transporters were significantly overexpressed in RH-ERP versus both RH-JSR and GT1. ABC transporters use the energy of ATP to catalyze the transport of a variety of nutrients across biological membranes such as cholesterol and other lipids (51). Hence, overexpression of transporters might result in faster growth, increased extracellular survival, and the formation of larger plaques. Little is known about the function of such transporters in T. gondii, and future studies designed to alter the expression of ABC transporters could be used to test the hypothesis that their selective overexpression may have led to enhanced growth of RH-ERP.
T. gondii is a ubiquitous parasite of warm-blooded animals that has become a model organism to study apicomplexan parasites. The RH strain has most often been used for in vitro studies since it replicates efficiently, is easily subcloned, and is readily transfected. Our studies reveal that one reason that the RH strain is so amenable to experimental manipulation may relate to differences in the efficiency of in vitro growth. Although this trait is convenient for establishing in vitro assays, it may not directly mimic natural type I isolates. Hence, findings made with laboratory isolates will need to be validated in other more recent clinical isolates, before they can be attributed as general features of the respective lineage.
Supplementary Material
Acknowledgments
This study was partially supported by grants from the National Institutes of Health to L.D.S. (AI059176) and to M.W.W. (AI077662).
We thank Julie Nawas and Kate McInnerney for expert technical assistance. Strains were provided by Jack Remington, Elmer Pfefferkorn, J. P. Dubey, and Marie Laure Dardé.
Footnotes
Published ahead of print on 2 October 2009.
Supplemental material for this article may be found at http://ec.asm.org/.
REFERENCES
- 1.Ajzenberg, D., N. Cogné, L. Paris, M. H. Bessieres, P. Thulliez, D. Fillisetti, H. Pelloux, P. Marty, and M. L. Dardé. 2002. Genotype of 86 Toxoplasma gondii isolates associated with human congenital toxoplasmosis and correlation with clinical findings. J. Infect. Dis. 186:684-689. [DOI] [PubMed] [Google Scholar]
- 2.Barragan, A., and L. D. Sibley. 2002. Transepithelial migration of Toxoplasma gondii is linked to parasite motility and virulence. J. Exp. Med. 195:1625-1633. [DOI] [PMC free article] [PubMed] [Google Scholar]
- 3.Behnke, M., J. Radke, A. T. Smith, W. J. Sullivan, and M. W. White. 2009. The transcription of bradyzoite genes in Toxoplasma gondii is controlled by autonomous promoter elements. Mol. Microbiol. 68:1502-1518. [DOI] [PMC free article] [PubMed] [Google Scholar]
- 4.Boothroyd, J. C., and J. F. Dubremetz. 2008. Kiss and spit: the dual roles of Toxoplasma rhoptries. Nat. Rev. Microbiol. 6:79-88. [DOI] [PubMed] [Google Scholar]
- 5.Bougdour, A., C. F. Sautel, D. Cannella, L. Braun, and M. A. Hakimi. 2008. Toxoplasma gondii gene expression is under the control of regulatory pathways acting through chromatin structure. Parasite 15:206-210. [DOI] [PubMed] [Google Scholar]
- 6.Boyle, J. P., B. Rajasekar, J. P. J. Saeij, J. W. Ajioka, M. Berriman, I. Paulsen, L. D. Sibley, M. White, and J. C. Boothroyd. 2006. Just one cross appears capable of dramatically altering the population biology of a eukaryotic pathogen like Toxoplasma gondii. Proc. Natl. Acad. Sci. USA 103:10514-10519. [DOI] [PMC free article] [PubMed] [Google Scholar]
- 7.Buxton, D. 1993. Toxoplasmosis: the first commercial vaccine. Parasitol. Today 9:335-337. [DOI] [PubMed] [Google Scholar]
- 8.Buxton, D., K. Thomson, S. Maley, S. Wright, and H. J. Bos. 1991. Vaccination of sheep with a live incomplete strain (S48) of Toxoplasma gondii and their immunity to challenge when pregnant. Vet. Rec. 129:89-93. [DOI] [PubMed] [Google Scholar]
- 9.Dardé, M. L., B. Bouteille, and M. Pestre-Alexandre. 1992. Isoenzyme analysis of 35 Toxoplasma gondii isolates and the biological and epidemiological implications. J. Parasitol. 78:786-794. [PubMed] [Google Scholar]
- 10.Dubey, J. P. 1992. Isolation of Toxoplasma gondii from a naturally infected beef cow. J. Parasitol. 78:151-153. [PubMed] [Google Scholar]
- 11.Dubey, J. P. 2007. The history and life cycle of Toxoplasma gondii, p. 1-17. In L. M. Weiss and K. Kim (ed.), Toxoplasma gondii: the model apicomplexan. Perspectives and methods. Academic Press/Elsevier, New York, NY.
- 12.Frenkel, J. K., and P. Ambroise-Thomas. 1997. Genomic drift of Toxoplasma gondii. Parasitol. Res. 83:1-5. [DOI] [PubMed] [Google Scholar]
- 13.Frenkel, J. K., J. P. Dubey, and R. L. Hoff. 1976. Loss of stages after continuous passage of Toxoplasma gondii and Besnoitia jellisoni. J. Protozool. 23:421-424. [DOI] [PubMed] [Google Scholar]
- 14.Fux, B., J. Nawas, A. Khan, D. B. Gill, C. Su, and L. D. Sibley. 2007. Toxoplasma gondii strains defective in oral transmission are also defective in developmental stage differentiation. Infect. Immun. 75:2580-2590. [DOI] [PMC free article] [PubMed] [Google Scholar]
- 15.Gajria, B., A. Bahl, J. Brestelli, J. Dommer, S. Fischer, X. Gao, M. Heiges, J. Iodice, J. C. Kissinger, A. J. MacKey, D. F. Pinney, D. S. Roos, C. J. Stoeckert, H. Wang, and B. P. Brunk. 2007. ToxoDB: an integrated Toxoplasma gondii database resource. Nucleic Acids Res. 36:D553-D556. [DOI] [PMC free article] [PubMed] [Google Scholar]
- 16.Gissot, M., K. A. Kelly, J. W. Ajioka, J. M. Greally, and K. Kim. 2007. Epigenomic modifications predict active promoters and gene structure in Toxoplasma gondii. PLoS Pathog. 3:e77. [DOI] [PMC free article] [PubMed] [Google Scholar]
- 17.Howe, D. K., and L. D. Sibley. 1995. Toxoplasma gondii comprises three clonal lineages: correlation of parasite genotype with human disease. J. Infect. Dis. 172:1561-1566. [DOI] [PubMed] [Google Scholar]
- 18.Howe, D. K., and L. D. Sibley. 1994. Toxoplasma gondii: analysis of different laboratory stocks of RH strain reveals genetic heterogeneity. Exp. Parasitol. 78:242-245. [DOI] [PubMed] [Google Scholar]
- 19.Joynson, D. H., and T. J. Wreghitt. 2001. Toxoplasmosis: a comprehensive clinical guide. Cambridge University Press, Cambridge, United Kingdom.
- 20.Kessler, H., A. Herm-Götz, S. Hegge, M. Rauch, D. Soldati-Favre, F. Frischknecht, and M. Meissner. 2008. Microneme protein 8: a new essential invasion factor in Toxoplasma gondii. J. Cell Sci. 121:947-956. [DOI] [PubMed] [Google Scholar]
- 21.Khan, A., U. Bohme, K. A. Kelly, E. Adlem, K. Brooks, M. Simmonds, K. Mungall, M. A. Quail, C. Arrowsmith, T. Chillingworth, C. Churcher, D. Harris, M. Collins, N. Fosker, A. Fraser, Z. Hance, K. Jagels, S. Moule, L. Murphy, S. O'Neil, M. A. Rajandream, D. Saunders, K. Seeger, S. Whitehead, T. Mayr, X. Xuan, J. Watanabe, Y. Suzuki, H. Wakaguri, S. Sugano, C. Sugimoto, I. Paulsen, A. J. Mackey, D. S. Roos, N. Hall, M. Berriman, B. Barell, L. D. Sibley, and J. W. Ajioka. 2006. Common inheritance of chromosome Ia associated with clonal expansion of Toxoplasma gondii. Genome. Res. 16:1119-1125. [DOI] [PMC free article] [PubMed] [Google Scholar]
- 22.Khan, A., B. Fux, C. Su, J. P. Dubey, M. L. Darde, J. W. Ajioka, B. M. Rosenthal, and L. D. Sibley. 2007. Recent transcontinental sweep of Toxoplasma gondii driven by a single monomorphic chromosome. Proc. Natl. Acad. Sci. USA 104:14872-14877. [DOI] [PMC free article] [PubMed] [Google Scholar]
- 23.Khan, A., S. Taylor, J. W. Ajioka, B. M. Rosenthal, and L. D. Sibley. 2009. Selection at a single locus leads to widespread expansion of Toxoplasma gondii lineages that are virulence in mice. PLoS Genet. 5:e1000404. [DOI] [PMC free article] [PubMed] [Google Scholar]
- 24.Khan, A., S. Taylor, C. Su, A. J. Mackey, J. Boyle, R. H. Cole, D. Glover, K. Tang, I. Paulsen, M. Berriman, J. C. Boothroyd, E. R. Pfefferkorn, J. P. Dubey, D. S. Roos, J. W. Ajioka, J. C. Wootton, and L. D. Sibley. 2005. Composite genome map and recombination parameters derived from three archetypal lineages of Toxoplasma gondii. Nucleic Acids Res. 33:2980-2992. [DOI] [PMC free article] [PubMed] [Google Scholar]
- 25.Knoll, L. J., and J. C. Boothroyd. 1998. Isolation of developmentally regulated genes from Toxoplasma gondii by a gene trap with the positive and negative selectable marker hypoxanthine-xanthine-guanine phosphoribosyltransferase. Mol. Cell. Biol. 18:1-8. [DOI] [PMC free article] [PubMed] [Google Scholar]
- 26.Kurta, S., A. Phillippy, A. L. Delcher, M. Smoot, M. Shumay, C. Antonescu, and S. L. Salzberg. 2004. Versatile and open software for comparing large genomes. Genome Biol. 5:R12. [DOI] [PMC free article] [PubMed] [Google Scholar]
- 27.Levine, N. D. 1988. The protozoan phylum Apicomplexa, vol. 1 and 2. CRC Press, Boca Raton, FL.
- 28.Mordue, D. G., F. Monroy, M. La Regina, C. A. Dinarello, and L. D. Sibley. 2001. Acute toxoplasmosis leads to lethal overproduction of Th1 cytokines. J. Immunol. 167:4574-4584. [DOI] [PubMed] [Google Scholar]
- 29.Mui, E. J., D. Jacobus, W. K. Milhous, G. Schiehser, H. Hsu, C. W. Roberts, M. J. Kirisits, and R. McLeod. 2005. Triazine inhibits Toxoplasma gondii tachyzoites in vitro and in vivo. Antimicrob. Agents Chemother. 49:3463-3467. [DOI] [PMC free article] [PubMed] [Google Scholar]
- 30.Mui, E. J., G. A. Schiehser, W. K. Milhous, H. Hsu, C. W. Roberts, M. Kirisits, S. Muench, D. Rice, J. P. Dubey, J. W. Fowble, P. K. Rathod, S. F. Queener, S. R. Liu, D. P. Jacobus, and R. McLeod. 2008. Novel triazine JPC-2067-B inhibits Toxoplasma gondii in vitro and in vivo. PLoS Negl. Trop. Dis. 2:e190. [DOI] [PMC free article] [PubMed] [Google Scholar]
- 31.Nischik, N., B. Schade, K. Dytnerska, H. Dlugonska, G. Reichmann, and H. Fischer. 2001. Attenuation of mouse-virulent Toxoplasma gondii parasites is associated with a decrease in interleukin-12-inducing tachyzoite activity and reduced expression of actin, catalase, and excretory proteins. Microbes. Infect. 3:689-699. [DOI] [PubMed] [Google Scholar]
- 32.O'Driscoll, L., P. Gammell, E. McKiernan, E. Ryan, P. B. Jeppesen, S. Rani, and M. Clynes. 2006. Phenotypic and global gene expression profile changes between low passage and high-passage MIN-6 cells. J. Endocrinol. 191:665-676. [DOI] [PubMed] [Google Scholar]
- 33.Pfefferkorn, E. R. 1978. Toxoplasma gondii: the enzymatic defect of a mutant resistant to 5-fluorodeoxyuridine. Exp. Parasitol. 44:26-35. [DOI] [PubMed] [Google Scholar]
- 34.Pfefferkorn, E. R., and L. C. Pfefferkorn. 1978. The biochemical basis for resistance to adenine arabinoside in a mutant of Toxoplasma gondii. J. Parasitol. 64:486-492. [PubMed] [Google Scholar]
- 35.Pfefferkorn, E. R., and L. C. Pfefferkorn. 1977. Toxoplasma gondii: characterization of a mutant resistant to 5-fluorodeoxyuridine. Exp. Parasitol. 42:44-55. [DOI] [PubMed] [Google Scholar]
- 36.Pfefferkorn, E. R., and L. C. Pfefferkorn. 1976. Toxoplasma gondii: isolation and preliminary characterization of temperature sensitive mutants. Exp. Parasitol. 39:365-376. [DOI] [PubMed] [Google Scholar]
- 37.Radke, J. R., B. Striepen, M. N. Guerini, M. E. Jerome, D. S. Roos, and M. W. White. 2001. Defining the cell cycle for the tachyzoite stage of Toxoplasma gondii. Mol. Biochem. Parasitol. 115:165-175. [DOI] [PubMed] [Google Scholar]
- 38.Radke, J. R., and M. W. White. 1999. Expression of herpes simplex virus thymidine kinase in Toxoplasma gondii attenuates tachyzoite virulence in mice. Infect. Immun. 67:5292-5297. [DOI] [PMC free article] [PubMed] [Google Scholar]
- 39.Roos, D. S., R. G. K. Donald, N. S. Morrissette, and A. L. Moulton. 1994. Molecular tools for genetic dissection of the protozoan parasite Toxoplasma gondii. Methods Cell Biol. 45:28-61. [DOI] [PubMed] [Google Scholar]
- 40.Sabin, A. B. 1941. Toxoplasmic encephalitis in children. JAMA 116:801-807. [Google Scholar]
- 41.Saeij, J. P., J. P. Boyle, and J. C. Boothroyd. 2005. Differences among the three major strains of Toxoplasma gondii and their specific interactions with the infected host. Trends Parasitol. 21:476-481. [DOI] [PubMed] [Google Scholar]
- 42.Sibley, L. D., and J. W. Ajioka. 2008. Population structure of Toxoplasma gondii: clonal expansion driven by infrequent recombination and selective sweeps. Annu. Rev. Microbiol. 62:329-351. [DOI] [PubMed] [Google Scholar]
- 43.Sibley, L. D., and J. C. Boothroyd. 1992. Virulent strains of Toxoplasma gondii comprise a single clonal lineage. Nature 359:82-85. [DOI] [PubMed] [Google Scholar]
- 44.Sibley, L. D., A. J. Charron, S. Hakansson, and D. G. Mordue. 2007. Invasion and intracellular survival by Toxoplasma, p. 16-24. In E. Y. Denkers and R. T. Gazzibelli (ed.), Protozoans in macrophages. Landes Bioscience, Austin, TX.
- 45.Sibley, L. D., M. Messina, and I. R. Niesman. 1994. Stable DNA transformation in the obligate intracellular parasite Toxoplasma gondii by complementation of tryptophan auxotrophy. Proc. Natl. Acad. Sci. USA 91:5508-5512. [DOI] [PMC free article] [PubMed] [Google Scholar]
- 46.Soête, M., D. Camus, and J. F. Dubremetz. 1994. Experimental induction of bradyzoite-specific antigen expression and cyst formation by the RH strain of Toxoplasma gondii in vitro. Exp. Parasitol. 78:361-370. [DOI] [PubMed] [Google Scholar]
- 47.Soête, M., B. Fortier, D. Camus, and J. F. Dubremetz. 1993. Toxoplasma gondii: kinetics of bradyzoite-tachyzoite interconversion in vitro. Exp. Parasitol. 76:259-264. [DOI] [PubMed] [Google Scholar]
- 48.Su, C., D. Evans, R. H. Cole, J. C. Kissinger, J. W. Ajioka, and L. D. Sibley. 2003. Recent expansion of Toxoplasma through enhanced oral transmission. Science 299:414-416. [DOI] [PubMed] [Google Scholar]
- 49.Su, C., D. K. Howe, J. P. Dubey, J. W. Ajioka, and L. D. Sibley. 2002. Identification of quantitative trait loci controlling acute virulence in Toxoplasma gondii. Proc. Natl. Acad. Sci. USA 99:10753-10758. [DOI] [PMC free article] [PubMed] [Google Scholar]
- 50.Taylor, S., A. Barragan, C. Su, B. Fux, S. J. Fentress, K. Tang, W. L. Beatty, E. L. Haijj, M. Jerome, M. S. Behnke, M. White, J. C. Wootton, and L. D. Sibley. 2006. A secreted serine-threonine kinase determines virulence in the eukaryotic pathogen Toxoplasma gondii. Science 314:1776-1780. [DOI] [PubMed] [Google Scholar]
- 51.Thorsten, J., I. B. Holland, and L. Schmitt. 2009. ABC transporters: a smart example of molecular machineries, p. 1-34. In A. Ponte-Sucre (ed.), ABC transporters in microorganisms research innovation and value as targets against drug resistance. Caister Academic Press, Norwich, United Kingdom.
- 52.Weiss, L. M., and K. Kim. 2007. Bradyzoite development, p. 341-366. In L. M. Weiss and K. Kim (ed.), Toxoplasma gondii: the model apicomplexan. Perspectives and methods. Academic Press, Inc., New York, NY.
Associated Data
This section collects any data citations, data availability statements, or supplementary materials included in this article.