

Abstract
Background
Findings from postmortem studies suggest reduced prefrontal cortical thickness in schizophrenia; however, cortical thickness in first-episode schizophrenia has not been evaluated using magnetic resonance imaging (MRI).
Methods
Prefrontal cortical thickness was measured using MRI in first-episode schizophrenia patients (n = 17), first-episode affective psychosis patients (n = 17), and normal control subjects (n = 17); subjects were age-matched within 2 years and within a narrow age range (18–29 years). A previous study using the same subjects reported reduced prefrontal gray matter volume in first-episode schizophrenia. Manual editing was performed on those prefrontal segmentations before cortical thickness was measured.
Results
Prefrontal cortical thickness was not significantly different among groups. Prefrontal gray matter volume and thickness were, however, positively correlated in both schizophrenia and control subjects. The product of boundary complexity and thickness, an alternative measure of volume, was positively correlated with volume for all three groups. Finally, age and age at first medication were negatively correlated with prefrontal cortical thickness only in first-episode schizophrenia.
Conclusions
This study demonstrates the potential usefulness of MRI for the study of cortical thickness abnormalities in schizophrenia. Correlations between cortical thickness and age and between cortical thickness and age at first medication suggest that the longer the schizophrenic process has been operative, the thinner the prefrontal cortex, although this needs confirmation in a longitudinal study.
Keywords: Schizophrenia, magnetic resonance imaging, prefrontal cortex, cortical thickness, gray matter, age
The frontal lobes have long been suspected in the neuropathology of schizophrenia (e.g., Kraepelin 1919). Current interest in frontal lobe neuropathology reflects, in part, neuropsychologic observations of similarities in impairments between patients with schizophrenia and those with frontal lobe damage, including poor performance on the Wisconsin Card Sorting Test (Weinberger et al 1986), on spatial working memory tasks (Park and Holzman 1992), and on verbal and visual short-term memory tasks (Stirling et al 1997). The neural circuitry underlying these cognitive functions primarily involves the frontal lobes and frontolimbic or paralimbic regions (e.g., Goldman-Rakic and Selemon 1997; Lewis and Gonzalez-Burgos 2000). Lesion and depth-recording data in nonhuman primates implicate the prefrontal cortex in performance on analogs of these tests (for review, see Miller 1999). Functional studies (i.e., positron emission tomography [PET] and functional magnetic resonance imaging [fMRI]) have also reported abnormal activation in the frontal lobes in schizophrenia (for review, see Manoach 2003), although convincing evidence of gross frontal neuroanatomic structural abnormalities in schizophrenia has been equivocal. Recent reports of more subtle cellular abnormalities in the frontal lobe suggest abnormal connectivity between local cortical circuits and cortico-cortical and cortico-subcortical connectivity (e.g., Rajkowska et al 1998).
Postmortem studies have examined the cellular basis of prefrontal cortical dysfunction in schizophrenia (e.g., Selemon et al 1998; Thune et al 2001). Studies investigating neuronal density in schizophrenia are conflicting, with studies reporting increased (Rajkowska et al 1998; Selemon et al 1995, 1998), decreased (Benes et al 1986, 1991), or unchanged neuronal density (Akbarian et al 1995; Thune et al 2001), but the lack of significant gliosis is robust (Heckers 1997; Roberts et al 1986; Weinberger 1987). A postmortem study by Selemon et al (1998) reported an 8% reduction in cortical thickness in prefrontal area 46, only significant in layer II, in schizophrenic patients compared with normal control subjects. This study gave rise to the “decreased neuropil hypothesis,” that is, the notion that frontal lobe pathology in schizophrenia involves a reduction in the elements of neuronal connectivity (i.e., neuronal and glial processes) rather than neuronal cell death (Goldman-Rakic and Selemon 1997; Rajkowska et al 1998; Selemon et al 1998). Alternative views are that a selective reduction of inhibitory interneurons, a decreased formation of synaptic process, or a decreased input of thalamic projections, result in subtle changes of prefrontal cortical thickness and volume in schizophrenia (Lewis and Lieberman 2000).
MRI findings of frontal lobe volume deficits in schizophrenia have been relatively inconsistent (for review, see McCarley et al 1999; Shenton et al 2001), with several studies reporting reduced volume in patients with schizophrenia (e.g., Gur et al 1998; Nopoulos et al 1995) and others reporting no significant differences (e.g., Baare et al 1999). Despite the inconsistencies for whole frontal lobe volume, when gray and white matter are separated and specific regions of the prefrontal cortex are examined, gray matter abnormalities in schizophrenia are frequently detected (e.g., Gur et al 2000; Hirayasu et al 2001; Lim et al 1996; Schlaepfer et al 1994; Sullivan et al 1998), but not always (Wible et al 1995). For example, Hirayasu et al (2001) reported a significant reduction in total (left + right) prefrontal gray matter volume (8.4%), moderately worse in the left hemisphere, in first-episode schizophrenia patients compared with first-episode affective patients with psychosis and normal control subjects. Finally, these inconsistent findings highlight the importance of controlling for potential confounds, including age and chronic medication, because prefrontal gray matter volume likely declines with age, possibly more than other brain regions (Pfefferbaum et al 1994), and chronic antipsychotic exposure may result in neuroanatomic changes (Selemon et al 1999).
With recent advances in neuroimaging technology, it is now possible to study cortical thickness in vivo (Kabani et al 2001). To our knowledge, while MRI has been used to measure cortical thickness in one study of chronic schizophrenia (Kuperberg et al, in press), this is the first study of cortical thickness in first-episode schizophrenia. In this study, we measured prefrontal cortical thickness using MRI in young (< 30 years old) first-episode patients with schizophrenia, first-episode patients with psychotic affective disorder (mainly manic), and normal control subjects. We measured cortical thickness using a technique originally developed for evaluating the thickness of knee cartilage (Nabavi et al 2001), and later extended to bladder wall thickness as a means of detecting bladder tumors (Schreyer et al 2000).
We here define cortical thickness, at each voxel on the prefrontal gray matter–cerebrospinal fluid (CSF) boundary, as the distance from that point to the nearest point on the gray matter–white matter boundary. Mean thickness was then computed from the thickness values found along the gray matter–CSF boundary of the prefrontal cortex. Of note, because this study is the first time this program has been applied to the brain, we used an MRI data set with demonstrated prefrontal gray matter volume reduction in first-episode schizophrenia (Hirayasu et al 2001). For our measure of volume, voxels were summed over all the slices that included prefrontal gray matter. This value was then corrected for head and brain size using intracranial cavity volume. We also included a measure of the surface area of the prefrontal gray matter boundary, derived from the gray matter and CSF voxel count. This measure, in addition to being an estimate of the cortical surface area, is also an estimate of the complexity of the cortical surface. We included this measure, multiplied by prefrontal gray matter volume, as an alternative estimate of gray matter volume for each subject.
We hypothesized that prefrontal cortical thickness would be reduced in patients with schizophrenia compared with a contrast group of affective patients with psychosis and normal control subjects. We were also interested in evaluating whether cortical thickness would be correlated with age, as suggested by the reduction of gray matter with age in the literature (Lim et al 1992; Pfefferbaum et al 1994), even in this narrow age range. Additionally, we were interested in evaluating the relationship between cortical thickness and clinical variables such as negative and positive symptoms.
Methods and Materials
Subjects
Patients were recruited from consecutive admissions at McLean Hospital, a private psychiatric hospital in Belmont, Massachusetts. The subjects used came from a previous study by Hirayasu et al (2001). The sample consisted of patients with first-episode schizophrenia (n = 17) and patients with first-episode affective psychosis (n = 17), diagnosed based on DSM-IV criteria using The Structured Clinical Interview for Diagnosis (Spitzer et al 1990a), and psychiatrically well control subjects (n = 17), recruited through newspaper advertisements, with SCID nonpatient edition (NP) and SCID II interviews administered to rule out psychopathology (Spitzer et al 1990b, 1990c). Each subject group included two female subjects. The affective psychosis patient group included 13 bipolar (manic) disorder and 4 major depressive disorder patients. Subjects met the criterion for age (18–29 years), IQ above 75, right-handedness, and negative history of seizures, head trauma with loss of consciousness or neurologic disorder, and no lifetime history of alcohol or other drug dependence or current abuse (i.e., in the last year). Comparison subjects were excluded if they (by SCID NP) or their first-degree relatives (by self-report) had an Axis I mental disorder or met criteria for Cluster A or B Personality Disorder. Diagnoses were confirmed with a 1-year follow-up interview where possible (for details, see Hirayasu et al 2001).
The time between the diagnostic clinical interview, the clinical scales (including the Global Assessment Scale, and the Brief Psychiatric Rating Scale, and neuropsychologic testing), and the MRI scan was relatively short (median time for schizophrenia group = 4 days, for affective group = 5 days, for control subjects = 16 days).
Selection of the age-matched subject triads was performed blind to MRI results. Schizophrenia subjects were matched within 1 year of age to 14 (82%) of the pairs of affective subjects and control subjects. The maximum age difference between members of the subject triads was 2 years. Twenty-four patients (11 affective and 13 schizophrenia subjects) entered the protocol within 4 weeks of their first hospitalization, 9 (six affective and three schizophrenic subjects) within 4 months of first hospitalization, and one patient with schizophrenia within 11 months. Demographic data are summarized in Table 1.
Table 1.
Subject Characteristics and Test Scores
| Patients with Schizophrenia (n = 17) | Patients with Affective Psychosis (n = 17) | Normal Controls (n = 17) | F | df | p | |
|---|---|---|---|---|---|---|
| Age (range) | 22.9 ± 3.7 (18 –29) | 22.6 ± 3.9 (18 –30) | 22.2 ± 3.2 (18 –27) | .141 | 2,48 | .869 |
| Male/Female | 15/2 | 15/2 | 15/2 | |||
| Handednessa | .8 ± .2 | .7 ± .2 | .8 ± .2 | .634 | 2,47 | .535 |
| SESb | 3.5 ± 1.2c | 2.9 ± 1.4 | 2.1 ± .7 | 6.972 | 2,48 | .002 |
| Parental SES | 2.1 ± 1.1 | 1.8 ± .8 | 1.6 ± .9 | .843 | 2,48 | .437 |
| Mini-Mental | 27.9 ± 2.9 | 28.6 ± 1.8 | 28.9 ± 1.3 | 1.008 | 2,46 | .373 |
| WAIS-R Informationd | 10.9 ± 3.3 | 11.6 ± 3.5 | 13.1 ± 2.8 | 2.035 | 2,46 | .142 |
| WAIS-R Digits—Forwarde | 8.6 ± 2.3 | 8.4 ± 2.4 | 9.4 ± 2.4 | .868 | 2,46 | .426 |
| WAIS-R Digits—Backward | 7.1 ± 2.6 | 6.8 ± 2.2 | 8.6 ± 2.4 | 2.520 | 2,46 | .091 |
| WAIS-R Digits—Total | 10.1 ± 2.5 | 9.7 ± 2.8 | 10.8 ± 2.2 | .733 | 2,46 | .486 |
| GASf | 36.7 ± 9.9 | 41.2 ± 17.1 | — | .889 | 1,31 | .353 |
| Age First Medicated | 22.5 ± 3.8 | 22.3 ± 3.8 | — | .019 | 1,32 | .893 |
| Median Duration of Medication, Days (range) | 15 (0 –765) | 10 (0 –549) | — | — | — | — |
| Medication (CPZ Equiv.)g | 327 ± 434 | 230 ± 193 | — | .695 | 1,32 | .411 |
| BPRS totalh | 37.8 ± 11.5 | 37.4 ± 12.2 | — | .009 | 1,31 | .924 |
Data are presented as mean ± SD. Statistical significance was determined by a one-factor analysis of variance.
Handedness was assessed by the modified Oldfield Inventory (Oldfield 1971).
Socioeconomic status (SES) and parental SES were assessed using the Hollingshead Two-Factor measure (Hollingshead 1965). Higher scores indicate lower SES.
Post hoc Tukey’s Honestly Significant Difference (HSD) test showed significant difference (p < .05) between patients with schizophrenia and normal control subjects.
The Information Subscale of the Wechsler Adult Intelligence Scale—Revised (WAIS-R) was used as a gross estimate of general fund of information, scaled scores (Wecshler 1981).
The digits-forward and digits-backward subscales of the WAIS-R were used to evaluate immediate and short-term memory, attention, and concentration. Digits total, scaled scores.
Overall functioning was evaluated using the Global Assessment Scale (GAS; Endicott et al 1976).
Differences between Hirayasu et al (2001) medication means and the means reported here are due to newly available equivalence factors for atypical antipsychotics. CPZ Equiv, chlorpromazine equivalent.
The Brief Psychiatric Rating Scales (BPRS; Overall and Gorham 1962), used to evaluate psychotic features in six first-episode schizophrenia patients and in four affective psychosis patients. BPRS scores were calculated from the Positive and Negative Syndrome Scale (PANSS; Kay et al 1986).
Date of first psychiatric hospitalization was chosen as a reliable marker of the time of onset of psychosis. Age at time of first medication and median duration of any medication before MRI acquisition are shown in Table 1. Note that 13 of the 17 schizophrenia patients were medicated for less than 1 month (including one never medicated), with a median duration of 15 days. For the affective patients, 13 of 17 were medicated less than 1 month (including three never medicated), with a median duration of 10 days.
Following a complete description of the study, written informed consent was obtained from each subject. Subjects were paid for participating. The institutional review boards of both McLean Hospital and the VA Boston Healthcare System approved this study.
MRI Methodology
Images were obtained on a 1.5-Tesla General Electric scanner (General Electric Medical Systems, Milwaukee, Wisconsin). Two MRI images were acquired following a scout image. The first consisted of a coronal series of contiguous spoiled gradient (SPGR) images: 124 slices, 1.5 mm thickness, voxel (volume of pixel) dimensions .9375 × .9375 × 1.5 mm, repetition time = 35 msec, echo time = 5 msec, 1 repetition, 45 nutation angle, 24-cm field of view, number of excitations = 1.0, matrix = 265 × 256 (192 phase encoding steps) × 124. Data were reformatted in the coronal plane and analyzed as 124 coronal 1.5-mm-thick slices. The second protocol was an axial series of contiguous double echo images (proton density and T2-weighted): voxel dimensions .9375 × .9375 × 3mm, 3-mm slice thickness, repetition time = 3000 msec, echo time = 30 and 80 msec, 24-cm field of view, and interleaved acquisition. The latter protocol was used to evaluate whole brain volume. Details are described elsewhere (Dickey et al 2000). An iterative expectation-maximization (EM) algorithm was used that estimates image intensity inhomogeneities, applies intensity corrections based on these estimates, and then classifies tissue based on the same set of signal intensity parameters for all subjects (Wells et al 1996). To reduce noise before processing each set of scans, an anisotropic diffusion filter (k = 3) was 14 for SPGR and 90 for proton/T2 images, iteration = 3applied (Gerig et al 1992; Kikinis et al 1990). Finally, the results of the segmentation were superimposed on the coronal SPGR image and edited on computer workstations (SPARC2 Sun Microsystems, Mountain View, California) using locally developed software algorithms to assign left and right prefrontal gray and white matter to separate tissue classes.
Prefrontal Definition
Definitions of prefrontal gray and white matter, including interrater reliability, are detailed in Hirayasu et al (2001). Briefly, prefrontal gray matter was measured anteriorly from the first slice containing brain tissue, and extended posteriorly to the slice that was three slices anterior to the most anterior slice containing the temporal stem (the white matter tract connecting the temporal and frontal lobes). Prefrontal white matter was measured anteriorly from the first slice containing white matter and extended posteriorly to the slice immediately anterior to that containing the lateral ventricles (Hirayasu et al 2001). We used these prefrontal gray and white matter segmentations to measure prefrontal cortical gray matter thickness.
Editing of Cortical Sulci
Manual editing of prefrontal segmentations was necessary to fully expose the cortical sulci so that cortical thickness measures could be obtained. One source of error in thickness measurement results from incomplete delineation of the cortical sulci (e.g., Fischl and Dale 2000), which results in an overestimation of cortical thickness. Manual editing of prefrontal gray and white matter segmentations was performed to remove nonbrain voxels (e.g., CSF) within the sulci. The majority of editing consisted of extending sulci that were only partially defined by the automatic segmentation (see Figure 1). Once manual editing was completed, the cortical thickness algorithm was applied to the segmentations (Jaume et al 2002; Schreyer et al 2000; Nabavi et al 2001). Interrater reliability was computed for three randomly selected cases by two independent raters blind to group membership. Intraclass correlation coefficients were .9382 for right prefrontal gray matter thickness and .8064 for left prefrontal gray matter thickness.
Figure 1.
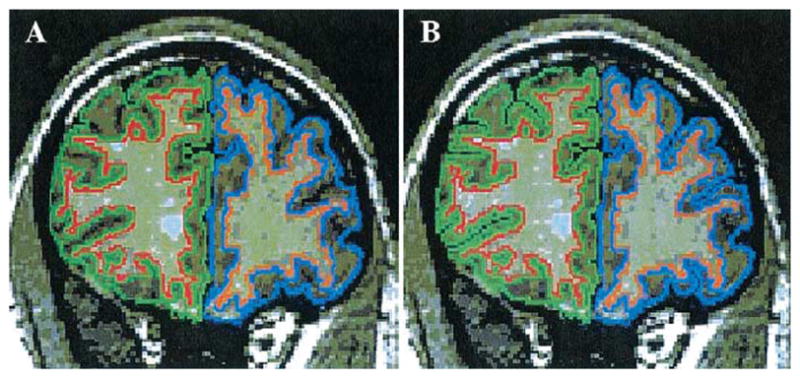
(A) Coronal slice (1.5 mm) with unedited cortical sulci through the prefrontal region of a patient with first-episode schizophrenia. (B) Same coronal slice after manual editing of the cortical sulci. Right prefrontal gray matter is outlined in green and left prefrontal gray matter is outlined in blue.
Measurement of Prefrontal Cortical Thickness
Cortical thickness was defined at each voxel on the gray matter–CSF boundary as the distance from that point to the nearest point on the gray matter–white matter boundary. The algorithm begins by identifying the contour of each cortical surface. A distance transform (Borgefors 1984; Warfield 1996) computes the distance from each voxel on the gray matter-white matter boundary to every voxel in the data set. The gray matter–CSF boundary is then traversed and the thickness identified as the distance to the nearest voxel on the gray matter–white matter boundary that is computed by the distance transform. This distance measurement is three-dimensional, avoiding geometric errors, which can arise in two-dimensional slice-by-slice thickness calculations. The output of the thickness program provides the mean, minimum, and maximum thickness (millimeters) of the prefrontal gray matter for each prefrontal segmentation. Mean thickness is computed from the thickness values found along the gray matter–CSF boundary of the prefrontal cortex.
Measurement of Surface Area and Complexity
The output of the thickness program also provides the length of the prefrontal cortical gray matter–CSF boundary in voxels (the size of each voxel is .9375 × .9375 × 1.5 mm3). The gray matter–CSF voxel count is a dimensionless value that refers to the number of voxels on the gray matter–CSF boundary of the prefrontal cortex and is a rough measure of the complexity of the cortical surface as well as an estimate of cortical surface area.
More specifically, to measure cortical surface area we calculated the number of voxels on the gray matter–CSF boundary at which we evaluated the thickness; this number increases with increasing brain surface, such as would occur with increased gyrification, and decreases with decreasing brain surface and less gyrification but is susceptible to voxel discretization artifacts. This measure, in addition to being an estimate of the cortical surface area, is also an estimate of the complexity of the cortical surface. We also included this measure, multiplied by prefrontal gray matter volume, as an alternative estimate of gray matter volume for each subject. We thus expected a strong correlation between the volume of the cortex, and the product of the mean thickness and the number of voxels identified on the surface of the cortex (an approximation to total surface area). Furthermore, by including both thickness and surface area measures, we believed we could better probe the true nature of the structural abnormality that leads to volume changes. For example, volume may be different between groups given equivalent cortical thickness, but decreased gyrification in one group, or alternatively, the gyrification of two groups may be the same (and hence surface area the same), but the cortical thickness may be reduced in one group.
Prefrontal Gray Matter Surface Reconstruction
Thickness of the cortical gray matter is indicated using a fixed color scale and reconstructed into a color-coded, three-dimensional surface model. Thickness values at the gray matter–CSF boundary are assigned to triangle vertices. A nearest neighbor search is then applied to map from triangle vertex coordinates to the contour locations to correctly associate the triangle vertices with the thickness value closest to its final location. The thickness values associated with triangle vertices are used to color code the triangles in the rendered representation (Schreyer et al 2000; Schroeder et al 1996; see Figure 2).
Figure 2.
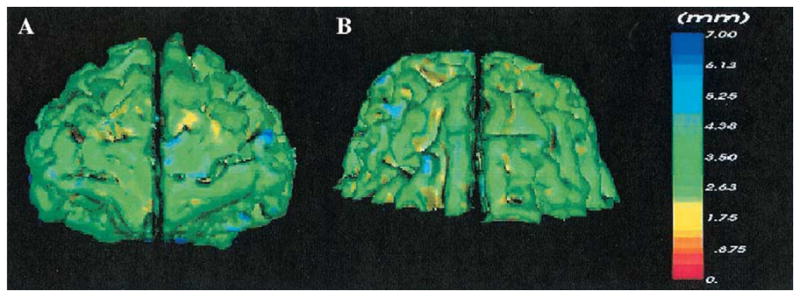
(A) Front view of the prefrontal gray matter reconstruction. (B) Top view of the prefrontal gray matter reconstruction. The three-dimensional color-coded models of the prefrontal cortex display the thickness of the gray matter at each point on the gray matter– cerebrospinal boundary. Thickness was defined at each voxel on the gray matter– cerebrospinal fluid boundary as the distance from that point to the nearest point on the gray matter–white matter boundary. The color-coding scale, in millimeters, ranges from red = 0 mm to blue = 7 mm.
Statistical Analyses
Demographic and psychological measures for all groups, including age, patient socioeconomic status (SES), three sub-scales of the Weschsler Adult Intelligence Scale—Revised, and clinical measures for the patient groups, including the Mini-Mental Status Examination, the Global Assessment Scale Scores, Total Brief Psychiatric Rating Scale Score, age of first medication, and medication dosage (chlorpromazine equivalence, Table 1), and intracranial contents (ICC) were tested with one-way analysis of variance (ANOVA) with Group (first-episode schizophrenia, first-episode affective psychosis, control) as the between-group factor. First-episode patients with schizophrenia showed significantly lower SES compared with normal control subjects, consistent with reduced premorbid functioning. Other demographic and neuropsychologic measures did not differ between groups (see Table 1).
Prefrontal gray matter volume and thickness were analyzed using a two-factor ANOVA with Group (first-episode schizophrenia, first-episode affective psychosis, control) as a between-subjects factor and Side (left, right) as a within-subjects factor, reedited in this study to highlight sulci (as noted earlier). Follow-up analyses included one-way ANOVA and post hoc Tukey’s Honestly Significant Difference (HSD) tests for gray matter volume with left and right hemispheres compared separately. In addition, an asymmetry coefficient (AC) was calculated for absolute thickness using the formula (R − L)/.5(R + L), where R and L were the prefrontal cortical thickness measurements in each hemisphere. All results were considered significant at p < .05.
As cortical thickness is a relatively new measure, several methods were used to correct thickness measurements for variations in brain size. Relative thickness was calculated using the following formula: ROI mean thickness/X × 100, where X equaled ICC, prefrontal gray matter volume, or cubed root of prefrontal gray matter volume. Statistics were performed individually for all relative thickness values.
Correlations between prefrontal cortical thickness and demographic data were performed independently for each subject group. For patient groups, exploratory correlations were also performed between absolute prefrontal cortical thickness and clinical symptom measures. Additional correlations were performed between absolute prefrontal cortical thickness and absolute and relative prefrontal gray matter volumes independently for each subject group.
Finally, thickness was multiplied by cortical boundary complexity to obtain an alternative estimate of cortical gray matter volume for each subject.
Results
Prefrontal Volume
The absolute and relative prefrontal gray matter volumes for each group, as well as follow-up analyses, are presented in Table 2. The main two-factor ANOVA revealed significant differences in total relative prefrontal gray matter volume among the three groups [F(2,48) = 3.52, p = .037]. There was significantly more gray matter in the left hemisphere for all three groups [F(1,48) = 4.28, p = .044]. There was no hemisphere-by-diagnosis interaction [F(2,48) = .943, p = .40]. Planned comparisons of volume in each hemisphere, to confirm the findings of Hirayasu et al (2001), showed that patients with first-episode schizophrenia had significantly smaller left relative gray matter volume compared with patients with first-episode affective psychosis (p = .046) and normal control subjects (p = .026), but no significant right hemisphere reduction in relative gray matter volume compared with first-episode affective patients (p = .13) and control subjects (p = .11).
Table 2.
Absolute (mL) and Relative Gray Matter Volumes and Absolute Thickness (mm) in the Prefrontal Cortex, Boundary Complexity, and the Product of Thickness and Boundary Complexity in First-Episode Schizophrenia, First-Episode Affective Psychosis, and Normal Controls Subjects
| Schizophrenia (n = 17) | Affective Psychosis (n = 17) | Control (n = 17) | F | df | p | |
|---|---|---|---|---|---|---|
| Total Intracranial Contents (ICC) | 1513 ± 117 | 1496 ± 153 | 1506 ± 142 | .496 | 2,48 | .61 |
| Total Prefrontal Gray Matter Volume | 151.68 ± 18.79 (10.04 ± 1.10) | 159.53 ± 18.03 (10.88 ± .83) | 164.85 ± 25.42 (10.94 ± 1.34) | 3.421 3.525 |
2,47 2,48 |
.041 .037 |
| Left Prefrontal Gray Matter Volume | 75.89 ± 9.25 (5.02 ± .54a) | 80.22 ± 8.97 (5.47 ± .41) | 83.14 ± 12.43 (5.52 ± .63) | 4.408 4.430 |
2,47 2,48 |
.018 .017 |
| Right Prefrontal Gray Matter Volume | 75.79 ± 9.77 (5.02 ± .57) | 79.32 ± 9.25 (5.41 ± .44) | 81.71 ± 13.13 (5.42 ± .72) | 2.498 2.650 |
2,47 2,48 |
.093 .081 |
| Total Prefrontal Cortical Mean Thickness | 3.52 ± .27 | 3.48 ± .16 | 3.56 ± .25 | .574 | 2,48 | .567 |
| Left Prefrontal Cortical Mean Thickness | 3.50 ± .24 | 3.47 ± .14 | 3.54 ± .26 | .503 | 2,48 | .608 |
| Right Prefrontal Cortical Mean Thickness | 3.54 ± .29 | 3.48 ± .18 | 3.57 ± .23 | .624 | 2,48 | .540 |
| Total Prefrontal Boundary Complexity | 24439.41 ± 2383.43 | 25421.88 ± 2844.00 | 24430.29 ± 2574.63 | .812 | 2,48 | .450 |
| Left Prefrontal Boundary Complexity | 12233.00 ± 1173.45 | 12856.65 ± 1414.47 | 12517.00 ± 1475.76 | .895 | 2,48 | .415 |
| Right Prefrontal Boundary Complexity | 12206.41 ± 1259.81 | 12565.24 ± 1495.42 | 11913.29 ± 1210.07 | 1.028 | 2,48 | .365 |
Data are presented as mean ± SD. Relative volumes (% total ICC) are in parentheses. One-factor analysis of variance (ANOVA) was used to compute statistical significance levels on relative volumes and absolute mean thickness. For absolute volumes, statistical significance levels were computed using one-factor analysis of covariance on absolute volumes with ICC as a covariate. Note the similarity of p values from using relative volumes (% total ICC) and one-factor ANOVA.
Post hoc Tukey’s Honestly Significant Difference (HSD) tests indicated that patients with schizophrenia were significantly different from both affective psychosis patients and normal control subjects.
Prefrontal Thickness
There were no significant differences in total absolute pre-frontal cortical thickness among groups [F(2,48) = .57, p = .57; see Table 3 and Figure 3]; however, the main ANOVA revealed significantly thicker prefrontal cortex in the right hemisphere for all three groups [F(1,48) = 6.63, p = .013]. No hemisphere-by-diagnosis interaction was found [F(2,48) = .37, p = .69]. One-way ANOVA showed no significant difference in the asymmetry coefficient among the three groups for absolute prefrontal cortical thickness [F(2,48) = .384, p = .683]. Similarly, when using relative thickness measures, the results were unchanged.
Table 3.
Significant Correlations between Prefrontal Gray Matter Volume, Thickness, and Boundary Complexity
| Correlation | Subject Group | rho | df | p |
|---|---|---|---|---|
| Left Absolute Thickness with Left Absolute Volume | Schizophrenia | .547 | 15 | .023 |
| Left Absolute Thickness with Left Relative Volume | Schizophrenia | .488 | 15 | .047 |
| Right Absolute Thickness with Right Absolute Volume | Schizophrenia | .645 | 15 | .005 |
| Right Absolute Thickness with Right Relative Volume | Schizophrenia | .603 | 15 | .010 |
| Total Volume with Product of Total Boundary Complexity and Total Thicknessa | Schizophrenia | .814 | 15 | <.001 |
| Left Volume with Product of Left Boundary Complexity and Left Thicknessa | Schizophrenia | .836 | 15 | <.001 |
| Right Volume with Product of Right Boundary Complexity and Right Thicknessa | Schizophrenia | .799 | 15 | <.001 |
| Total Volume with Product of Total Boundary Complexity and Total Thicknessa | Affective psychosis | .706 | 15 | .002 |
| Left Volume with Product of Left Boundary Complexity and Left Thicknessa | Affective psychosis | .743 | 15 | .001 |
| Right Volume with Product of Right Boundary Complexity and Right Thicknessa | Affective psychosis | .674 | 15 | .003 |
| Total Volume with Product of Total Boundary Complexity and Total Thicknessa | Normal control | .919 | 15 | <.001 |
| Left Volume with Product of Left Boundary Complexity and Left Thicknessa | Normal control | .848 | 15 | <.001 |
| Right Volume with Product of Right Boundary Complexity and Right Thicknessa | Normal control | .914 | 15 | <.001 |
Absolute values.
Figure 3.
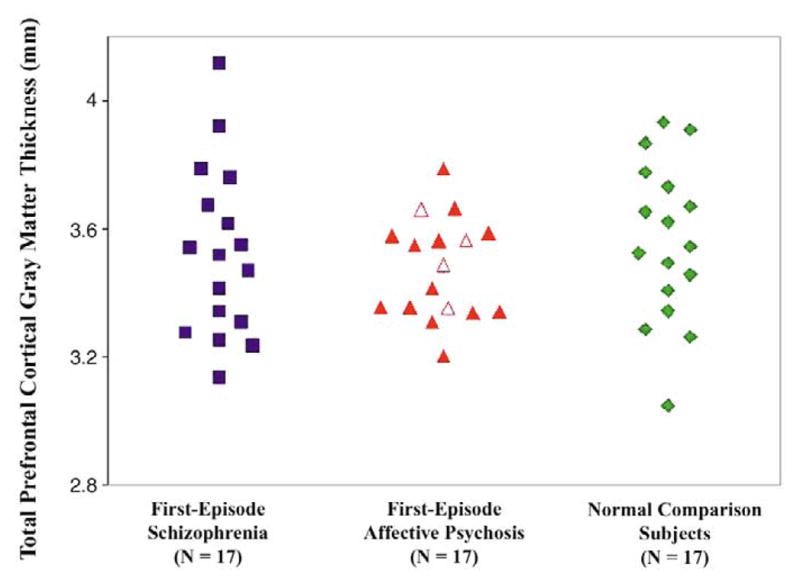
Total (left + right) absolute thickness of the prefrontal gray matter in patients with first-episode schizophrenia, patients with first-episode affective psychosis, and normal comparison subjects. Open triangles indicate patients with unipolar affective psychosis, closed triangles represent bipolar (manic) patients.
Surface Area and Complexity Measure
We performed a two-factor ANOVA for prefrontal gray matter boundary complexity. There was no main effect for diagnosis [F(2,48) = .812, p = .45]; however, there was a significant hemisphere effect [F(1,48) = 11.207, p = .002] and a significant hemisphere-by-diagnosis interaction [F(2,48) = 3.303, p = .045]. Similarly, we performed a two-factor ANOVA for the product of cortical thickness and boundary complexity. There was no main effect for diagnosis [F(2,48) = .201, p = .819]; however, there was a significant hemisphere effect [F(1,48) = 5.651, p = .021] and a significant hemisphere-by-diagnosis interaction [F(2,48) = 3.842, p = .028]. These findings are explained by left-greater-than-right asymmetry for the product of thickness and boundary complexity in both normal control subjects and affective patients, with the reverse pattern of right-greater-than-left asymmetry in patients with schizophrenia.
Correlations
Prefrontal gray matter volume and absolute thickness were significantly correlated in first-episode patients with schizophrenia and in normal control subjects. In schizophrenia patients, total prefrontal cortical absolute thickness was significantly correlated with total prefrontal gray matter absolute volume (rho = .569, df = 15, p = .017) and relative volume (rho = .493, df = 15, p = .045; see Figure 4a). These correlations were similar for the left and right hemispheres (see Table 3). Similarly, total prefrontal cortical absolute thickness in normal control subjects significantly correlated with total prefrontal gray matter absolute volume (rho = .534, df = 15, p = .027) and relative volume (rho = .495, df = 15, p = .043; see Figure 4b). These correlations suggest that patients with schizophrenia and normal control subjects who have larger prefrontal gray matter volumes also have thicker prefrontal gray matter. No significant correlations were found between prefrontal cortical absolute thickness and prefrontal gray matter absolute volume (rho = −.100, df = 15, p = .70) or relative volume (rho = −.0292, df = 15, p = .26; see Figure 4c) in patients with first-episode affective psychosis.
Figure 4.

(A) Positive correlation between total (left + right) pre-frontal gray matter relative volume and total prefrontal cortical absolute thick-ness in first-episode patients with schizophrenia (rho=.493; p =.045). (B) Positive correlation between total (left + right) prefrontal gray matter relative volume and total prefrontal cortical absolute thickness in normal comparison subjects (rho = .495; p = .043). (C) Correlations between total (left = right) prefrontal gray matter relative volume and total prefrontal cortical absolute thickness in first-episode patients with affective psychosis. Volume and thickness are not significantly correlated (rho = − .292; p =.256).
In addition, the product of boundary complexity and thickness significantly correlated with prefrontal gray matter absolute volume (calculated by multiplying the number of voxels of gray matter in the prefrontal cortex by the volume of a voxel) in all three groups (see Figure 5).
Figure 5.

Positive correlation between total (left + right) prefrontal gray matter absolute volume and the product of total absolute thickness and total boundary complexity (rho =.814, p <.001 for schizophrenia patients; rho = .706, p = .002 for affective patients; rho = .919, p < .001 for normal control subjects).
Finally, significant correlations were found in the schizophrenia group only between absolute prefrontal cortical thickness and age. Age at scan was negatively correlated with total absolute thickness (rho = −.509, df = 15, p = .037; see Figure 6) and right absolute thickness (rho = −.540, df = 15, p = .025). These correlations suggest that older patients with schizophrenia had a thinner cortex than younger patients. Also of note, age at time of first medication was significantly negatively correlated only in the schizophrenia group with total absolute thickness (rho = −.498, df = 16, p = .042) and with right absolute thickness (rho = −.526, df = 16, p = .030). These correlations suggest that the younger a schizophrenia patient was when treated with medication, the thicker the prefrontal cortex, and the older a schizophrenia patient was when treated with medication, the thinner the cortex. The correlation between age at medication and age was, however, above .90. No significant correlations were found between prefrontal cortical thickness and age in affective psychosis or in normal comparison subjects. Additionally, there was no significant correlation between prefrontal cortical thickness and age at first medication in patients with affective psychosis.
Figure 6.

Negative correlation between age and total (left + right) prefrontal cortical thickness in first-episode schizophrenia (rho =−.509; p =.037).
No other significant correlations were found between absolute thickness and demographic data or clinical measures.
Discussion
In this study, we measured cortical thickness and boundary complexity (an estimate of cortical surface area) of the prefrontal cortex in first-episode patients diagnosed with schizophrenia, first-episode patients diagnosed with affective psychosis, and in control subjects. This sample was selected because in a previous study of the same subjects, reduced prefrontal gray matter volume was reported in first-episode schizophrenia (Hirayasu et al 2001). In accord with the previous study using the same subjects, we replicated the finding of significantly smaller left prefrontal gray matter volume in first-episode patients with schizophrenia compared with first-episode patients with affective psychosis and normal control subjects despite manual editing of the cortical sulci. This finding suggests that the manual editing of the cortical sulci necessary for accurate thickness measures did not appreciably alter the data set.
There were several main findings in our study. First, counter to expectation, prefrontal cortical thickness did not differ between subject groups. Second, we found a positive correlation between prefrontal gray matter volume and prefrontal cortical thickness in normal control subjects and first-episode patients with schizophrenia, but not in first-episode patients with affective psychosis. Third, using an alternate measure for volume (calculated as the product of cortical thickness and boundary complexity), we found a correlation between this product and prefrontal gray matter volume in all three subject groups. Finally, cortical thickness negatively correlated with age, and with age at first medication, in the schizophrenia group alone. Our findings are important because, to our knowledge, they represent the first time that prefrontal cortical thickness has been measured in a first-episode patient population.
The absence of a significant difference in prefrontal cortical thickness among subject groups does not appear to be the result of erroneous measurement of cortical thickness because the thickness values reported in this study are in agreement with findings from previous studies of cortical thickness. In this study, normal control subjects had an average thickness of 3.56 mm in the prefrontal cortex. The published literature suggests that the human cerebral cortex has a thickness varying between 1 and 4.5 mm, with an overall average of approximately 2.5 mm (Kandel et al 2000). Furthermore, the prefrontal cortex is thought to be one of the thickest regions of cortical gray matter (e.g., Fischl and Dale 2000; Zeng et al 1999). The slightly higher mean thickness values reported in our study were to be expected because postmortem measurements suffer from brain shrinkage due to fixing and staining techniques whereas in vivo measurements do not (Kabani et al 2001).
The absence of a group difference in cortical thickness raises the issue of how volume might differ if thickness is the same. Furthermore, against expectation, prefrontal cortical thickness and volume did not correlate across all three subject groups. We believe the explanation for these findings lies in an understanding of the relationship between cortical thickness and volume. After all, thickness alone need not correlate with volume, but rather it is the sum of the product of local thickness and local surface area that equals volume, and thus must correlate with volume. Hence, we measured boundary complexity (an estimate of surface area) as well as thickness, for each subject. We were pleased to find that, as predicted, the product of cortical thickness and boundary complexity strongly correlated with our volume measurement (the product of the number of voxels of prefrontal gray matter and the volume of a voxel) in all three groups. With regard to the within group correlations for the schizophrenia and normal control samples, as thickness linearly positively correlated with volume for these two subject groups, this suggests that surface area was, effectively, a constant within both of these groups. Conversely, for the within group correlation for the affective psychosis sample, thickness and volume did not correlate, and as thickness increased, volume remained relatively the same. This suggests that the boundary complexity measure, in fact, offset an increase in thickness in the affective disorder subjects such that even with increasing within group cortical thickness, the volume remained essentially constant. Hence, we believe our results suggest that it is useful to measure both contributing factors to volume, that is, thickness and boundary complexity, or surface area, to best understand the meaning of volumetric change. At least theoretically, cortical volume loss in neuropsychiatric patients might be secondary to thinner cortices, to less complex cortical gyrification (i.e., fewer surface convolutions), or to a combination of both factors.
Counter to our expectations, we did not find a group difference in the product of mean thickness and boundary complexity despite finding a group difference in volume. This indicates that the product of mean thickness and boundary complexity, despite being correlated with volume, is not a surrogate for volume. Theoretically, the volume could be calculated by dividing the total prefrontal cortex into small regions for thickness and surface area assessment, and then calculating the volume as the sum of the product of the thickness of each small region of the prefrontal cortex and the surface area of the small region. Our surrogate measure of surface area, boundary complexity, may be insufficiently accurate to preserve group differences, or the use of mean thickness rather than true local thickness may wash out a group difference due to regional variations in thickness.
An example of an alternative surface-contour-based imaging approach used to assess regional gray matter deficits in schizophrenia can be in found in Cannon et al (2002). This approach, which adjusted for individual variations in cortical gyral and sulcal pattern and corrected for total brain size, permitted highly regional comparisons of cortical gray matter density across subject groups. For example, with regard to the overall prefrontal cortex, they reported more pronounced changes in selective prefrontal cortical subregions including the dorsolateral prefrontal cortex, Broca’s area, premotor cortex, and frontal eye fields in schizophrenic probands in comparison with their monozygotic discordant, that is, healthy, co-twin. This study supports the importance of imaging techniques, which allow for greater parcellation of large regions of interest, such as the prefrontal cortex.
Of further note, we found both a hemisphere effect and a significant hemisphere-by-diagnosis effect for the prefrontal gray mater complexity measure, which suggests that there is a left greater than right asymmetry for this measure in both normal control subjects and affective patients, with the reverse pattern of right greater than left asymmetry in patients with schizophrenia. The failure to find lateralized prefrontal cortical complexity in schizophrenia is consistent with a number of findings in the literature for both volume and cortical folding (i.e., gyrification) findings, which demonstrate an abnormal asymmetry in brain regions in schizophrenia. Such findings have been interpreted as suggesting a neurodevelopmental origin to the asymmetry abnormalities observed in at least a subset of patients diagnosed with schizophrenia (see review in Shenton et al 2001).
With regard to clinical correlations, we found a significant, negative correlation between prefrontal thickness and age of illness onset in only patients with a first-episode of schizophrenia. This finding suggests that patients who were younger at the time of their first-episode of schizophrenia have a thicker pre-frontal cortex, while patients who were slightly older at the time of their first-episode have a thinner prefrontal cortex. We also found a significant negative correlation between prefrontal cortical thickness and age at the time of first medication, also only in patients with a first-episode of schizophrenia. This latter finding suggests that patients who were younger at the time of their first medication had thicker prefrontal cortex, whereas those who were older had thinner prefrontal cortex. Of note here, Kuper-berg et al (in press) reported significantly greater cortical thinning in prefrontal and temporal cortices in chronic medicated schizophrenia patients compared with control subjects. An age-related process may thus underlie the relationship between age of schizophrenia patients and prefrontal cortical thickness. This relationship may reflect an accelerated loss of gray matter in patients with schizophrenia who are slightly older upon initial diagnosis. For example, MRI has shown that gray matter declines over time as part of the normal aging process (e.g., Lim et al 1992; Pfefferbaum et al 1994) and that hemispheric volume decreases at a faster rate in schizophrenia patients compared with normal control subjects (DeLisi et al 1997). Additionally, Thompson et al (2001) have reported a pattern of accelerated gray matter loss in very early onset schizophrenia, with deficits progressing from the parietal brain regions anteriorly to include dorsolateral prefrontal cortex and temporal cortices over 5 years of disease progression. Furthermore, a recent review of the synaptic hypothesis of schizophrenia (Frankle et al 2003) suggests that disorders of dopamine transmission (sensitization) and of glutamate transmission (excitotoxicity) may be relevant to brain changes over time, particularly in the prefrontal cortex, and if this proves to be the case, then pharmacologic treatment might affect these changes or, perhaps, even prevent them.
The finding of age correlating with prefrontal cortical thickness may thus suggest the presence of an active brain process that may continue through the first years of schizophrenia and cause greater than normal adult cortical deterioration. It is also possible that this relationship reflects a longer prodromal period in patients who are older at the time of their first-episode of schizophrenia.
The association between earlier age of receiving medication and thicker prefrontal cortex is also of note and may be related to the efficacy of early neuroleptic treatment intervention. We note, however, that despite our finding of a relationship between age and age at first medication, and prefrontal cortical thickness in schizophrenia, the presence of a progressive component in the disorder cannot be determined from this study because of its cross-sectional design. It will thus be important to conduct a longitudinal study of cortical thickness to determine whether prefrontal cortical thickness decreases with age from the first onset of illness or decreases with increased age at first medication. We speculate that both of these schizophrenia-selective associations with age may imply that the longer the schizophrenic process has been operative, the thinner the prefrontal cortex. A longitudinal study will be needed for confirmation, however.
Our study has the following strengths. First, the use of first-episode schizophrenia and affective psychosis patients, matched in age to normal control subjects, minimized the potential effects of chronic illness, medication, and age on brain structure (for review of effects of chronic medication on brain structure, see Harrison 1999). The effects of chronic medication on brain structure did not seem to have an effect on prefrontal gray matter thickness in this study, because neither duration nor dosage of medication significantly correlated with prefrontal cortical thickness in either of the first-episode patient groups. Moreover, the inclusion of first-episode patients with affective psychosis allowed us to examine the specificity of findings to schizophrenia. Finally, this study represents the first time that cortical thickness has been measured in first-episode schizophrenic patients.
A shortcoming of our study is that we did not parcellate the prefrontal cortex. The complex organization of the cerebral cortex into layers, combined with the presence of structurally and functionally distinct regions within the cortex, with regional variations in thickness, makes the measurement of thickness from MR images challenging (Brodmann 1905; Kandel et al 2000; Rajkowska and Goldman-Rakic 1995a, 1995b; Vogt and Vogt 1919). Regionally specific MRI investigations of cortical thickness may reveal focal abnormalities in cortical thickness in schizophrenia that are not present throughout the prefrontal cortex.
In conclusion, we applied a method of measuring cortical thickness to the prefrontal cortex from brain segmentations derived from MRI. Although we did not find differences between subject groups in prefrontal cortical thickness, we believe that our study demonstrates the potential usefulness of MRI to the study of cortical thickness abnormalities in schizophrenia. Parcellation of the prefrontal cortex and longitudinal studies investigating cortical thinning, particularly with respect to age-related changes (both changes over time and age differences at first medication), could provide additional information that would contribute to a more comprehensive understanding of the underlying nature of this disorder and aid in the development and assessment of the efficacy of a wide variety of treatments for schizophrenia.
Acknowledgments
We acknowledge the support of the Stanley Medical Research Institute (LCW), the Whitaker Foundation (SKW), a Center for Integration of Medicine and Innovative Technology award (SKW), the National Institute of Health (Grant Nos. K02 MH 01110 and R01 MH 50740 to MES; P41 RR13218, P01 CA67165, R01 RR11747, and R01 CA86879 to SKW; and R01 MH 40799 to RWM), the Department of Veterans Affairs Merit Awards (MES and RWM), and the National Center for Research Resources (Grant No. 11747 to RK). The authors thank Marie Fairbanks for her administrative assistance.
References
- Akbarian S, Kim JJ, Potkin SG, Hagman JO, Tafazzoli A, Bunney WE, Jr, et al. Gene expression for glutamic acid decarboxylase is reduced without loss of neurons in prefrontal cortex of schizophrenics. Arch Gen Psychiatry. 1995;52:258–266. doi: 10.1001/archpsyc.1995.03950160008002. [DOI] [PubMed] [Google Scholar]
- Baare WF, Hulshoff Pol HE, Hijman R, Mali WP, Viergever MA, Kahn RS. Volumetric analysis of frontal lobe regions in schizophrenia: Relation to cognitive function and symptomatology. Biol Psychiatry. 1999;45:1597–1605. doi: 10.1016/s0006-3223(98)00266-2. [DOI] [PubMed] [Google Scholar]
- Benes FM, Davidson J, Bird ED. Quantitative cytoarchitectural studies of the cerebral cortex of schizophrenics. Arch Gen Psychiatry. 1986;43:31–35. doi: 10.1001/archpsyc.1986.01800010033004. [DOI] [PubMed] [Google Scholar]
- Benes FM, McSparren J, Bird ED, SanGiovanni JP, Vincent SL. Deficits in small interneurons in prefrontal and cingulate cortices of schizophrenic and schizoaffective patients. Arch Gen Psychiatry. 1991;48:996–1001. doi: 10.1001/archpsyc.1991.01810350036005. [DOI] [PubMed] [Google Scholar]
- Borgefors G. Distance transformations in arbitrary dimensions. Comput Vis Graphics Image Processing. 1984;27:321–345. [Google Scholar]
- Brodmann K. Perceptual Neuroscience: The Cerebral Cortex. Cambridge, MA: Harvard University Press; 1905. [Google Scholar]
- Cannon TD, Thompson PM, van Erp TGM, Toga AW, Poutanen V-P, Huttunen M, et al. Cortex mapping reveals regionally specific patterns of genetic and disease-specific gray-matter deficits in twins discordant for schizophrenia. Proc Natl Acad Sci U S A. 2002;99:3228–3233. doi: 10.1073/pnas.052023499. [DOI] [PMC free article] [PubMed] [Google Scholar]
- DeLisi LE, Sakuma M, Tew W, Kushner M, Hoff AL, Grimson R. Schizophrenia as a chronic active brain process: A study of progressive brain structural change subsequent to the onset of schizophrenia. Psychiatry Res. 1997;74:129–140. doi: 10.1016/s0925-4927(97)00012-7. [DOI] [PubMed] [Google Scholar]
- Dickey CC, Shenton ME, Hirayasu Y, Fischer I, Voglmaier MM, Niznikiewicz MA, et al. Large CSF volume not attributable to ventricular volume in schizotypal personality disorder. Am J Psychiatry. 2000;157:48–54. doi: 10.1176/ajp.157.1.48. [DOI] [PMC free article] [PubMed] [Google Scholar]
- Endicott J, Spitzer RL, Fleiss J, Cohen J. The global assessment scale (GAS): A procedure for measuring overall severity of psychiatric disturbance. Arch Gen Psychiatry. 1976;33:766–771. doi: 10.1001/archpsyc.1976.01770060086012. [DOI] [PubMed] [Google Scholar]
- Fischl B, Dale AM. Measuring the thickness of the human cerebral cortex from magnetic resonance images. Proc Natl Acad Sci U S A. 2000;97:11050–11055. doi: 10.1073/pnas.200033797. [DOI] [PMC free article] [PubMed] [Google Scholar]
- Frankle WG, Lerma J, Laruelle M. The synaptic hypothesis of schizophrenia. Neuron. 2003;39:205–216. doi: 10.1016/s0896-6273(03)00423-9. [DOI] [PubMed] [Google Scholar]
- Gerig G, Kubler O, Kikinis R, Jolesz FA. Nonlinear anisotropic filtering of MRI data. IEEE Trans Med Imaging. 1992;2:221–232. doi: 10.1109/42.141646. [DOI] [PubMed] [Google Scholar]
- Goldman-Rakic PS, Selemon LD. Functional and anatomical aspects of prefrontal pathology in schizophrenia. Schizophr Bull. 1997;23:437–458. doi: 10.1093/schbul/23.3.437. [DOI] [PubMed] [Google Scholar]
- Gur RE, Cowell PE, Latshaw A, Turetsky BI, Grossman RI, Arnold SE, et al. Reduced dorsal and orbital prefrontal gray matter volumes in schizophrenia. Arch Gen Psychiatry. 2000;57:761–768. doi: 10.1001/archpsyc.57.8.761. [DOI] [PubMed] [Google Scholar]
- Gur RE, Cowell P, Turetsky BI, Gallacher F, Cannon T, Bilker WB, et al. A follow-up magnetic resonance imaging study of schizophrenia. Relationship of neuroanatomical changes to clinical and neurobehavioral measures. Arch Gen Psychiatry. 1998;55:145–152. doi: 10.1001/archpsyc.55.2.145. [DOI] [PubMed] [Google Scholar]
- Harrison PJ. The neuropathological effects of antipsychotic drugs. Schizophr Res. 1999;40:87–99. doi: 10.1016/s0920-9964(99)00065-1. [DOI] [PubMed] [Google Scholar]
- Heckers S. Neuropathology of schizophrenia: Cortex, thalamus, basal ganglia, and neurotransmitter-specific projection systems. Schizophr Bull. 1997;23:403–421. doi: 10.1093/schbul/23.3.403. [DOI] [PubMed] [Google Scholar]
- Hirayasu Y, Tanaka S, Shenton ME, Salisbury DF, DeSantis MA, Levitt JJ, et al. Prefrontal gray matter volume reduction in first episode schizophrenia. Cereb Cortex. 2001;11:374–381. doi: 10.1093/cercor/11.4.374. [DOI] [PubMed] [Google Scholar]
- Hollingshead AB. Two-Factor Index of Social Position. New Haven, CT: Yale Station; 1965. [Google Scholar]
- Jaume S, Ferrant M, Macq B, Hoyte L, Fielding JR, Schreyer A, et al. Tumor detection in the bladder wall with a measurement of abnormal thickness. IEEE Trans Biomed Eng. 2002;50:383–390. doi: 10.1109/TBME.2003.808828. [DOI] [PubMed] [Google Scholar]
- Kabani N, Le Goualher G, MacDonald D, Evans AC. Measurement of cortical thickness using an automated 3-D algorithm: A validation study. Neuroimage. 2001;13:375–380. doi: 10.1006/nimg.2000.0652. [DOI] [PubMed] [Google Scholar]
- Kandel ER, Schwartz JH, Jessell TM. Principles of Neural Science. 4. New York, NY: McGraw-Hill; 2000. [Google Scholar]
- Kay SR, Opler LA, Fiszbein A. Positive and Negative Syndrome Scale Manual. North Tonawanda, NY: Multi-Health Systems; 1986. [Google Scholar]
- Kikinis R, Jolesz FA, Gerig G. 3D morphometric and morphometric information derived from clinical brain MR images. In: Hohne KH, Fuchs H, Pizer SM, editors. 3D Imaging in Medicine. Berlin: Springer-Verlag; 1990. pp. 441–454. [Google Scholar]
- Kraepelin E. Dementia Praecox and Paraphrenia. 8. Edinburgh: Livingstone; 1919. [Google Scholar]
- Kuperberg GR, Broome M, McGuire PK, David AS, Eddy M, Ozawa F, et al. Regionally localized thinning of the cerebral cortex in schizophrenia. Arch Gen Psychiatry. 2003;60:878–888. doi: 10.1001/archpsyc.60.9.878. [DOI] [PubMed] [Google Scholar]
- Lewis DA, Gonzalez-Burgos G. Intrinsic excitatory connections in the prefrontal cortex and the pathophysiology of schizophrenia. Brain Res Bull. 2000;52:309–317. doi: 10.1016/s0361-9230(99)00243-9. [DOI] [PubMed] [Google Scholar]
- Lewis DA, Lieberman JA. Catching up on schizophrenia: Natural history and neurobiology. Neuron. 2000;28:325–334. doi: 10.1016/s0896-6273(00)00111-2. [DOI] [PubMed] [Google Scholar]
- Lim KO, Tew W, Kushner M, Chow K, Matsumoto B, DeLisi LE. Cortical gray matter volume deficit in patients with first-episode schizophrenia. Am J Psychiatry. 1996;153:1548–1553. doi: 10.1176/ajp.153.12.1548. [DOI] [PubMed] [Google Scholar]
- Lim KO, Zipursky RB, Watts MC, Pfefferbaum A. Decreased gray matter in normal aging: An in vivo magnetic resonance study. J Gerontol. 1992;47:B26–30. doi: 10.1093/geronj/47.1.b26. [DOI] [PubMed] [Google Scholar]
- Manoach DS. Prefrontal cortex dysfunction during working memory performance in schizophrenia: Reconciling discrepant findings. Schizophr Res. 2003;60:285–298. doi: 10.1016/s0920-9964(02)00294-3. [DOI] [PubMed] [Google Scholar]
- McCarley RW, Wible CG, Frumin M, Hirayasu Y, Levitt JJ, Fischer IA, et al. MRI anatomy of schizophrenia. Biol Psychiatry. 1999;45:1099–1119. doi: 10.1016/s0006-3223(99)00018-9. [DOI] [PMC free article] [PubMed] [Google Scholar]
- Miller EK. The prefrontal cortex: Complex neural properties for complex behavior. Neuron. 1999;22:15–17. doi: 10.1016/s0896-6273(00)80673-x. [DOI] [PubMed] [Google Scholar]
- Nabavi A, Black PM, Gering DT, Westin CF, Mehta V, Pergolizzi RS, Jr, et al. Serial intraoperative magnetic resonance imaging of brain shift. Neurosurgery. 2001;48:787–797. doi: 10.1097/00006123-200104000-00019. [DOI] [PubMed] [Google Scholar]
- Nopoulos P, Torres I, Flaum M, Andreasen NC, Ehrhardt JC, Yuh WT. Brain morphology in first-episode schizophrenia. Am J Psychiatry. 1995;152:1721–1723. doi: 10.1176/ajp.152.12.1721. [DOI] [PubMed] [Google Scholar]
- Oldfield RC. The assessment and analysis of handedness. Neuropsychologia. 1971;9:97–113. doi: 10.1016/0028-3932(71)90067-4. [DOI] [PubMed] [Google Scholar]
- Overall JE, Gorham DR. The brief psychiatric rating scale. Psychol Rep. 1962;10:799–812. [Google Scholar]
- Park S, Holzman PS. Schizophrenics show spatial working memory deficits. Arch Gen Psychiatry. 1992;49:975–982. doi: 10.1001/archpsyc.1992.01820120063009. [DOI] [PubMed] [Google Scholar]
- Pfefferbaum A, Mathalon DH, Sullivan EV, Rawles JM, Zipursky RB, Lim KO. A quantitative magnetic resonance imaging study of changes in brain morphology from infancy to late adulthood. Arch Neurol. 1994;51:874–887. doi: 10.1001/archneur.1994.00540210046012. [DOI] [PubMed] [Google Scholar]
- Rajkowska G, Goldman-Rakic PS. Cytoarchitectonic definition of prefrontal areas in the normal human cortex: I. Remapping of areas 9 and 46 using quantitative criteria. Cereb Cortex. 1995a;5:307–22. doi: 10.1093/cercor/5.4.307. [DOI] [PubMed] [Google Scholar]
- Rajkowska G, Goldman-Rakic PS. Cytoarchitectonic definition of prefrontal areas in the normal human cortex: II. Variability in locations of areas 9 and 46 and relationship to the Talairach coordinate system. Cereb Cortex. 1995b;5:323–37. doi: 10.1093/cercor/5.4.323. [DOI] [PubMed] [Google Scholar]
- Rajkowska G, Selemon LD, Goldman-Rakic PS. Neuronal and glial somal size in the prefrontal cortex: A postmortem morphometric study of schizophrenia and Huntington disease. Arch Gen Psychiatry. 1998;55:215–24. doi: 10.1001/archpsyc.55.3.215. [DOI] [PubMed] [Google Scholar]
- Roberts GW, Colter N, Lofthouse R, Bogerts B, Zech M, Crow TJ. Gliosis in schizophrenia: A survey. Biol Psychiatry. 1986;21:1043–1050. doi: 10.1016/0006-3223(86)90285-4. [DOI] [PubMed] [Google Scholar]
- Schlaepfer TE, Harris GJ, Tien AY, Peng LW, Lee S, Federman EB, et al. Decreased regional cortical gray matter volume in schizophrenia. Am J Psychiatry. 1994;151:842–848. doi: 10.1176/ajp.151.6.842. [DOI] [PubMed] [Google Scholar]
- Schreyer AG, Fielding JR, Warfield SK, Lee JH, Loughlin KR, Dumanli H, et al. Virtual CT cystoscopy: Color mapping of bladder wall thickness. Invest Radiol. 2000;35:331–334. doi: 10.1097/00004424-200005000-00008. [DOI] [PubMed] [Google Scholar]
- Schroeder W, Martin K, Lorensen W. The visualization toolkit: An object oriented approach to 3D graphics. Upper Saddle River, NJ: Prentice Hall; 1996. [Google Scholar]
- Selemon LD, Lidow MS, Goldman-Rakic PS. Increased volume and glial density in primate prefrontal cortex associated with chronic anti-psychotic drug exposure. Biol Psychiatry. 1999;46:161–72. doi: 10.1016/s0006-3223(99)00113-4. [DOI] [PubMed] [Google Scholar]
- Selemon LD, Rajkowska G, Goldman-Rakic PS. Abnormally high neuronal density in the schizophrenic cortex. A morphometric analysis of prefrontal area 9 and occipital area 17. Arch Gen Psychiatry. 1995;52:805–818. doi: 10.1001/archpsyc.1995.03950220015005. discussion: 819–820. [DOI] [PubMed] [Google Scholar]
- Selemon LD, Rajkowska G, Goldman-Rakic PS. Elevated neuronal density in prefrontal area 46 in brains from schizophrenic patients: Application of a three-dimensional, stereologic counting method. J Comp Neurol. 1998;392:402–412. [PubMed] [Google Scholar]
- Shenton ME, Dickey CC, Frumin M, McCarley RW. A review of MRI findings in schizophrenia. Schizophr Res. 2001;49:1–49. doi: 10.1016/s0920-9964(01)00163-3. [DOI] [PMC free article] [PubMed] [Google Scholar]
- Spitzer RL, Williams JB, Gibbon M, First M. The Structured Clinical Interview for DSM-III-R (SCID) Washington, DC: American Psychiatric Press; 1990a. [Google Scholar]
- Spitzer RL, Williams JB, Gibbon M, First M. The Structured Clinical Interview for DSM-III-R (SCID-II)—Personality Disorders. Washington, DC: American Psychiatric Association; 1990b. [Google Scholar]
- Spitzer RL, Williams JB, Gibbon M, First M. The Structured Clinical Interview for DSM-III-R (SCID-NP)—Non-Patient Edition. Washington, DC: American Psychiatric Association; 1990c. [Google Scholar]
- Stirling JD, Hellewell JS, Hewitt J. Verbal memory impairment in schizophrenia: No sparing of short-term recall. Schizophr Res. 1997;25:85–95. doi: 10.1016/S0920-9964(97)00012-1. [DOI] [PubMed] [Google Scholar]
- Sullivan EV, Lim KO, Mathalon D, Marsh L, Beal DM, Harris D, et al. A profile of cortical gray matter volume deficits characteristic of schizophrenia. Cereb Cortex. 1998;8:117–124. doi: 10.1093/cercor/8.2.117. [DOI] [PubMed] [Google Scholar]
- Thompson PM, Vidal C, Giedd JN, Gochman P, Blumenthal J, Nicolson R, et al. Mapping adolescent brain change reveals dynamic wave of accelerated gray matter loss in very early-onset schizophrenia. Proc Natl Acad Sci U S A. 2001;98:11650–11655. doi: 10.1073/pnas.201243998. [DOI] [PMC free article] [PubMed] [Google Scholar]
- Thune JJ, Uylings HB, Pakkenberg B. No deficit in total number of neurons in the prefrontal cortex in schizophrenics. J Psychiatr Res. 2001;35:15–21. doi: 10.1016/s0022-3956(00)00043-1. [DOI] [PubMed] [Google Scholar]
- Vogt O, Vogt C. Ergebnisse unserer Hirnforschung [Results of our brain research] J Psychol Neurol Lpz. 1919;25:277–462. [Google Scholar]
- Warfield S. Fast classification for multichannel image data. Pattern Recognition Letters. 1996;17:713–721. [Google Scholar]
- Wechsler D. Wechsler Adult Intelligence Scale—Revised. New York, NY: Harcourt Brace Jovanovich; 1981. [Google Scholar]
- Weinberger DR. Implications of normal brain development for the pathogenesis of schizophrenia. Arch Gen Psychiatry. 1987;44:660–669. doi: 10.1001/archpsyc.1987.01800190080012. [DOI] [PubMed] [Google Scholar]
- Weinberger DR, Berman KF, Zec RF. Physiologic dysfunction of prefrontal cortex in schizophrenia: I. Regional cerebral bloodflow evidence. Arch Gen Psychiatry. 1986;43:114–125. doi: 10.1001/archpsyc.1986.01800020020004. [DOI] [PubMed] [Google Scholar]
- Wells W, Kikinis R, Grimson W, Jolesz FA. Adaptive segmentation of MRI data. IEEE Trans Med Imaging. 1996;15:429–442. doi: 10.1109/42.511747. [DOI] [PubMed] [Google Scholar]
- Wible CG, Shenton ME, Hokama H, Kikinis R, Jolesz FA, Metcalf D, et al. Prefrontal cortex and schizophrenia. A quantitative magnetic resonance imaging study. Arch Gen Psychiatry. 1995;52:279–288. doi: 10.1001/archpsyc.1995.03950160029007. [DOI] [PubMed] [Google Scholar]
- Zeng X, Staib LH, Schultz RT, Duncan JS. Segmentation and measurement of the cortex from 3-D images using coupled-surfaces propagation. IEEE Trans Med Imaging. 1999;18:927–937. doi: 10.1109/42.811276. [DOI] [PubMed] [Google Scholar]