Abstract
The in vivo flow cytometer is an instrument capable of continuous, real-time monitoring of fluorescently labeled cells in the circulation without the need to draw blood samples. However, the original system probes a single vessel in the mouse ear; the small sample volume limits the sensitivity of the technique. We describe an in vivo retinal flow cytometer that simultaneously probes five artery–vein pairs in the mouse eye by circularly scanning a small laser spot rapidly around the optic nerve head. We demonstrate that the retinal flow cytometer detects about five times more cells per minute than the original in vivo flow cytometer does in the ear.
The in vivo flow cytometer (IVFC) has become a valuable tool for investigating the kinetics of circulating cells in the vasculature without the need to withdraw blood samples. IVFC enables the detection and quantification of circulating cells in arterial circulation where the blood velocity is too high for reliable quantification of cells by video rate imaging. As described by Novak et al. [1], the slit focus of an excitation laser is aligned perpendicularly to a blood vessel in a mouse ear. Fluorescence of cells passing through the slit focus is confocally detected through a rectangular aperture. This technique has been employed to measure the time that tumor cells and apoptotic cells remain in circulation in mice and has helped to study white blood cell and stem cell trafficking [2-6]. However, the blood volume sampled with the IVFC at any one time is smaller than 1 μl/min (blood vessel of ≈35 μm diameter with an average flow velocity of 3–5 mm/s), limiting the cell detection sensitivity to about 103 cells in circulation [2].
We have set up a retinal flow cytometer to improve cell detection sensitivity by increasing sampling volume. Radiation from the excitation laser is delivered through the clear media of the mouse eye, and its focus is scanned in a circle around the optic nerve head (ONH). Thus, five artery–vein pairs that diverge into the retinal space from the ONH are probed simultaneously.
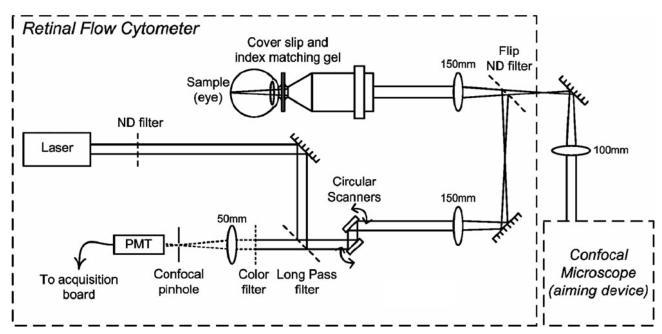
The retinal flow cytometer is essentially a confocal line-scanning microscope. It was assembled as a front end for a confocal microscope that serves as an aiming device to verify the plane and region probed by the retinal flow cytometer. In the retinal flow cytometer, two phase-locked resonant galvanometer scanners (Thorlabs) circularly steer the beam of the excitation laser (635 nm, Radius, Coherent) at a rate of 4.8 kHz. The pupil formed by the scanner is projected telecentrically into the shared pupil at the entrance aperture of a 20× infinity-corrected microscope objective (NA 0.42, M Plan APO). The excitation beam of the retinal flow cytometer is not expanded, thus underfilling the objective's aperture, yielding a measured spot diameter (1/e2) of 13 μm in air and a depth of focus of 320 μm (i.e., twice the Raleigh range). Excited fluorescence is descanned by the resonant scanning mirrors and detected through a dichroic long-pass filter at 45° and through a 670 nm bandpass filter. Out-of-focus signal is rejected by a 400 μm pinhole in front of the photomultiplier tube (PMT) (R3896, Hamamatsu) (Fig. 1).
Fig. 1.
Schematic of the retinal flow cytometer setup. Two resonant scanners create the circular scan on the retina. Fluorescence is detected through a long-pass and a bandpass filter. A confocal pinhole in front of the PMT rejects the out-of-focus signal.
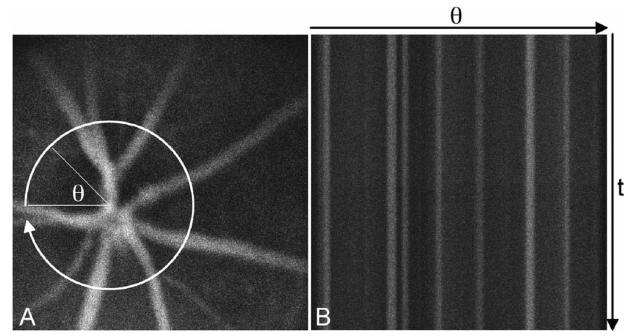
The PMT signal is fed into a variable scan analog frame grabber (Snapper 24, Active Silicon). Each circular scan is displayed as a straight horizontal line of 500 pixels in length; consecutive scans are oriented as adjacent lines. Consequently, the line frequency along the negative y axis of the resulting 500×500 pixel image equals the sampling rate in each blood vessel. Furthermore, retinal blood vessels that diverge outward from the ONH appear as straight vertical structures, as the x axis maps the angular position of the flying spot (Fig. 2). We recorded streaming raw data with imaging software developed in house in Mac OS X for postprocessing.
Fig. 2.
Confocal fluorescence image of mouse retinal vessels visualized with the fluorescent dye Evans Blue, A, with a cartoon of the circular retinal flow cytometer scan. Evans Blue has similar excitation and emission characteristics as DiD. Consecutive circular scans are mapped to straight horizontal lines in the retinal flow cytometer file, B. Thus retinal vessels appear as vertical, fluorescent structures.
For initial feasibility experiments about 106 DiD-labeled lymphocytes (freshly isolated from extracted lymph nodes) were injected into an anesthetized BALB/c mouse. DiD (Vybrant DiD, Molecular Probes/ Invitrogen) is a lipophilic dye used as a membrane marker with an emission maximum at 670 nm after excitation with a 635 nm laser. Injected cells were counted with the retinal flow cytometer both by placing the circular scan around the ONH as well as over a single retinal blood vessel. For comparison, cell count was also enumerated in the ear of the same mouse with the IVFC using slit excitation. To determine the cell count, several data sets were recorded in each location. The cell count is presented as the mean and standard deviation among the data sets from the same experiments (Table 1).
Table 1.
Comparison of Cell Counts Acquired with the Retinal Flow Cytometer, Scanning around the ONH and across a Single Retinal Vessel,a with the IVFC Count in the Circulation of the Ear
| Retinal Flow Cytometer in Retinal Vessels | IVFC | ||||||
|---|---|---|---|---|---|---|---|
| Manual Count |
ROI and Perl Code |
ImageJ Particle Analysis |
MatLab |
||||
| ONH | Single | ONH | Single | ONH | Single | Single | |
| Cells/min | 269 | 31 | 238 | 25 | 224 | 26 | 53 |
| St-Dev | 39 | 3 | 69 | 4 | 61 | 3 | 11 |
The count from a single retinal vessel is the average of the two intersections of the circular scan with the vessel.
Cell counts from the retinal flow cytometer were determined by multiple independent observers manually inspecting each frame of the recorded files. To explore automated counting techniques, we also enumerated cells using two different software algorithms and compared the results with the manual counts. For software analysis, two basic criteria need to be satisfied for a signal to be counted as a single cell: the fluorescence signal (1) needs to be distinguishable from background signal in amplitude and (2) needs to have a minimum temporal width. Assuming a maximum cell velocity of 10 mm/s, a circular scan of about 5 kHz should intercept a lymphocyte of about 8 μm in size at least four times. Consequently, signals shorter in time than four pixels are not counted as cells, independent of their height. In both software analyses, blood vessel locations were identified by the cells passing through the movie frames in vertical lines. Regions outside major vessels were excluded from the analysis, since no valuable information can be expected.
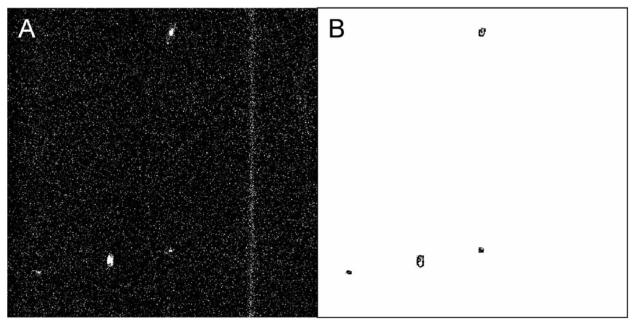
In one software approach we determined the cell count by particle analysis in ImageJ [7]. After noise reduction using ImageJ's mean filter (an isolated bright pixel cannot constitute a cell and is replaced with the mean of its surrounding 3×3 matrix), the original 8-bit data set was converted to a binary movie; the same settings for the threshold were used in the analysis of all experimental data sets. In ImageJ's particle analysis function, the size of contacts to be counted was specified according to our temporal width criterion. Thus, ImageJ particle analysis counted and outlined structures that were identified as cells (Fig. 3).
Fig. 3.
Typical frame of retinal flow cytometer raw file from DiD-labeled lymphocytes, A, and the same frame analyzed by ImageJ, B. The four cells in the raw file mark the position of three blood vessels (oriented vertically; compare Fig. 2). The long streak is a single cell that is moving very slowly in a capillary. This location was rejected from the analysis throughout the data set since it is not a major retinal vessel. The other four cells are correctly counted and outlined.
In a second software counting approach, we extracted a plot of pixel intensity over time for each of the probed vessels using a movie stitching utility that was developed in house in Mac OS X. A region of interest (ROI) was placed in the position of each blood vessel. The ROI is equivalent to the slit in IVFC; the frequency of the circular scan is similar to the sampling rate in IVFC. Within the ROI, a minimum filter was applied for noise reduction; isolated bright pixels cannot constitute a cell and are replaced with zero. By integrating along the horizontal axis within the ROI and dividing by the number of pixels spanned by the ROI, a normalized pixel value was computed. The signal spikes in the resulting time trace were counted using code written in Perl that identifies cells based on the height and width of their fluorescence signal.
Our results demonstrate that counting fluorescently labeled cells in circulation is feasible with the retinal flow cytometer. Probing the blood vessels that diverge from the ONH resulted in a cell count that was five times higher than that derived from the IVFC in the ear of the same mouse (Table 1). Thus, it can be inferred that the retinal flow cytometer probes a sample volume that is five times larger than that of the IVFC, although 10 blood vessels are probed. The diameter of a typical retinal blood vessel in a 30-day-old mouse is about 25 μm [8], while blood vessels of about 35 μm are targeted in IVFC. Consequently, cell counts in a single ear vessel are expected to be about twice as high as counts in a single retinal vessel; we measured an IVFC versus single retinal vessel count ratio of 1.7 (Table 1).
Retinal cell counts evaluated by software were about 15% lower than manual counts, as the height threshold was set to a fairly high level in order to avoid miscounting noise as cells and thus increase specificity. The specificity of the ImageJ results (Specificity=1−incorrectly counted/total manual count) was 95%, determined by comparing the marked cells in the analyzed movie to cells in the raw movie. The high specificity of the software ensured that an individual cell in the raw file was correctly identified as a single cell by software.
For future experiments a new retinal flow cytometer will be designed with higher numerical aperture. Smaller focal diameter and shorter depth of focus will result in improved sensitivity and increased signal-to-noise ratio, by increasing irradiance for excitation and refining depth sectioning. However, the smallest spot size in the retina is limited by the numerical aperture (about 0.2–0.3) as well as by aberrations of the mouse eye that may prevent achieving the diffraction limit.
In summary, we demonstrate that the retinal flow cytometer results in higher cell counts than in the IVFC. Improved cell counting sensitivity should translate to higher statistical confidence in future longitudinal studies. Furthermore, in two-color IVFC, where cell populations labeled with two or more fluorescent dyes are investigated, tissue effects such as scattering and autofluorescence complicate experiments and lead to cell counts that are consistently lower in the shorter wavelengths. Thus, by taking advantage of the transparent media of the eye, the concept of the retinal flow cytometer may be advantageous in the simultaneous detection of multiple cell populations in vivo.
Acknowledgments
The authors thank Alex Cable and Thorlabs for providing the phase-locked scanners and Parisa Zamiri for fruitful discussions. This work was supported by NIH/BRP EY 014106.
Footnotes
OCIS codes: 170.0170, 170.1530, 170.1790.
References
- 1.Novak J, Georgakoudi I, Wei X, Prossin A, Lin CP. Opt. Lett. 2004;29:77. doi: 10.1364/ol.29.000077. [DOI] [PMC free article] [PubMed] [Google Scholar]
- 2.Georgakoudi I, Solban N, Novak J, Rice WL, Wei X, Hasan T, Lin CP. Cancer Res. 2004;64:5044. doi: 10.1158/0008-5472.CAN-04-1058. [DOI] [PubMed] [Google Scholar]
- 3.Sipkins DA, Wei X, Wu JW, Runnels JM, Côté D, Means TK, Luster AD, Scadden DT, Lin CP. Nature. 2005;435:969. doi: 10.1038/nature03703. [DOI] [PMC free article] [PubMed] [Google Scholar]
- 4.Wei X, Sipkins DA, Pitsillides CM, Novak J, Georgakoudi Ir., Lin CP. Mol. Imaging. 2005;4:415. doi: 10.2310/7290.2005.05148. [DOI] [PMC free article] [PubMed] [Google Scholar]
- 5.Chakraverty R, Côté D, Buchli J, Cotter P, Hsu R, Zhao G, Sachs T, Pitsillides CM, Bronson R, Means T, Lin CP, Sykes M. J. Exp. Med. 2006;203:2021. doi: 10.1084/jem.20060376. [DOI] [PMC free article] [PubMed] [Google Scholar]
- 6.Boutrus S, Greiner C, Hwu D, Chan M, Kuperwasser C, Lin CP, Georgakoudi I. J. Biomed. Opt. 2007;12:020507. doi: 10.1117/1.2722733. [DOI] [PMC free article] [PubMed] [Google Scholar]
- 7.Rasband WS. ImageJ. National Institutes of Health; http://rsb.info.nih.gov/ij/ [Google Scholar]
- 8.Al-Shabrawey M, El-Remessy AB, Gu X, Brooks SS, Hamed MS, Huang P, Caldwell RB. Mol. Vis. 2003;9:549. [PubMed] [Google Scholar]


