

Abstract
The pervasive sensing technologies found in smart homes offer unprecedented opportunities for providing health monitoring and assistance to individuals experiencing difficulties living independently at home. A primary challenge that needs to be tackled to meet this need is the ability to recognize and track functional activities that people perform in their own homes and everyday settings. In this paper we look at approaches to perform real-time recognition of Activities of Daily Living. We enhance other related research efforts to develop approaches that are effective when activities are interrupted and interleaved. To evaluate the accuracy of our recognition algorithms we assess them using real data collected from participants performing activities in our on-campus smart apartment testbed.
Keywords: smart environments, passive sensors, activity recognition, interweaved activities
INTRODUCTION
A convergence of technologies in machine learning and pervasive computing has caused interest in the development of smart environments to emerge and assist with valuable functions such as remote health monitoring and intervention. The need for development of such technologies is underscored by the aging of the population, the cost of formal health care, and the importance that individuals place on remaining independent in their own homes. When surveyed about assistive technologies, family caregivers of Alzheimer’s patients ranked activity identification, functional assessment, medication monitoring and tracking at the top of their list of needs [1].
To function independently at home, individuals need to be able to complete both basic (e.g., eating, dressing) and more complex (e.g., food preparation, medication management, telephone use) Activities of Daily Living (ADLs) [2]. We have designed an algorithm that labels the activity that an inhabitant is performing in a smart environment based on the sensor data that is collected by the environment during the activity. In the current study, our goal is to design and test various probabilistic modeling methods that can recognize activities in more complex situations when activities are interrupted and interwoven. To test our approach, we collect sensor data in our smart apartment testbed while participants perform activities sequentially and interwoven together. We use this collected data to assess the recognition accuracy of our algorithms.
There is a growing interest in designing smart environments that reason about residents [3,4], provide health assistance [5], and perform activity recognition [6,7,8]. However, several challenges need to be addressed before smart environment technologies can be deployed for health monitoring. These include the design of activity recognition algorithms that generalize over multiple individuals and that operate robustly in real-world situations where activities are interrupted. This technology, if accurate, can be used to track activities that people perform in their everyday settings and to remotely and automatically assess their functional well-being.
METHODS
Data Collection
To validate our algorithms, we test them in a smart apartment testbed located on the WSU campus. The testbed is equipped with motion and temperature sensors as well as analog sensors that monitor water and stove burner use (see Figure 1). VOIP captures phone usage and we use contact switch sensors to monitor usage of the phone book, a cooking pot, and the medicine container. Sensor data is captured using a customized sensor network and stored in a SQL database.
Fig. 1.

Resident performing “hand washing” activity (left). This activity triggers motion sensor ON/OFF events as well as water flow sensor values (right). Sensors in the apartment (bottom) monitor motion (M), temperature (T), water (W), door (D), burner (AD), and item use (I).
To provide physical training data for our algorithms, we recruited 20 volunteer participants to perform a series of activities in the smart apartment, one at a time. For this study, we selected 8 ADLs that are found in clinical questionnaires [9]. Noted difficulties in these areas can help identify individuals who may be having trouble functioning independently at home [10]. These activities are as follows:
Fill medication dispenser: Here the participant removes the items from kitchen cupboard and fills the medication dispenser using the space on the kitchen counter.
Watch DVD: The participant selects the DVD labeled “Good Morning America” located on the shelf below the TV and watches it on the TV. After watching it, the participant turns off the TV and returns the DVD to the shelf.
Water plants: For this activity, the participant takes the watering can from the supply closet and lightly waters the 3 apartment plants, 2 of which are located on the kitchen windowsill and the third is located on the living room table. After finishing, he/she empties any extra water from the watering can into the sink and returns the watering can to the supply closet.
Converse on Phone: Here the participant answers the phone when it rings and hangs up after finishing the conversation. The conversation includes several questions about the DVD show that the participant watched as part of activity 2.
Write Birthday Card: The participant writes a birthday wish inside the birthday card and a fills out a check in a suitable amount for a birthday gift, using the supplies located on the dining room table. He/she then places the card and the check in an envelope and appropriately addresses the envelope.
Prepare meal: The participant uses the supplies located in the kitchen cupboard to prepare a cup of noodle soup according to the directions on the cup of noodle soup. He/she also fills a glass with water using the pitcher of water located on the top shelf of the refrigerator.
Sweep and dust: For this task, the participant sweeps the kitchen floor and dusts the dining and the living room using the supplies located in the kitchen closet.
Select an outfit: Lastly, the participant selects an outfit from the clothes closet to be worn by a male friend going on an important job interview. He/she then lays out the selected clothes on the living room couch.
We first asked the participants to perform each activity separately in the same sequential order. Once they completed all eight activities, the participants were then instructed to perform all of the activities by interweaving them in any fashion they liked with a goal of being efficient in performing the tasks.
As part of the initial activity collection, we obtained sensor events for each activity that could be used to generate a model of each individual task. During the second phase in which participants interwove the tasks, the order in which activities were performed and were interwoven was left to the discretion of the participant. Because different participants interwove the tasks differently, the resulting data set was much richer and more complex than the first.
The data collected during these tasks was manually annotated with the corresponding activity for model training purposes. Specifically, each sensor event was labeled with the corresponding activity id. The average times taken by the participants to complete each activity were 3.5 minutes, 7 minutes, 1.5 minutes, 2 minutes, 4 minutes, 5.5 minutes, 4 minutes and 1.5 minutes, respectively. The average number of sensor events collected for each activity was 31, 59, 71, 31, 56, 96, 118, and 34, respectively.
Probabilistic Models
While collecting sequences of sensor readings in a smart environment is valuable, determining what activities these sequences represent is a more challenging task. Researchers [11,12] frequently exploit probabilistic models to recognize activities and detect anomalies in support of individuals living at home with special needs.
Most of the activity recognition research that has been conducted to date focuses on recognizing activities in artificial scenarios and when activities are performed sequentially. In contrast, we are focusing on recognizing activities in realistic situations when activities are interrupted and interleaved together.
In our study, we make use of three probabilistic models to represent and recognize activities based on observed sensor sequences: a naïve Bayes classifier, a Markov chain model, and a hidden Markov model. We later describe enhancements that are employed to improve the recognition accuracy and test the algorithms on the data collected in the smart apartment testbed.
Naïve Bayes Classifier
A naïve Bayes classifier uses the relative frequencies of feature values and the activity labels for the sample training data to learn a mapping from a data point description to a classification label. For our application, activities are represented by features including the number of times during the activity that the water or burner was on/off, whether or not the phone was used, the number of times doors or cabinets were open/shut, whether items of interest were used, and the number of times the resident was at each location.
The activity label, A, is calculated as . In this calculation D represents the feature values. The denominator will be the same for all values of a so we calculate only the numerator values, for which P(a) is estimated by the proportion of cases for which the activity label is a (in our case each participant performed all five activities so there is a uniform probability over all activity values) and P(D|a) is calculated as the probability of the feature value combination for the particular observed activity, or πiP(di | a).
Markov Model
A Markov Model (MM) is a statistical model of a dynamic system. A MM models the system using a finite set of states, each of which is associated with a multidimensional probability distribution over a set of parameters. The parameters for the model are the feature values described above. The system is assumed to be a Markov process, so the current state depends on a finite history of previous states (in our case, the current state depends only on the previous state). Transitions between states are governed by transition probabilities.
For any given state a set of observations can be generated according to the associated probability distribution. Because our goal is to identify the activity that corresponds to a sequence of observed sensor events, we generate one Markov model for each activity that we are learning. We use the training data to learn the transition probabilities between states for the corresponding activity model and to learn probability distributions for the feature values of each state in the model.
To label a sequence of sensor event observations with the corresponding activity, we compute the activity label A as . P(a) is estimated as before, while P(e1..t | a) is the result of computing the sum, over all states, S, in model a, of the likelihood of being in each state after processing the sequence of sensor events e1..t. The likelihood of being in state s ∈ S is updated after each sensor event ej is processed using the formula found in Equation 1. The probability is updated based on the probability of transitioning from any previous state to the current state (the first term of the summation) and the probability of being in the previous state given the sensor event sequence that led up to event ej.
In constructing the model for an activity, we treat each sensor as a separate state with a corresponding probability distribution over possible sensor values. An example Markov model for this application is shown in Figure 2. Using this model, the sensor event sequence [Motion 14, Motion 15, Motion 16, Motion 17, Water On, Water Off] would be supported with a probability that is calculated as follows.
Fig. 2.

Markov model representing the “washing hands” activity.
First, we obtain the prior probability of all states for each activity. In this case, we calculate the prior probability of a state as the ratio of the number of sensor events representing the state in an activity to the total number of sensor events recorded for that activity.
Next, we calculate the probability of transitioning from a previous state to possible alternatives for the current state. Transition probabilities are calculated as the ratio of the number of transitions that are observed in the training data set from one state to the next to the total number of sensor events that are observed for the state.
In the next step, we calculate the likelihood of being in each possible state for each possible activity. This is calculated as the product of the prior probability of the initial state and the transition probability of moving from the initial state to the final state. This value is then multiplied by the probability of observing the current sensor value for the given activity.
Finally, the probability that a model supports the given sensor sequence is calculated for each model (activity) as the sum of the likelihood values calculated for each state in that activity. As an example, the probability that the “washing hands” model in Figure 2 supports the sequence [Motion 14, Motion 15, Motion 16, Motion 17, Water On, Water Off] is 0.1. Because this probability is greater than the probability values generated by the models for cooking, making a phone call, or cleaning up, the washing hands activity is the label that is output for this input sensor event sequence.
One enhancement we make to a basic Markov model is to incorporate the relative timing of each sensor event. In order to make use of the timing information we add a distribution over the relative times between events to the state feature distributions for each state in the model.
Hidden Markov Model
In earlier work [13] we showed that Markov chains were effective at recognizing activities performed in isolation. They could also be used to assess how completely activities were performed. For interleaved data, however, a Markov chain would not always be appropriate because we will not be able to separate the sensor event sequence into non-overlapping subsequences that correspond to each individual activity. In fact, some sensor events correspond to more than one activity in cases where the participant performed more than one activity in parallel.
A hidden Markov model (HMM) is a statistical model in which the underlying model is a stochastic process that is not observable (i.e. hidden) and is assumed to be a Markov process which can be observed through another set of stochastic processes that produce the sequence of observed symbols. A HMM assigns probability values over a potentially infinite number of sequences. But as the probabilities values must sum to one, the distribution described by the HMM is constrained. This means that the increase in probability values of one sequence is directly related to the decrease in probability values for another sequence.
In the case of a Markov chain, all states are observable states and are directly visible to the observer. Thus, the only other parameter in addition to the prior probabilities of the states and the distribution of feature values for each state is the state transition probabilities. In the case of a hidden Markov model, there are hidden states which are not directly visible, and the observable states (or the variables) influence the hidden states. Each state is associated with a probability distribution over the possible output tokens. Transitions from any one state to another are governed by transition probabilities as in the Markov chain. Thus, in a particular state an outcome can be generated according to the associated probability distribution.
HMMs are known to perform very well in cases where temporal patterns need to be recognized which aligns with our requirement in recognizing interleaved activities. The conditional probability distribution of any hidden state depends only on the value of the preceding hidden state. The value of an observable state depends only on the value of the current hidden state.
Given a set of training data our algorithm uses the sensor values as parameters of the hidden Markov model. Given an input sequence of sensor event observations, our goal is to find the most likely sequence of hidden states, or activities, which could have generated the observed event sequence. We use the Viterbi algorithm [14] to identify this sequence of hidden states.
In our implementation of a hidden Markov model, we treat every activity as a hidden state. As a result, our HMM includes 8 hidden states, each of which denotes one of the 8 modeled activities. Next, every sensor is treated as an observable state in the model due to the fact that every sensor which is used is observable in our dataset.
The challenge here is to identify the sequence of activities (i.e., the sequence of visited hidden states) that corresponds to a sequence of sensor events (i.e., the observable states). For this, we calculate based on the collected data the prior probability (i.e., the start probability) of every state which represents the belief about which state the HMM is in when the first sensor event is seen. For a state (activity) a, this is calculated as the ratio of instances for which the activity label is a. We also calculate the transition probability which represents the change of the state in the underlying Markov model. For any two states a and b, the probability of transitioning from state a to state b is calculated as the ratio of instances having activity label a followed activity label b, to the total number of instances. The transition probability signifies the likelihood of transitioning from a given state to any other state in the model and captures the temporal relationship between the states.
Lastly, the emission probability represents the likelihood of observing a particular sensor event for a given activity. This is calculated by finding the frequency of every sensor event as observed for each activity.
Using the Markov chain, a separate model was generated for each alternative activity. In contrast, we only generate one HMM to represent all activities. Whereas the Markov chain would match the sensor event sequence with each model and return the label of the model that best supports the sequence, the HMM process the event sequence as a continuous stream of data and the activity (hidden node) with the highest probability is returned as the activity label corresponding to the most recent sensor event. Figure 3 shows a portion of an HMM for interleaved activities.
Fig. 3.

A section of an HMM for interleaved activity data. The circles represent hidden states (i.e., activities) and the rectangles represent observable states. Values on horizontal edges represent transition probabilities and values on vertical edges represent the emission probability of the corresponding observed state.
RESULTS
We used data collected in our smart apartment testbed to train the naïve Bayes classifier and HMM. The naïve Bayes classifier achieved an average recognition accuracy of 66.08%. The accuracy values for each activity are graphed in Figure 4. As the figure shows, activities “water plants” and “converse on phone” yield the poorest performance. The water plants activity is associated with almost random movements around the apartment, while no sensor is consistently triggered while the participant talks on the telephone: some participants sit in one spot while others walk around the apartment as they talk. As a result, there is no distinct and consistent set of sensors values associated with these two activities.
Fig. 4.
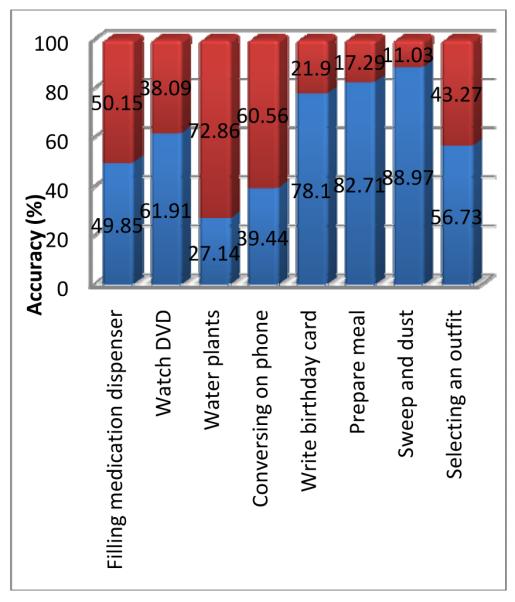
Performance of naive Bayes classifier broken down by activity. Each bar shows the percentage of incorrectly-classified instances (bottom) and correctly-classified instances (top).
Because a hidden Markov model encodes sequencing information between states, we expect that it will outperform the naïve Bayes classifier. In fact, on this dataset the HMM achieves an average recognition accuracy of 71.01%, which represents a significant improvement of 5% accuracy over the naïve Bayes model at p<0.04. Figure 5 graphs the accuracy values for each activity.
Fig. 5.

Performance of HMM broken down by activity.
A limitation of the HMM is that because it processes sensor events in a stream, activities may in reality transition much faster than the probabilities transition from one activity to another. When the participant starts a new activity, several sensor events must occur before the probability indicates that the new activity has started as opposed to continuing the old one. Because we are labeling each sensor event with an activity label based on the sensor event sequence that preceded the current reading, this slow transition affects the performance of this HMM.
To address this issue, we introduce an enhancement to the HMM which employs a sliding window. A window of fixed size moves over the sensor data stream. Only sensor events within the window are input to the HMM to determine the current activity. The size of the window can be based on time or on number of sensor events.
Another challenge that arises in using a sliding window is determining the appropriate window size. The optimal window size may change for different activity recognition applications. For this reason we want to automate window size selection based on features of the current dataset. In order to automate window size selection, our algorithm automatically experiments with different window sizes on the training data. The window size that achieves the best results, using 3-fold cross validation on the training data, is used for the remainder of the activity recognition process.
The graph in Figure 6 shows the accuracy of the HMM for various count-based window sizes. Note that the performance increases as the window size increases and peaks at a window size of 57 sensor events. Performance starts falling again when the window size is too large, likely larger than the number of events that typically occur for each activity.
Fig. 6.
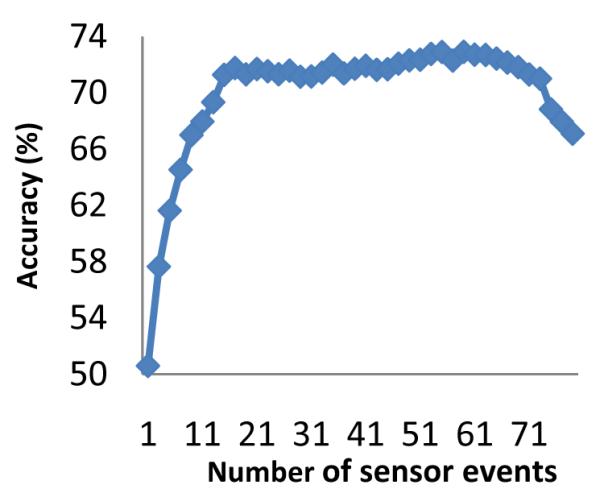
Accuracy of model for alternative count-based window sizes.
In addition to applying a sliding window, we also change our activity labeling approach. Instead of labeling each sensor event with the most probable activity label, we now determine the activity label for the entire window. We can then label the last sensor event in the window with the activity label that appears most often in the window (a frequency approach) and more the window down the stream by one event to label the next event. Alternatively, we can label all sensor events in the window with the activity label that most strongly supports the sequence and then shift the window to cover a non-overlapping set of new sensor events in the stream (a shifting window approach). Figure 7 compares the performance of all of the discussed techniques.
Fig. 7.

Performance comparison of all approaches in recognized interleaved activities.
DISCUSSION
The goal of this project was to design an algorithmic approach to recognize activities performed in a real-time, complex, smart environment. Our experimental results indicate that it is possible to distinguish between activities that are performed in a smart home and to label a sensor event stream with high accuracy. When a probabilistic model is used, the approach can be used to recognize activities even when they are interwoven.
We note that overall the hidden Markov models outperformed the naïve Bayes classifier on the activity recognition task. This is due primarily to the fact that the Markov models represent and include sequencing information when they compute the likelihood of the activity sequence that corresponds to the observed sensor sequence.
Among the hidden Markov model variations, the models that moved a window over the event stream outperformed those that did not. There was no clear winner between time-based windows and count-based windows. The best approach in determining the size and measure for the sliding window is to experiment with different values on training data and automatically select the one with the best performance for use on the remainder of the dataset.
The approach that performed best was the hidden Markov model that used a time-based shifting window to label all activities inside the window with the same activity name. Figure 8 shows the accuracy of both shifting window approaches broken down by activity.
Fig. 8.

Performance comparison of the time-based and count-based shifting window approaches for the HMM, broken down by activity.
In all of the experiments, the accuracy level varied widely by activity. For the time-based shifting window HMM, the poorest accuracy was realized for the “water plants” activity (28.45%), while the maximum accuracy was realized for the “sweep and dust” activity (88.14%). This highlights the fact that smart environment algorithms need to not only performed automated activity recognition and tracking, but they need to base subsequent responses on the recognition accuracy that is expected for a particular activity. If the home intends to report to the caregiver changes in the performance activity, such changes should only be reported for activities where recognizing and assessing the completeness of the activity can be accomplished with consistent success.
While our study revealed that Markov models are effective tools for recognizing activities, there are even more complex monitoring situations that we need to consider before the technology can be deployed. In particular, we need to design algorithms that perform accurate activity recognition and tracking for environments that house multiple residents. In addition, we need to design method for detecting errors in activity performance and for determining the criticality of detected errors.
In our data collection, an experimenter informed the participants of each activity to perform. In more realistic settings, such labeled training data will not be readily available and we need to research effective mechanisms for training our models without relying upon excessive input from the user. We hypothesize that ADL recognition and assessment can be performed in such situations and our future studies will evaluate the ADL recognition and assessment algorithms in actual homes of volunteer participants.
CONCLUSIONS
In this work we described an approach to recognizing activities performed by smart home residents. In particular, we designed and assessed several algorithm that built probabilistic models of activities and used them to recognize activities in complex situations where residents switched frequently between the activities.
Ultimately, we want to use our algorithm design as a component of a complete system that performs functional assessment of adults in their everyday environments. This type of automated assessment also provides a mechanism for evaluating the effectiveness of alternative health interventions. We believe these activity profiling technologies are valuable for providing automated health monitoring and assistance in an individual’s everyday environments.
REFERENCES
- [1].Rialle V, Ollivet C, Guigui C, Herve C. What do family caregivers of Alzheimer’s disease patients desire in smart home technologies? Methods of Information in Medicine. 2008;47:63–69. [PubMed] [Google Scholar]
- [2].Wadley V, Okonkwo O, Crowe M, Ross-Meadows LA. Mild Cognitive Impairment and everyday function: Evidence of reduced speed in performing instrumental activities of daily living. American Journal of Geriatric Psychiatry. 2007;16(5):416–424. doi: 10.1097/JGP.0b013e31816b7303. [DOI] [PubMed] [Google Scholar]
- [3].Cook DJ, Das SK, editors. Smart Environments: Technology, Protocols, and Applications. Wiley; 2004. [Google Scholar]
- [4].Doctor F, Hagras H, Callaghan V. A fuzzy embedded agent-based approach for realizing ambient intelligence in intelligent inhabited environments. IEEE Transactions on Systems, Man, and Cybernetics, Part A. 2005;35(1):55–56. [Google Scholar]
- [5].Mihailidis A, Barbenl J, Fernie G. The efficacy of an intelligent cognitive orthosis to facilitate handwashing by persons with moderate-to-severe dementia. Neuropsychological Rehabilitation. 2004;14(12):135–171. [Google Scholar]
- [6].Philipose M, Fishkin K, Perkowitz M, Patterson D, Fox D, Kautz H, Hahnel D. Inferring activities from interactions with objects. IEEE Pervasive Computing. 2004;3(4):50–57. [Google Scholar]
- [7].Sanchez D, Tentori M, Favela J. Activity recognition for the smart hospital. IEEE Intelligent Systems. 2008;23(2):50–57. [Google Scholar]
- [8].Wren C, Munguia-Tapia E. Toward scalable activity recognition for sensor networks. Proceedings of the Workshop on Location and Context-Awareness.2006. [Google Scholar]
- [9].Reisberg B, Finkel S, Overall J, Schmidt-Gollas N, Kanowski S, Lehfeld H, et al. The Alzheimer’s disease activities of daily living international scale (ASL-IS) International Psychogeriatrics. 2001;13:163–181. doi: 10.1017/s1041610201007566. [DOI] [PubMed] [Google Scholar]
- [10].Schmitter-Edgecombe M, Woo E, Greeley D. Memory deficits, everyday functioning, and mild cognitive impairment. Proceedings of the Annual Rehabilitation Psychology Conference.2008. [Google Scholar]
- [11].Maurer U, Smailagic A, Siewiorek D, Deisher M. Activity recognition and monitoring using multiple sensors on different body positions. Proceedings of the International Workshop on Wearable and Implantable Body Sensor Networks.2006. [Google Scholar]
- [12].Liao L, Fox D, Kautz H. Location-based activity recognition using relational Markov networks. Proceedings of the International Joint Conference on Artificial Intelligence.2005. pp. 773–778. [Google Scholar]
- [13].Viterbi A. Error bounds for convolutional codes and an asymptotically-optimum decoding algorithm. IEEE Transactions on Information Theory. 1967;13(2):260–269. [Google Scholar]
- [14].Cook DJ, Schmitter-Edgecombe M. Assessing the quality of activities in a smart environment. Methods of Information in Medicine. doi: 10.3414/ME0592. (in press) [DOI] [PMC free article] [PubMed] [Google Scholar]