Abstract
Co-overexpression of the epidermal growth factor (EGF) receptor (EGFR) and c-Src frequently occurs in human tumors and is linked to enhanced tumor growth. In experimental systems this synergistic growth requires EGF-dependent association of c-Src with the EGFR and phosphorylation of Tyr-845 of the receptor by c-Src. A search for signaling mediators of Tyr(P)-845 revealed that mitochondrial cytochrome c oxidase subunit II (CoxII) binds EGFR in a Tyr(P)-845- and EGF-dependent manner. In cells this association involves translocation of EGFR to the mitochondria, but regulation of this process is ill-defined. The current study demonstrates that c-Src translocates to the mitochondria with similar kinetics as EGFR and that the catalytic activity of EGFR and c-Src as well as endocytosis and a mitochondrial localization signal are required for these events. CoxII can be phosphorylated by EGFR and c-Src, and EGF stimulation reduces Cox activity and cellular ATP, an event that is dependent in large part on EGFR localized to the mitochondria. These findings suggest EGFR plays a novel role in modulating mitochondrial function via its association with, and modification of CoxII.
Introduction
The epidermal growth factor receptor (EGFR)2 is overexpressed in many cancers including breast cancers, where its overexpression is associated with a poor prognosis (1, 2), yet EGFR alone when overexpressed in fibroblasts is a weak oncogene (3). The non-receptor-tyrosine kinase, c-Src, is also overexpressed in ∼70% of breast cancers (4), suggesting that EGFR and c-Src may function cooperatively in cancers that co-overexpress both kinases (1). Investigations in murine fibroblasts and in human breast cancer cells have revealed synergistic increases in DNA synthesis, soft agar colony growth, and tumor formation in nude mice when EGFR and c-Src are co-overexpressed as compared with cells overexpressing EGFR or c-Src alone (5, 6). These synergistic increases are dependent upon EGF stimulation, the kinase activity of c-Src, and c-Src phosphorylation of tyrosine 845 (Tyr-845) (7), a highly conserved residue in the activation loop of the catalytic domain of the EGFR. Substitution of a phenylalanine for a tyrosine at position 845 (Y845F) ablates EGF-induced DNA synthesis (even in the presence of overexpressed c-Src) without affecting the intrinsic kinase activity of the EGFR or its ability to phosphorylate canonical downstream substrates (13). Combined, these results suggest that phosphorylated Tyr-845 (Tyr(P)-845) elicits a critical mitogenic signal when EGFR and c-Src are co-overexpressed that is mediated through unconventional substrates.
Subsequent efforts to identify mediators of the Tyr(P)-845 EGFR mitogenic signal revealed that phosphorylation and transcriptional activation of Stat5b are dependent on Tyr(P)-845 and that Stat5b is required for EGF-induced DNA synthesis (8). Phage display screening of a human breast cancer tissue library also identified cytochrome c oxidase subunit II (CoxII) as a protein that binds the EGFR in a Tyr(P)-845- and EGF-dependent manner (9). CoxII is a mitochondrially encoded, transcribed, and translated protein that resides on the inner mitochondrial membrane (IMM) and is a key component of the oxidative phosphorylation cascade (10). It has been suggested that expression and activity (11) or protein-protein associations (12) of Cox subunits may regulate cytochrome c release from the mitochondria during apoptosis. In support of this idea, Boerner et al. (9) observed an increase in apoptosis in adriamycin-treated breast cancer cells expressing a mutant Y845F EGFR as compared with those expressing wild type, stimulated receptor. These results were suggestive of a cell survival role for EGFR in CoxII-dependent mitochondrial events.
That CoxII and EGFR reside in different subcellular compartments raised the question of where, intracellularly, the two proteins interact. Previous studies using confocal microscopy and biochemical fractionation showed an EGF-dependent transient co-localization of the EGFR at the mitochondria that was maximal around 20 min post stimulation (9). However, regulation of this event was not investigated.
In this study, a multifaceted regulatory mechanism for EGFR translocation to the mitochondria is revealed. Evidence is presented that demonstrates EGFR insertion into the mitochondrial membrane, EGF-induced translocation of c-Src to the mitochondria, and a role for c-Src in EGFR translocation. Clathrin-mediated endocytosis and an EGFR mitochondrial localization signal also play critical roles in the process. We find that EGFR and c-Src phosphorylate CoxII and that CoxII phosphorylation is increased after EGF stimulation. Further, EGF treatment results in decreased Cox activity and cellular ATP levels, the latter of which are in part dependent upon EGFR mitochondrial localization. These findings suggest that EGF stimulation alters mitochondrial function in the same time frame as EGFR-mitochondrial co-localization, events that may have implications for growth factor-mediated regulation of cellular bioenergetics and survival.
EXPERIMENTAL PROCEDURES
Cell Lines and Reagents
Clonal cell lines of C3H10T1/2 murine fibroblasts co-overexpressing human EGFR and wild type (wt) or kinase-defective (A430V) chicken c-Src, or singly overexpressing wt c-Src were previously described (5, 7, 13). Fibroblasts and HEK 293T cells were cultured as described in Maa et al. (5), and MDA-MB-231 breast cancer cells were cultured as described in Boerner et al. (9). Chinese hamster ovary cells were cultured as described in Jo et al. (14). EGF (50–100 ng/ml; Sigma) was used for ligand stimulation. Pretreatment with the following inhibitors before EGF stimulation was as indicated: PP2 (10 μm, Calbiochem) for 1 h, AG1478 (5 nm, Calbiochem) for 1 h, nocodazole (50 ng/ml, Sigma) for 3 h, and cytochalasin D (1 μm, Sigma) for 40 min.
Confocal Microscopy
Cells were cultured and processed according to Boerner et al. (9). The following primary antibodies were used: anti-EGFR mouse monoclonal antibody (mAb) (Transduction Laboratories/BD Biosciences), anti-EGFR sheep polyclonal antibody (pAb) (Upstate, Charlottesville, VA), anti-c-Src mAb (EC10 (15), anti-α-tubulin mouse mAb (Sigma), and actin-specific fluorescein isothiocyanate-conjugated phalloidin (Invitrogen). Images were captured with a Zeiss Standard 110 confocal microscope.
Electron Microscopy
200,000 cells were seeded onto glass coverslips, cultured for 24 h, serum-deprived, and either left untreated or stimulated with EGF for 20 min. Cells were then washed, fixed in 4% glutaraldehyde (Electron Microscopy Sciences, Hatfield PA) for 20 min, permeabilized in 0.1% saponin in 20% goat serum for 1 h, incubated overnight with EGFR mAb (Transduction Laboratories), washed, stained with ultra small gold (Electron Microscopy Sciences) for 2 h, and washed in 20% goat serum followed by phosphate-buffered saline. Samples were again fixed in 2% glutaraldehyde for 10 min, incubated with silver developer and enhancer (Electron Microscopy Sciences), rinsed, post-fixed for 30 min in 1% osmium tetroxide, washed, dehydrated in ethanol and acetone, and infiltrated with epoxy resin (Electron Microscopy Sciences) at 60 °C for 48 h. Ultrathin sections (70–80 nm) were contrast-stained with lead citrate and uranyl acetate and viewed in a JEOL 1230 (Japan Electron Optics Limited, Tokyo) transmission electron microscope (80 kV) equipped with a Scientific Instruments and Applications, Inc. (Duluth, GA) 12-C digital camera.
Fractionation and preparation of Sprague-Dawley rat forebrain mitochondria was carried out as described (16). Briefly, the purified mitochondrial fraction was fixed, and pellets were cut into 1-mm cubes, placed on pins, and frozen in liquid nitrogen. Ultra-thin cryosections (∼80 nm) were cut on a UCT cryo-ultramicrotome (Leica) at −130 °C and placed onto carbon- and Formvar-coated nickel grids. Sections were incubated with EGFR mAb (Transduction Laboratories) and Protein A-conjugated 10-nm gold particles (1:50) (Electron Microscopy Sciences) (16) and viewed on a JEOL 1200-EX transmission electron microscope at 80 kV.
Immunoprecipitation
Lysates were prepared for immunoprecipitation according to Boerner et al. (9). Two mg of protein was incubated with EGFR mAb 108, anti-Tom40 pAb (Santa Cruz Biotechnology, Santa Cruz, CA), or a negative antibody control for 24 h at 4 °C. Anti-EGFR (Cell Signaling, Danvers, MA) and anti-Tom40 (Santa Cruz) pAbs were used for immunoblotting. One mg of protein was incubated with CoxII (Invitrogen) or IgG antibody for 24 h at 4 °C. Anti-CoxII (Invitrogen) and anti-phosphotyrosine (Invitrogen) antibodies were used for immunoblotting.
Subcellular Fractionation
Cells were seeded on 15-cm plates (Nunc, Rochester, NY) at a density of 3 × 10⁶ cells/plate, cultured, serum-starved, and incubated with or without EGF. Crude mitochondria were obtained by differential centrifugation and subjected to alkali extraction as described by Eskes et al. (40). Fractions were loaded onto SDS-PAGE gels as cell equivalents (except for whole cell lysates). The following primary antibodies were used for immunoblotting: anti-EGFR rabbit pAb (Cell Signaling), anti-c-Src mouse mAb 2–17, anti-Lamp 2 rabbit pAb (Zymed Laboratories Inc./Invitrogen), anti-voltage-dependent anion channel rabbit pAb (Calbiochem), anti-nucleoporin 62 mouse mAb, anti-Rab4 mouse mAb, and anti-Bip/Grp mouse mAb (all from Transduction Laboratories). Antigen-antibody complexes were developed by chemiluminescence (Pico ECL, Pierce) and viewed by audioradiography.
Silencing of Protein Expression
To suppress the expression of clathrin heavy chain or Rab7, cells were subjected to nucleofection (Amaxa, Gaithersburg, MD) with clathrin heavy chain siGENOME SMARTpool CLTC, siGENOME SMARTpool RAB7, siCONTROL Non-Targeting siRNA #1 (all from Dharmacon), or no siRNA as recommended by Amaxa and incubated for 48 h. Cells were then analyzed by confocal microscopy or harvested for Western blotting. Fifty μg of total lysate was immunoblotted with anti-clathrin mouse mAb (Transduction Laboratories), anti-Rab7 pAb (Santa Cruz), or anti-β-actin mouse mAb (Sigma).
Generation and Expression of EGFR Constructs
A fragment encoding amino acids (aa) 622–666 of the EGFR was PCR-amplified from pcDNA-wt EGFR, cloned between the EcoRI and BamHI sites of phrGFP-C vector (Stratagene, La Jolla, CA), and used for generation and amplification of the EGFR fragments, aa 622–644 and 645–666. These smaller fragments were then cloned into the phrGFP-C vector between the aforementioned sites. All mutants were sequenced before use. The various enhanced green fluorescent protein (eGFP)-EGFR plasmids were nucleofected into 10T1/2 cells overexpressing c-Src using an Amaxa nucleofector as directed by the manufacturer and examined by confocal microscopy.
Full-length wt EGFR was PCR-amplified from pcDNA-wt EGFR and inserted into the NotI and XhoI sites of pCMV-Tag1 (Stratagene). pCMV-Tag1-Δ645–666 EGFR was constructed from the wt EGFR vector using the method of Ho et al. (41). The entire EGFR coding regions of both plasmids were sequenced before use. HEK 293T cells were transfected with 4 μg of wt EGFR or EGFR Δ645–666 plasmids using Lipofectamine2000 (Invitrogen) according to the manufacturer's instructions, serum-starved for 24 h, stimulated with EGF, and processed as described.
Construction and Purification of His-tagged CoxII Truncation Mutant
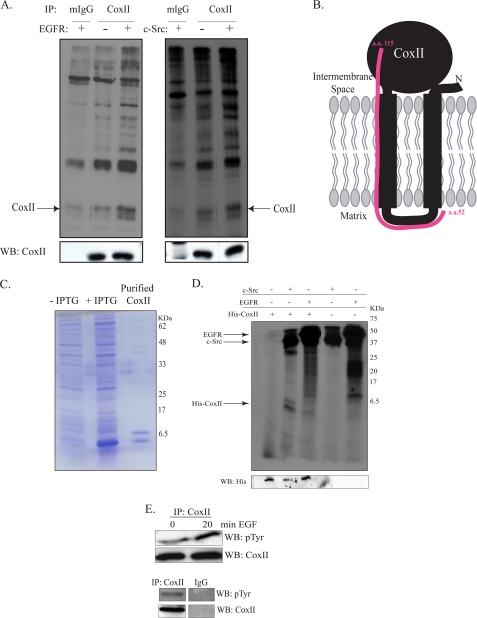
Mitochondria from MCF7 breast cancer cells were purified using a Mitochondria Isolation kit (Pierce). Mitochondrial DNA (mtDNA) was further purified by phenol-chloroform extraction and used as a template for PCR amplification of the region of CoxII denoted in Fig. 8B. The resulting fragment was cloned into pBluescript II SK+ vector between the EcoRI and XhoI sites. Because of the unique codon usage in mtDNA, the CoxII sequence was altered for bacterial expression by changing four Ala residues to Gly by PCR. The EcoRI-XhoI fragment of this construct was cloned into pET28a (Novagen, Gibbstown, NJ) and named His-CoxII.
FIGURE 8.
EGFR and c-Src phosphorylate CoxII. A, MDA-MB-231 cells were serum-starved for 24 h, and 1 mg of lysate protein was immunoprecipitated (IP) with anti-CoxII or IgG antibody. Precipitated proteins were incubated with purified c-Src or truncated EGFR in the presence of [γ-32P]ATP as described under “Experimental Procedures.” Precipitated proteins were also immunoblotted (WB) with CoxII antibody. B, mitochondrial DNA from MCF7 cells was used as a template for generation of a truncated His-CoxII cDNA (aa 52–115). C, the His-tagged CoxII truncation mutant was expressed in E. coli and purified as described under “Experimental Procedures.” The purified protein plus extracts from un-induced and induced cultures were resolved by SDS-PAGE and Coomassie-stained. IPTG, isopropyl 1-thio-β-d-galactopyranoside. D, purified His-CoxII was incubated with purified c-Src or EGFR in the presence of [γ-32P]ATP. Reactions were resolved by SDS-PAGE, dried, and exposed to film. Kinase reactions were also immunoblotted with an anti-His antibody. E, MDA-MB-231 cells were serum-starved for 24 h and EGF-stimulated, and 1 mg of lysate protein was immunoprecipitated with anti-CoxII or IgG antibody. Immunoprecipitated proteins were immunoblotted with CoxII or phosphotyrosine antibodies.
BL21 Escherichia coli, transformed by His-CoxII pET28a, were induced with 0.3 mm isopropyl 1-thio-β-d-galactopyranoside for 12 h at 25 °C. Bacterial pellets were suspended in cold CHAPS buffer (0.65% CHAPS, 50 mm Tris pH 8.0, 2 mm EDTA, 150 mm NaCl), sonicated, and clarified by centrifugation for 30 min at 25,000 × g. The His-CoxII peptide was purified by nickel-agarose chromatography, resolved by SDS-PAGE, and analyzed for purity by Coomassie stain.
32P Kinase Assay
Serum-starved MDA-MB-231 cells were lysed in Nonidet P-40 buffer (1% Nonidet P-40, 20 mm Tris, pH 8.0, 137 mm NaCl, 10% glycerol, 2 mm EDTA), and 1 mg of extract protein was immunoprecipitated with CoxII mAb (Invitrogen) or IgG control. Immunoprecipitated CoxII or 0.1 μg of purified His-CoxII was incubated with 18 catalytic units of purified Src (Upstate) and 10 μCi of [γ-32P]ATP (25 μm) in Src reaction buffer (50 mm HEPES, pH 8.0, 0.5 mm MnCl2, 0.25 mm sodium orthovanadate) or 0.025 μg of truncated EGFR (Upstate) and 10 μCi of [γ-32P]ATP (25 μm) in EGFR reaction buffer (8 mm MOPS, pH 7.0, 0.2 mm EDTA, 2 mm MnCl2, 0.8 m (NH4)2SO4, 0.25 mm sodium orthovanadate) for 30 min. The reaction was stopped by the addition of ⅕ volume 0.5 m EDTA, and samples were resolved by 15% (His-CoxII) or 12% (IP-CoxII) SDS-PAGE. The gels were dried and exposed to film.
Oxygen Consumption Assay
Cytochrome c oxidase activity of cells that had been incubated in serum free media or stimulated with EGF for 20 min was analyzed as described (17).
ATP Concentration Assay
Cells were plated in 96-well dishes at a density of 4500–5000 cells/well, cultured for 24 h, starved of serum for 24–48 h in low glucose Dulbecco's modified Eagle's medium (DMEM) (fibroblasts) or regular DMEM (MDA-MB-231s), and stimulated with EGF. Chinese hamster ovary cells were transfected with 0.1 μg of c-Src and 0.1 μg of wt EGFR, Δ645–666 EGFR, or K721 EGFR plasmids using Lipofectamine 2000 before serum starvation and stimulation. ATP concentration was measured with the ATPlite kit (PerkinElmer Life Sciences) according to manufacturer's instructions, and luminescence was read by a Synergy 2 single-channel multi-mode microplate reader (BioTek Instruments, Inc., Winooski, VT).
RESULTS
EGFR and c-Src Translocate to the Mitochondria after EGF Stimulation
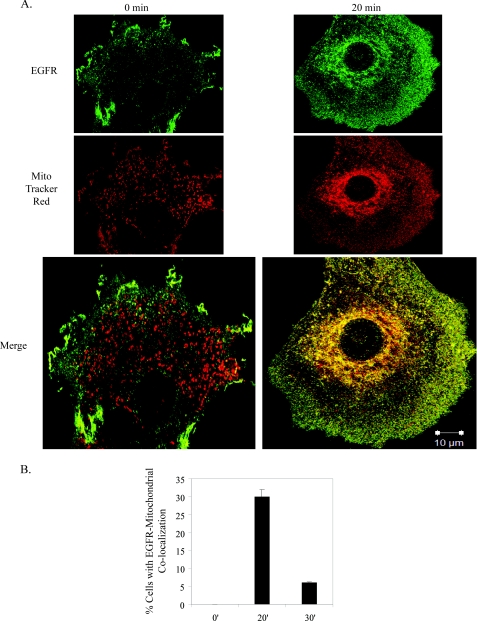
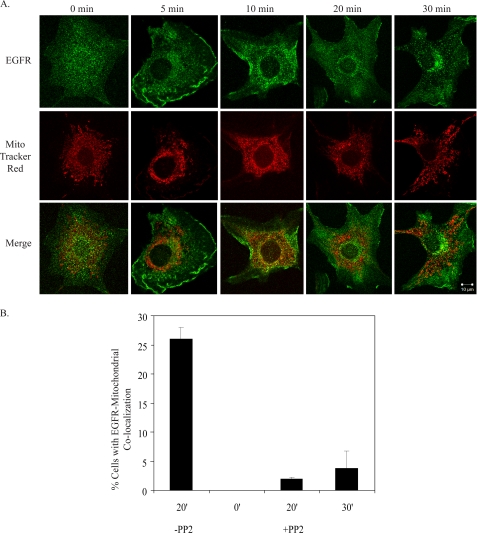
Fig. 1 depicts EGFR co-localization with the mitochondria in C3H10T1/2 cells co-overexpressing EGFR and c-Src after 20 min of EGF stimulation. The 0-min time point shows EGFR and mitochondria (identified by MitoTracker Red) in separate subcellular compartments, whereas at 20 min of stimulation, the EGFR image could be seen to merge with that of the mitochondria, suggesting a co-localization. Similar results were seen with MDA-MB-231 breast cancer cells (supplemental Fig. 2C and Z-stack images in supplemental Movies 1 and 2) and with either 10, 50, or 100 ng/ml EGF (data not shown). Quantification revealed that EGFR co-localized with the mitochondria in 30% of cells (Fig. 1B), and 5–10% of the total receptor in the cell was found in this compartment (Fig. 2D). By 30 or 40 min of EGF treatment, significantly less co-localization was observed (Fig. 1B, supplemental Fig. 1, and Ref. 9). These results, along with our published data support the idea that maximal detection of EGFR at the mitochondria occurs 10–30 min post-EGF stimulation and that the co-localization is transient.
FIGURE 1.
EGFR localizes to the mitochondria. A, 10T1/2 cells co-overexpressing EGFR and c-Src were cultured in serum-free media for 24 h, incubated in MitoTracker Red dye, and left unstimulated or stimulated with 100 ng/ml EGF for 20 min. Cells were immunostained for EGFR and examined by confocal microscopy at 63× magnification. Green, EGFR; red, MitoTracker; yellow, merge of green and red. B, the percentage of cells showing co-localization (merge of red and green stains) was quantified. Results are expressed as the mean ± S.D. of 2 experiments (50 cells were counted per experiment).
FIGURE 2.
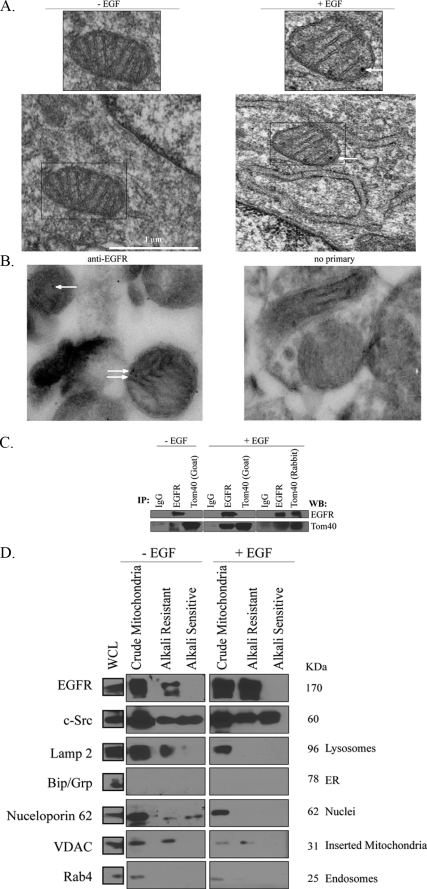
EGFR localizes to the mitochondria. A, 10T1/2 cells co-overexpressing EGFR and c-Src were cultured in serum-free media for 24 h, left untreated or stimulated with 100 ng/ml EGF for 20 min, and processed for immunoelectron microscopy analysis as described under “Experimental Procedures.” Arrows indicate positive EGFR staining. B, mitochondria were purified from rat brain and subjected to immunoelectron analysis as described under “Experimental Procedures.” Samples were stained with either anti-EGFR antibody or no primary antibody as a control. Arrows indicate positive EGFR staining in the mitochondria. C, lysates from EGF-stimulated or non-stimulated 10T1/2 cells co-overexpressing EGFR and c-Src were prepared as described under “Experimental Procedures.” Two mg of protein lysate was immunoprecipitated (IP) with EGFR, Tom40 (goat), Tom40 (rabbit), or control IgG. Precipitated proteins were immunoblotted (WB) with EGFR or Tom40 antibodies. D, biochemical fractionation of the EGFR and c-Src with the mitochondria is shown. 10T1/2 cells were treated as described under “Experimental Procedures.” Fractionation yielded proteins present in and associated with the mitochondria (crude mitochondria), proteins inserted in the mitochondrial membrane (alkali-resistant), and proteins peripherally attached to the mitochondrial membrane (alkali-sensitive). Fractions containing cell equivalents were immunoblotted with the following antibodies: EGFR, c-Src, voltage-dependent anion channel (VDAC), Rab4, Nucleoporin62, Bip/Grp, and Lamp2. Crude mitochondrial fractions represent 80 times the volume of whole cell lysates (WCL) present on the immunoblot, whereas alkali-resistant and -sensitive fractions represent 26 times the whole cell lysate volume. ER, endoplasmic reticulum.
Electron microscopy of 10T1/2 cells co-overexpressing c-Src and EGFR (Fig. 2A) and of MDA-MB-231 breast cancer cells (data not shown) also revealed positive EGFR staining in the mitochondria of EGF-stimulated cells. Similarly, electron microscopy of purified rat brain mitochondria demonstrated specific EGFR staining (Fig. 2B).
To determine if EGFR could associate with mitochondrial proteins other than CoxII, immunoprecipitation experiments with extracts from 10T1/2 double overexpressors were performed. Fig. 2C shows that EGFR co-immunoprecipitated with Tom40, an outer mitochondrial membrane (OMM) transport protein, in a reciprocal and EGF-dependent fashion. Fig. 2D shows that the full-length receptor biochemically co-fractionates with the mitochondria and is predominantly present in the alkali-resistant (membrane-inserted) fraction, purifying with the voltage-dependent anion channel. Western blotting for endosomal, lysosomal endoplasmic reticulum, and nuclear markers indicated that the alkali-extracted fractions were relatively clear of these organelles or vesicles. Together, these results suggest that the full-length EGFR can associate with an OMM protein and insert into mitochondrial membranes after EGF stimulation.
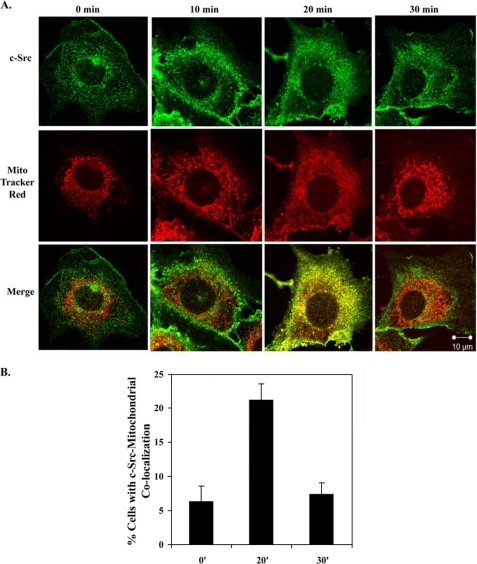
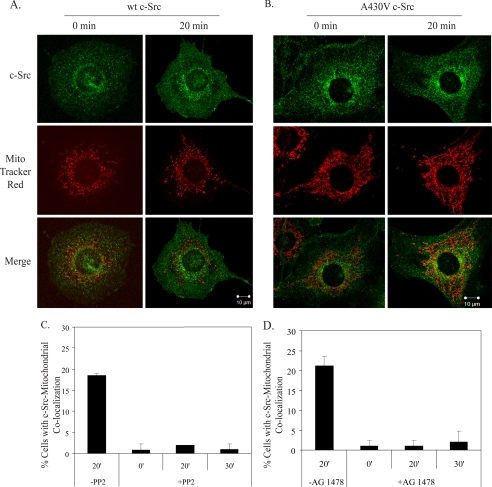
Because c-Src phosphorylates Tyr-845 of the EGFR (7), Tyr(P)-845 directly interacts with CoxII in the mitochondria (9), and c-Src has been found in the mitochondria of osteoclasts and bovine aortic endothelial cells (18, 19), c-Src localization after EGF stimulation was tracked in 10T1/2 cells co-overexpressing EGFR and c-Src. Confocal microscopy (Fig. 3A) revealed that maximal increases in c-Src localization at the mitochondria occurred 20 min post-EGF stimulation, mimicking the time course of the EGFR, and that 21% of the cells examined showed c-Src co-localization with the mitochondria at this time (Fig. 3B). Biochemical fractionation also revealed c-Src in both the inserted and peripherally attached fractions (Fig. 2D). To determine if the maximal increases in EGFR and c-Src at the mitochondria occurred simultaneously, 10T1/2 cells co-overexpressing EGFR and c-Src were immunostained for EGFR, c-Src, and mitochondria. Supplemental Fig. 1 shows a maximal merge of the stains at 20 min of EGF stimulation, suggesting EGFR and c-Src can translocate to the mitochondria simultaneously.
FIGURE 3.
c-Src localizes to the mitochondria. A, 10T1/2 cells co-overexpressing EGFR and c-Src were treated as in Fig. 1, A and B, except cells were immunostained for c-Src. Green, c-Src; red, MitoTracker; yellow, merge of green and red. B, the percentage of cells showing merge of the red and green stains is graphed. Results are expressed as the mean ± S.D. of 2 experiments (50 cells were counted per experiment).
EGFR Translocation Is Promoted by c-Src Overexpression and Kinase Activity
Boerner et al. (9) showed that EGFR overexpression greatly facilitated detection of EGF-stimulated EGFR translocation to the mitochondria. To determine if overexpression of c-Src also increased detection of the EGFR at the mitochondria, 10T1/2 cells with overexpressed EGFR and endogenous levels of c-Src were subjected to confocal microscopy. Fig. 4A shows a reduction in EGFR localization at the mitochondria after EGF stimulation as compared with Fig. 1, suggesting that overexpression of c-Src enhances EGFR-mitochondrial translocation. That the catalytic activity of c-Src is critical for this event is demonstrated by decreased EGFR translocation in 10T1/2 cells and MDA-MB-231 cells overexpressing EGFR and c-Src upon treatment with the Src family kinase inhibitor, PP2 (Fig. 4B and supplemental Fig. 2, A and C) or by 10T1/2 cells stably overexpressing wt EGFR and kinase-defective c-Src (supplemental Fig. 2B). Only 2% of 10T1/2 cells exhibited EGFR-mitochondrial co-localization after PP2 treatment (Fig. 4B). Combined, these results indicate that c-Src overexpression and kinase activity enhance EGFR translocation to the mitochondria.
FIGURE 4.
c-Src kinase activity and overexpression enhance EGFR localization to the mitochondria. 10T1/2 cells with endogenous levels of c-Src and overexpressed EGFR (A) or 10T1/2 cells co-overexpressing EGFR and c-Src (B) were treated as in Fig. 1, immunostained for EGFR, and examined by confocal microscopy. B, cells were incubated with 10 μm PP2 for 1 h before EGF stimulation. The percentage of cells showing co-localization of the EGFR with mitochondria was quantified. Results are expressed as the mean ± S.D. of 2 experiments (50 cells were counted per experiment).
c-Src Translocation Is Promoted by the Kinase Activities of EGFR and c-Src and Overexpressed EGFR
Because c-Src and EGFR expression levels and kinase activities regulate the frequency of EGFR seen at the mitochondria, we asked what factors might regulate c-Src translocation to the mitochondria. Fig. 5A shows that in 10T1/2 cells with overexpressed c-Src and endogenous levels of EGFR, detection of c-Src at the mitochondria in response to EGF was greatly reduced as compared with cells co-overexpressing both c-Src and EGFR (Fig. 3), suggesting that overexpression of EGFR promotes c-Src translocation to the mitochondria. Similarly, mutational (Fig. 5B) or pharmacological (Fig. 5C) inhibition of c-Src activity (PP2) or pharmacological inhibition of the EGFR (AG1478) (Fig. 5D) demonstrated the requirement for the catalytic activities of c-Src and EGFR for maximal increases in c-Src at the mitochondria. Combined, these results suggest that EGFR and c-Src co-overexpression and kinase activities enhance EGF-dependent translocation of c-Src and the EGFR to the mitochondria.
FIGURE 5.
c-Src localization to the mitochondria is promoted by overexpression of EGFR and kinase activities of EGFR and c-Src. 10T1/2 cells with endogenous levels of EGFR and overexpressed wt c-Src (A) or 10T1/2 cells co-overexpressing EGFR and kinase-defective c-Src (B) were treated as in Fig. 1 and immunostained for c-Src. C and D, 10T1/2 cells co-overexpressing EGFR and wt c-Src were treated with 10 μm PP2 (C) or 5 nm AG1478 (D) for 1 h before the addition of EGF. The percentage of cells with merge of the red and green stains was quantified. Results are expressed as the mean ± S.D. of 2 experiments (50 cells were counted per experiment).
Regulation of EGFR Mitochondrial Localization by Endocytosis
The dependence of the translocation on EGFR and c-Src tyrosine kinase activities, both of which have been shown to facilitate EGFR endocytosis (20–22), suggested that endocytosis might be one mechanism by which EGFR is transported to the mitochondria. To test this hypothesis, six inhibitors of EGFR endocytosis were utilized: AG1478, an EGFR kinase inhibitor (23); phenylarsine oxide, a pharmacological inhibitor of tyrosine kinases involved in endocytosis (24); potassium depletion, a means of inhibiting clathrin coat formation (25); nocodazole, a microtubule depolymerizing agent (26); cytochalasin D, an actin network inhibitor (27); Rab7 silencing, which slows the rate of EGFR degradation and promotes EGFR accumulation in EEA1 positive endosomes (28) and, most specifically, silencing of the clathrin heavy chain, a critical component of EGFR internalization (29). Combined, the results of the inhibitor studies (supplemental Figs. 2C, 3, 4, and 5) were consistent with an involvement of endocytosis in EGFR translocation to the mitochondria. However, the inhibitors employed could have broader effects than on endocytosis alone.
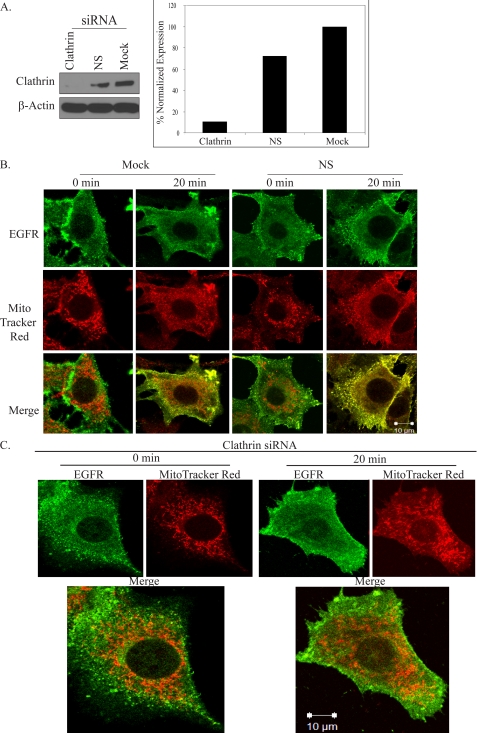
Thus, we sought to determine whether clathrin-mediated endocytosis specifically was critical for the process. 10T1/2 cells co-overexpressing EGFR and c-Src were subjected to clathrin silencing, and suppression of clathrin protein expression was confirmed by Western blotting (Fig. 6A). Fig. 6B shows that cells that had been mock-treated or nucleofected with nonspecific control RNAi and treated for 20 min with EGF exhibited increases in EGFR at the mitochondria. However, cells that were silenced for clathrin exhibited little to no detectable co-localization (Fig. 6C). Together, these results strongly suggested that clathrin-mediated endocytosis plays a critical role in regulating EGFR translocation to the mitochondria.
FIGURE 6.
Clathrin-mediated endocytosis regulates EGFR localization to the mitochondria. A, 10T1/2 cells co-overexpressing EGFR and c-Src were nucleofected with no oligos (Mock), nonspecific (NS) control siRNA, or clathrin heavy chain siRNA as described under “Experimental Procedures.” Suppression of clathrin heavy chain protein levels was assessed by Western blot analysis of 50 μg of whole cell lysates. Clathrin levels were determined by densitometric analysis and normalized to βactin. Cells described in B were nucleofected with no oligos (Mock) or nonspecific (NS) control siRNA; those in C were nucleofected with clathrin heavy chain siRNA. All cells were then incubated for 48 h in complete media and processed as in Fig. 1 for confocal microscopy. Green, EGFR; red, MitoTracker; yellow, merge of green and red.
EGFR Contains a Mitochondrial Localization Signal
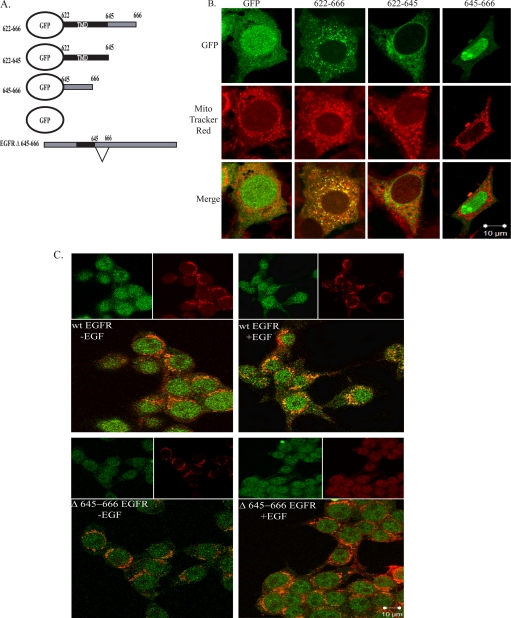
The juxtamembrane region of the EGFR contains basic amino acids that lie between residues 645 and 666. Some OMM proteins, such as Tom20 and Bcl-xL, contain a mitochondrial localization sequence consisting of highly hydrophobic and basic amino acid-rich sequences in their transmembrane domains (TMD) and membrane flanking regions (30, 31). To determine if aa 645–666 of the EGFR constituted a functional mitochondrial localization sequence, expression plasmids encoding eGFP-tagged EGFR trans- and juxtamembrane sequences were constructed (Fig. 7A). The constructs included eGFP alone, eGFP plus the EGFR (TMD) (aa 622–644), the juxtamembrane hydrophobic region (aa 645–666) or both combined (aa 622–666). Vector-only and mutant constructs were nucleofected into 10T1/2 cells overexpressing c-Src, and localization of the GFP-EGFR fusion proteins was determined by confocal microscopy. Fig. 7B shows that although the TMD (622–644) and the juxtamembrane (645–666) domains were unable to direct localization of eGFP to the mitochondria, the combined domains (622–666) did, suggesting that this region is sufficient for EGFR localization to the mitochondria.
FIGURE 7.
Analysis of the mitochondrial localization signal in the EGFR. A, eGFP-EGFR mutant plasmids is shown. B, 10T1/2 cells overexpressing c-Src were nucleofected with plasmids encoding either GFP alone, GFP-TMD-645–666, GFP-TMD, or GFP-645–666. Cells were cultured and processed as described under “Experimental Procedures.” 90–95% of cells that expressed the various GFP fusion proteins displayed the congruent phenotype shown. The number of cells counted per fusion protein was as follows: GFP, 9; Δ622–666, 15; Δ622–645, 7; Δ645–666, 6. C, HEK 293T cells were transfected with plasmids encoding wt EGFR or EGFR Δ645–666. Cells were processed as described under “Experimental Procedures.” Green, GFP constructs or EGFR (as indicated); red, MitoTracker; yellow, merge of green and red.
To determine if the basic amino acid-rich sequence in the juxtamembrane region was necessary for EGFR translocation to the mitochondria, expression plasmids encoding full-length wt EGFR and EGFR Δ645–666 were constructed (Fig. 7A). The constructs were transfected into HEK 293T cells, which express elevated levels of c-Src. Fig. 7C shows an EGF-inducible increase in wt EGFR localization with the mitochondria that is diminished with EGFR Δ645–666, defining a novel mitochondrial targeting function for this region of the receptor. Together, these results suggest that the TMD and aa 645–666 are sufficient for EGFR-mitochondrial localization and aa 645–666 are necessary for the full-length receptor to co-localize with the mitochondria.
EGFR and c-Src Phosphorylation of CoxII
The association of EGFR with CoxII (9) and a previous study describing c-Src phosphorylation of full-length, immunoprecipitated CoxII (18) led to the hypothesis that EGFR may phosphorylate CoxII. To test this hypothesis CoxII was immunoprecipitated from MDA-MB-231 cells and incubated with purified c-Src or purified, truncated EGFR in the presence of [γ-32P]ATP. Fig. 8A shows that full-length CoxII was phosphorylated by EGFR and c-Src above the level seen in the CoxII immunoprecipitates alone. As an alternative approach, a bacterial expression plasmid encoding that portion of CoxII identified in the phage display screen (Fig. 8B) was constructed from human mitochondrial DNA. This His-tagged CoxII fragment, which contains five putative EGFR/c-Src phosphorylation sites, was purified and analyzed by SDS-PAGE and Coomassie Blue staining (Fig. 8C). A doublet of peptides was observed, with the smaller one migrating at ∼6.5 kDa, the predicted size of the His-CoxII fragment. Fig. 8D shows that His-CoxII was phosphorylated by c-Src and to a lesser extent by EGFR over control levels in an in vitro kinase reaction, whereas Fig. 8E shows that CoxII tyrosine phosphorylation was increased in intact MDA-MB-231 cells in response to EGF stimulation. Combined, these studies suggest that EGF stimulation leads to an increase in CoxII phosphorylation that may be mediated by c-Src and/or EGFR.
Mitochondrial Function Is Altered after EGF Stimulation
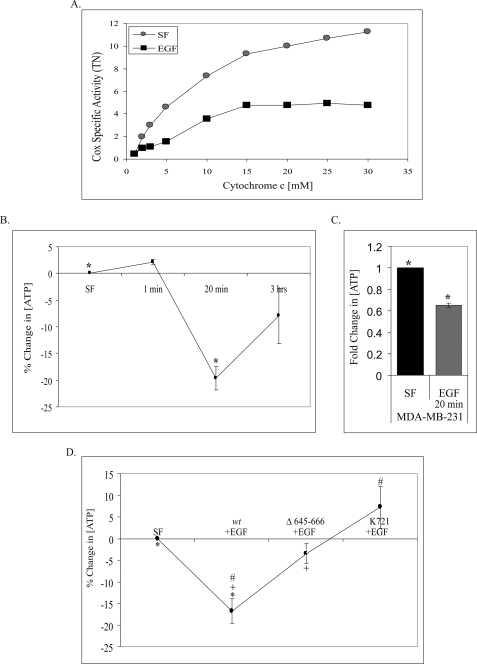
Several studies have linked phosphorylation of Cox subunits and inhibition of Cox activity (32). Thus, using a polarographic method (32), we asked whether alterations in mitochondrial function occurred in response to EGF. Fig. 9A shows that EGF stimulation led to an almost 60% inhibition of Cox specific activity in EGF-stimulated 10T1/2 double overexpressors over a broad range of cytochrome c concentrations.
FIGURE 9.
EGF stimulation alters mitochondrial function. A, 10T1/2 cells co-overexpressing EGFR and c-Src were left untreated or treated with EGF for 20 min, and Cox activity was measured by an oxygen consumption assay as described under “Experimental Procedures.” Specific activity (turnover number (TN)) is defined as consumed O2 (μm)/(min·total extract protein (mg)). Shown are representative results of three experiments. 10T1/2 cells co-overexpressing EGFR and c-Src (B) and MDA-MB-231 cells (C) were assayed for ATP levels after EGF treatment as described under “Experimental Procedures.” ATP concentration is plotted (B) as the percent change compared with unstimulated, SF, or as -fold change compared with SF (C). Results are shown as the mean ± S.E. of three experiments (*, p = 0.022) for B and of four experiments (*, p = 0.021) for C. D, Chinese hamster ovary cells were transiently co-transfected with c-Src and the indicated EGFR constructs and serum-starved for 24 h and left untreated or stimulated with EGF for 20 min. Transfection efficiency was >85% in all cases. ATP concentration is plotted as the percent change compared with SF. Average SF ATP concentrations were as follows: wt EGFR = 5103, Δ645–666 EGFR = 5057, K721 EGFR = 5096. The results are shown as the mean ± S.E. of seven experiments (*, p = 0.012; +, p = 0.044; #, p = 0.002).
These data and the central role of Cox in mitochondrial ATP production led us to question whether EGF stimulation affected cellular ATP levels. Fig. 9B shows a significant decrease in ATP levels at 20 min of post-EGF treatment in 10T1/2 cells co-overexpressing EGFR and c-Src and a return to near normal levels by 3 h, suggesting that EGF treatment leads to a transient but significant decrease in cellular ATP. Fig. 9C shows that a similar decrease occurs in MDA-MB-231 breast cancer cells at 20 min of EGF stimulation.
These findings led us to ask if the observed decreases in ATP were dependent upon EGFR mitochondrial localization. Chinese hamster ovary cells were transiently co-transfected with c-Src and wt EGFR, Δ645–666 EGFR, or kinase-defective (K721) EGFR. Fig. 9D shows a significant decrease in ATP levels with expression of wt EGFR, whereas expression of mitochondria localization-deficient Δ645–666 EGFR restores ATP levels to ∼80% of serum-free (SF) concentrations. Interestingly, kinase-defective EGFR increases ATP levels above SF levels, suggesting other signaling pathways downstream of EGFR may play a role in decreasing mitochondrial function. Combined, these data further highlight the effect both EGF stimulation and receptor localization have on mitochondrial function.
DISCUSSION
The previously described translocation of the EGFR to the mitochondria and its association with CoxII (9) raised a number of questions, including the mechanism of translocation and the consequences of EGFR presence in the mitochondria. Our study points to an endocytic pathway that involves the EGFR, c-Src, clathrin, and a mitochondrial localization sequence on the receptor as critical components of translocation. Once in juxtaposition to the mitochondria, the receptor can associate with OMM proteins, integrate into mitochondrial membranes, bind, and possibly phosphorylate CoxII, where involvement in cell survival pathways and ATP production after EGF treatment is indicated (9). Interestingly, c-Src translocates to the mitochondria with the same time course as the EGFR, where it also has the capability of phosphorylating CoxII.
Several pieces of evidence suggest that mitochondrial EGFR originates from the plasma membrane. First is the EGF dependence of the event (Figs. 1A and 2D and supplemental Fig. 2C and Movies 1 and 2). Second is the rapid and transient nature of the co-localization (10–30 min post-stimulation), which is well within the normal kinetics of endocytosis and before EGF-induced synthesis of the receptor (33). Third is the observation that fluorescein-labeled EGF co-localizes with the mitochondria, albeit with slightly slower kinetics than that of the EGFR (data not shown). Fourth is the requirement for the kinase activities of both EGFR and c-Src as well as microtubule and actin cytoskeletal networks. Numerous studies have demonstrated that these components are important for efficient EGFR internalization from the plasma membrane, ligand degradation, and intracellular receptor signaling (20, 21). Finally, translocation of the receptor is dependent on clathrin, a well documented regulator of EGFR internalization and trafficking of endosomes (29, 34). However, caveolin-mediated endocytosis and other mechanisms of internalization cannot be ruled out.
A putative mitochondrial localization sequence in the EGFR also appears to regulate co-localization of the EGFR with the mitochondria. Residues 622–644 (TMD) and basic amino acids (residues 645–666) in the juxtamembrane region are sufficient for localization of a non-mitochondrial protein (eGFP) to the mitochondria (Fig. 7). Fig. 7B demonstrates that the eGFP fusion protein containing residues 645–666 is targeted to the nucleus, whereas the fusion protein containing the TMD plus residues 645–666 is targeted to the mitochondria. The TMD alone is targeted to neither. Together, these results suggest that some membrane-dependent event is involved in mitochondrial localization of the EGFR.
Whether endosomes or later-stage vesicles transport the EGFR to the mitochondria and undergo membrane fusion and/or EGFR insertion is unknown. To date, little evidence exists for endosome fusion with the mitochondria. However, studies have suggested that mitochondria contain proteins that could mediate mitochondrial-vesicle fusion, including vamp1 (a v-snare), mito-phospholipase D, and mitofusins. A second possible mechanism of EGFR insertion into the mitochondrial membrane involves an endoplasmic reticulum translocase. Liao and Carpenter (35) found that Sec61, an endoplasmic reticulum translocase, promotes EGFR excision from membrane bilayers to allow EGFR transport into the nucleus. However, the kinetics of this process are slower than EGFR translocation to the mitochondria (hours versus minutes), rendering this mechanism less attractive. A third mechanism invokes the mitochondrial TOM complex. The TOM complex is typically known to aid import of mitochondrial proteins encoded by nuclear DNA. Nuclear-encoded proteins destined for the mitochondria associate with Tom20 or Tom70 at the mitochondrial surface are transferred to Tom40 (the pore component of the Tom complex) and finally inserted into the mitochondrial membrane. The association of the EGFR with Tom40 (Fig. 2C) suggests that the TOM complex might be involved in inserting the EGFR into mitochondrial membranes.
Once integrated into the mitochondrial membrane, what is the orientation of EGFR? Our current knowledge of vesicle fusion would indicate that the receptor spans the OMM with the ligand binding domain in the intermitochondrial membrane space (IMS) and the remainder of the molecule in the cytoplasm. However, Tyr(P)-845 of the EGFR kinase domain can directly bind to CoxII, a protein whose globular head is located in the IMS and transmembrane domains in the IMM (Fig. 8B) (9). In order for Tyr(P)-845 to bind Cox II, the kinase domain should reside in the IMS. Thus, two possible models of insertion are predicted. First, the EGFR could be transported to the IMM from the OMM so that Tyr(P)-845 would be in the IMS and the ligand binding region would reside in the matrix. Mitochondria outer and inner membrane contact sites mediate transfer of proteins from one membrane to the other (36), making such a transfer plausible. Alternatively, the orientation of the EGFR in the OMM may be flipped such that the ligand binding domain would reside in the cytoplasm and Tyr(P)-845 in the IMS, in the proper orientation for binding to CoxII. To explain this model, a protein similar to a flipase or a scramblase could be invoked that could facilitate flipping of the EGFR. Although speculative, these potential mechanisms provide starting points for future studies.
Another key question raised by this study is whether EGFR and c-Src localization at the mitochondria and the association of EGFR with CoxII affects mitochondrial function. To begin addressing this question, purified EGFR and c-Src were found to phosphorylate a recombinant CoxII fragment and CoxII immunoprecipitated from cells (Fig. 8). This result supports a previous study showing full-length, immunoprecipitated CoxII phosphorylation by immunoprecipitated c-Src from osteoclasts (18). We have also observed tyrosine phosphorylation of CoxII in cells stimulated by EGF. Our studies do not exclude the possibility of other phosphorylation or modification events on other mitochondrial proteins, including other Cox subunits and their effects on mitochondrial function.
The current study has shown that 20 min of EGF stimulation results in decreased Cox activity and ATP levels (Fig. 9). These results are incongruent with the data of Miyazaki et al. (18), who found that c-Src-dependent phosphorylation of Cox II in osteoclasts increases Cox activity. The reason for this discrepancy is unclear, but it could be due to the use of different cell types, growth factor stimulation, different assays for Cox activity, etc. However, we have demonstrated that the decrease in ATP can be partially reversed by EGFR that is deficient in mitochondrial localization (Fig. 9D), suggesting that the EGF-induced reduction of ATP levels in these cells does occur and is mediated in part by mitochondrial localization of the EGFR. These results are supported by previous work demonstrating that cAMP elevation and tumor necrosis factor-α treatments lead to tyrosine phosphorylation of Cox, inhibition of its activity, and reduced ATP levels (17, 32).
In both 10T1/2 fibroblasts and MDA-MB-231 cells, the observed reduction in Cox activity in response to EGF even in the presence of sufficient amounts of oxygen suggests a Warburg-like effect is occurring. This phenomenon is characterized by a conversion in ATP production from predominantly oxidative phosphorylation to glycolysis and pentose metabolism (37). The forces underlying this switch are still unclear, but the shift may occur to provide alternative building blocks for cell proliferation as well as to reduce mitochondria-associated free radical production, which might otherwise interfere with growth (38). Linked to this shift is the stabilization of hypoxia-inducible factor 1 (HIF1). A primary consequence of HIF1 activation is inhibition of mitochondrial ATP production and up-regulation of glycolytic ATP production (37). Initially identified by its stabilization and activation under hypoxia, HIF1 is now also known to be activated under normoxia by oncogenes, such as EGFR (39) and Src (37), among others. The mechanism by which these proteins lead to HIF1 activation is unclear, but it is within reason that this event could occur in response to EGF stimulation and/or EGFR/c-Src co-localization with the mitochondria. In this scenario EGF stimulation would lead to EGFR and c-Src activation followed by translocation of these molecules to the mitochondria, phosphorylation of CoxII by EGFR and/or c-Src, reduction in oxidative ATP and free radical production, and an increase in cell viability. Although speculative, this hypothesis serves as a starting point upon which further investigation into mechanisms of EGF-induced cellular survival can be based.
Acknowledgments
We gratefully acknowledge J. Redick and S. Guillot of the University of Virginia, F. Macaluso and L. Cummins of the Albert Einstein College of Medicine for contributions to the electron microscopy studies, and the Center for Molecular Medicine and Genetics, Wayne State University for technical contributions to the Cox activity assay.
This work was supported, in whole or in part, by National Institutes of Health Grants PO1 HD 32473 (to R. D. and G. H.), CA71449 (to S. J. P.), and CA123037 (to S. J. P.). This study was also supported by Susan G. Komen Breast Cancer Foundation Grant DISS 0402970 (to M. L. D.) and The Sharp Foundation of the University of Virginia Cancer Center Project 119867 (to S. J. P.).

The on-line version of this article (available at http://www.jbc.org) contains supplemental Figs. S1–S5 and Movies 1 and 2.
- EGFR
- epidermal growth factor receptor
- IMM
- inner mitochondrial membrane
- mAb
- monoclonal antibody
- pAb
- polyclonal antibody
- OMM
- outer mitochondrial membrane
- TMD
- transmembrane domain
- eGFP
- enhanced green fluorescent protein
- SF
- serum-free
- IMS
- intermitochondrial membrane space
- HIF1
- hypoxia-inducible factor 1
- CoxII
- cytochrome c oxidase subunit II
- siRNA
- small interfering RNA
- CHAPS
- 3-[(3-cholamidopropyl)dimethylammonio]-1-propanesulfonic acid
- MOPS
- 4-morpholinepropanesulfonic acid
- wt
- wild type
- aa
- amino acids.
REFERENCES
- 1.Biscardi J. S., Tice D. A., Parsons S. J. (1999) Adv. Cancer Res. 76, 61–119 [DOI] [PubMed] [Google Scholar]
- 2.Sainsbury J. R., Farndon J. R., Needham G. K., Malcolm A. J., Harris A. L. (1987) Lancet 1, 1398–1402 [DOI] [PubMed] [Google Scholar]
- 3.Velu T. J., Beguinot L., Vass W. C., Willingham M. C., Merlino G. T., Pastan I., Lowy D. R. (1987) Science 238, 1408–1410 [DOI] [PubMed] [Google Scholar]
- 4.Ottenhoff-Kalff A. E., Rijksen G., van Beurden E. A., Hennipman A., Michels A. A., Staal G. E. (1992) Cancer Res. 52, 4773–4778 [PubMed] [Google Scholar]
- 5.Maa M. C., Leu T. H., McCarley D. J., Schatzman R. C., Parsons S. J. (1995) Proc. Natl. Acad. Sci. U.S.A. 92, 6981–6985 [DOI] [PMC free article] [PubMed] [Google Scholar]
- 6.Biscardi J. S., Belsches A. P., Parsons S. J. (1998) Mol. Carcinog. 21, 261–272 [DOI] [PubMed] [Google Scholar]
- 7.Biscardi J. S., Maa M. C., Tice D. A., Cox M. E., Leu T. H., Parsons S. J. (1999) J. Biol. Chem. 274, 8335–8343 [DOI] [PubMed] [Google Scholar]
- 8.Kloth M. T., Laughlin K. K., Biscardi J. S., Boerner J. L., Parsons S. J., Silva C. M. (2003) J. Biol. Chem. 278, 1671–1679 [DOI] [PubMed] [Google Scholar]
- 9.Boerner J. L., Demory M. L., Silva C., Parsons S. J. (2004) Mol. Cell. Biol. 24, 7059–7071 [DOI] [PMC free article] [PubMed] [Google Scholar]
- 10.Cabral F., Solioz M., Rudin Y., Schatz G., Clavilier L., Slonimski P. P. (1978) J. Biol. Chem. 253, 297–304 [PubMed] [Google Scholar]
- 11.Ludovico P., Rodrigues F., Almeida A., Silva M. T., Barrientos A., Côrte-Real M. (2002) Mol. Biol. Cell 13, 2598–2606 [DOI] [PMC free article] [PubMed] [Google Scholar]
- 12.Yang W. L., Iacono L., Tang W. M., Chin K. V. (1998) Biochemistry 37, 14175–14180 [DOI] [PubMed] [Google Scholar]
- 13.Tice D. A., Biscardi J. S., Nickles A. L., Parsons S. J. (1999) Proc. Natl. Acad. Sci. U.S.A. 96, 1415–1420 [DOI] [PMC free article] [PubMed] [Google Scholar]
- 14.Jo M., Thomas K. S., O'Donnell D. M., Gonias S. L. (2003) J. Biol. Chem. 278, 1642–1646 [DOI] [PubMed] [Google Scholar]
- 15.Parsons S. J., McCarley D. J., Ely C. M., Benjamin D. C., Parsons J. T. (1984) J. Virol. 51, 272–282 [DOI] [PMC free article] [PubMed] [Google Scholar]
- 16.Douglas R. M., Lai J. C., Bian S., Cummins L., Moczydlowski E., Haddad G. G. (2006) Neuroscience 139, 1249–1261 [DOI] [PubMed] [Google Scholar]
- 17.Samavati L., Lee I., Mathes I., Lottspeich F., Hüttemann M. (2008) J. Biol. Chem. 283, 21134–21144 [DOI] [PMC free article] [PubMed] [Google Scholar]
- 18.Miyazaki T., Neff L., Tanaka S., Horne W. C., Baron R. (2003) J. Cell Biol. 160, 709–718 [DOI] [PMC free article] [PubMed] [Google Scholar]
- 19.Itoh S., Lemay S., Osawa M., Che W., Duan Y., Tompkins A., Brookes P. S., Sheu S. S., Abe J. (2005) J. Biol. Chem. 280, 26383–26396 [DOI] [PubMed] [Google Scholar]
- 20.Ware M. F., Tice D. A., Parsons S. J., Lauffenburger D. A. (1997) J. Biol. Chem. 272, 30185–30190 [DOI] [PubMed] [Google Scholar]
- 21.Glenney J. R., Jr., Chen W. S., Lazar C. S., Walton G. M., Zokas L. M., Rosenfeld M. G., Gill G. N. (1988) Cell 52, 675–684 [DOI] [PubMed] [Google Scholar]
- 22.Wilde A., Beattie E. C., Lem L., Riethof D. A., Liu S. H., Mobley W. C., Soriano P., Brodsky F. M. (1999) Cell 96, 677–687 [DOI] [PubMed] [Google Scholar]
- 23.Jaramillo M. L., Leon Z., Grothe S., Paul-Roc B., Abulrob A., O'Connor McCourt M. (2006) Exp. Cell Res. 312, 2778–2790 [DOI] [PubMed] [Google Scholar]
- 24.Hertel C., Coulter S. J., Perkins J. P. (1985) J. Biol. Chem. 260, 12547–12553 [PubMed] [Google Scholar]
- 25.Larkin J. M., Donzell W. C., Anderson R. G. (1986) J. Cell Biol. 103, 2619–2627 [DOI] [PMC free article] [PubMed] [Google Scholar]
- 26.Matteoni R., Kreis T. E. (1987) J. Cell Biol. 105, 1253–1265 [DOI] [PMC free article] [PubMed] [Google Scholar]
- 27.Lunn J. A., Wong H., Rozengurt E., Walsh J. H. (2000) Am. J. Physiol. Cell Physiol. 279, C2019–C2027 [DOI] [PubMed] [Google Scholar]
- 28.Bucci C., Thomsen P., Nicoziani P., McCarthy J., van Deurs B. (2000) Mol. Biol. Cell 11, 467–480 [DOI] [PMC free article] [PubMed] [Google Scholar]
- 29.Huang F., Khvorova A., Marshall W., Sorkin A. (2004) J. Biol. Chem. 279, 16657–16661 [DOI] [PubMed] [Google Scholar]
- 30.Kanaji S., Iwahashi J., Kida Y., Sakaguchi M., Mihara K. (2000) J. Cell Biol. 151, 277–288 [DOI] [PMC free article] [PubMed] [Google Scholar]
- 31.Kaufmann T., Schlipf S., Sanz J., Neubert K., Stein R., Borner C. (2003) J. Cell Biol. 160, 53–64 [DOI] [PMC free article] [PubMed] [Google Scholar]
- 32.Lee I., Salomon A. R., Ficarro S., Mathes I., Lottspeich F., Grossman L. I., Hüttemann M. (2005) J. Biol. Chem. 280, 6094–6100 [DOI] [PubMed] [Google Scholar]
- 33.Clark A. J., Ishii S., Richert N., Merlino G. T., Pastan I. (1985) Proc. Natl. Acad. Sci. U.S.A. 82, 8374–8378 [DOI] [PMC free article] [PubMed] [Google Scholar]
- 34.Vieira A. V., Lamaze C., Schmid S. L. (1996) Science 274, 2086–2089 [DOI] [PubMed] [Google Scholar]
- 35.Liao H. J., Carpenter G. (2007) Mol. Biol. Cell 18, 1064–1072 [DOI] [PMC free article] [PubMed] [Google Scholar]
- 36.Reichert A. S., Neupert W. (2002) Biochim. Biophys. Acta. 1592, 41–49 [DOI] [PubMed] [Google Scholar]
- 37.Denko N. C. (2008) Nat. Rev. Cancer 8, 705–713 [DOI] [PubMed] [Google Scholar]
- 38.Hüttemann M., Lee I., Samavati L., Yu H., Doan J. W. (2007) Biochim. Biophys. Acta. 1773, 1701–1720 [DOI] [PubMed] [Google Scholar]
- 39.Lu Y., Liang K., Li X., Fan Z. (2007) Mol. Cancer 6, 63. [DOI] [PMC free article] [PubMed] [Google Scholar]
- 40.Eskes R., Desagher S., Antonsson B., Martinou J. C. (2000) Mol. Cell. Biol. 20, 929–935 [DOI] [PMC free article] [PubMed] [Google Scholar]
- 41.Ho S. N., Hunt H. D., Hortorn R. M., Pullen J. K., Pease L. R. (1989) Gene 77, 51–59 [DOI] [PubMed] [Google Scholar]


