

Abstract
The regulated process of protein import into the nucleus of a eukaryotic cell is mediated by specific nuclear localization signals (NLSs) that are recognized by protein-import receptors. In this study, we present fluorescence-based methods to quantitatively address the physicochemical details of NLS recognition by the receptor protein importin α (Impα) in living cells. First, by combining fluorescence recovery after photobleaching measurements and protein-concentration calibration, we quantitatively define nuclear import saturability and afford an affinity value for NLS-Impα binding. Second, by fluorescence lifetime imaging microscopy, we directly monitor the occurrence of NLS-Impα interaction and measure its effective dissociation constant (KD) in the actual cellular environment. Our kinetic and thermodynamic analyses independently indicate that the subsaturation of Impα with the expressed NLS cargo regulates nuclear import rates in living cells, in contrast to what can be predicted on the basis of available in vitro data. Finally, our experiments also provide evidence for the regulation of nuclear import mediated by the intrasteric importin β-binding domain of Impα and yield the first estimate of its autoinhibition energy in living cells.
Introduction
Communication between nucleus and cytoplasm in eukaryotic cells is mediated by nuclear pore complexes (NPCs),2 large macromolecular assemblies that punctuate the nuclear envelope. Transport across the NPC not only localizes proteins destined to the nucleus or cytoplasm but also plays a key role in signal transduction pathways and in the regulation of major cellular processes. Small proteins (≤60–70 kDa) can move through the NPC by passive diffusion, whereas larger proteins require energy-consuming receptor-mediated mechanisms (1).
A much studied mechanism for active translocation across the nuclear envelope is based on the presence of a “classical” nuclear localization sequence (NLS). A classical NLS can consist of one cluster of basic residues (monopartite) (2) or of two clusters separated by 10–12 amino acids (bipartite) (3). NLS-bearing cargoes are imported by a heterodimeric import receptor composed by importin α (Impα) and β (Impβ) (4). The C-terminal region of Impα mediates direct recognition and binding to NLS-bearing proteins (5). Impα, however, also contains a small N-terminal autoinhibitory domain (named importin β-binding domain; IBB) that blocks this NLS-binding site (6). Binding of Impβ to Impα suppresses this autoinhibitory blockade and allows Impα to bind cargo proteins with high affinity (7). Subsequent translocation of the Impα·Impβ cargo complex through the NPC is believed to be mediated by weak hydrophobic interactions between Impβ and nucleoporins (8). On the nuclear side of the NPC, RanGTP dislodges Impβ from the complex (9). The Impα IBB domain then competes with the NLS for the binding site, facilitating the release of the NLS cargo into the nucleus (7, 10). Impα cargo dissociation is further assisted by the high affinity binding of cellular apoptosis susceptibility (CAS) protein to NLS-free Impα. CAS is a carrier protein that drives Impα export in association with RanGTP (11). Both the RanGTP·Impβ and RanGTP·CAS·Impα complexes translocate back to the cytoplasm (12, 13), where they disassemble so that transport receptors can be recycled for another round of import. The asymmetric distribution of RanGTP between nucleus and cytoplasm provides the driving force leading to unidirectional cargo transport (14).
This complex protein import mechanism is governed by the precise tuning of interactions between the various species that ensure its characteristic efficient unidirectional rate. A thorough description of nuclear import thus requires a quantitative analysis of the thermodynamic and kinetic aspects involved in these mechanisms. In particular, the NLS-Impα binding affinity is an important determinant of how efficiently cargo is transported into the nucleus. Indeed, recent models suggest that nuclear import rates are largely governed by the level of the NLS receptor Impα (15).
Concerning the thermodynamics of the process, a few reports based on in vitro-purified and -isolated proteins provided the binding affinity between different molecular components of the system (7, 10, 16–19). High affinity interactions were shown between certain components of the nuclear import pathway (e.g. dissociation constant KD ≈ 40 nm for NLS-Impα binding (10)). On the other hand, a recently published analysis of import kinetics in living yeast cells (17) showed that the import machinery carries NLS cargo molecules into the nucleus at very low rates, a result that conflicts with the nanomolar dissociation constant values between the karyopherin (analogous of the mammalian importin) and the NLS; the same authors reported 20–100 nm KD values based on in vitro assays. Moreover, no saturation of import rates was observed, despite NLS cargoes being >20-fold more abundant than their carriers.
In this article, we address the intriguing discrepancy that we believe is related to the peculiar conditions of the complex environment present in living cells. We analyze both thermodynamics and kinetics of the import process in living mammalian cell lines. A few high resolution imaging techniques are exploited to quantitatively study the nuclear import process, namely fluorescent recovery after photobleaching (FRAP) and fluorescence lifetime imaging (FLIM). FRAP is used to measure cargo import kinetics and yields an estimate of the NLS-Impα equilibrium constant in living cells. Indeed, FRAP allows one to monitor dynamic processes without perturbing their biochemical steady state because the latter does not depend on the emissive properties of the monitored probe. In the supplemental equations 1–19, we illustrate the mathematical model used to describe the nucleocytoplasmic exchange in the presence of both passive and active transport through the nuclear envelope. We shall refer to this model for the analysis of FRAP data presented in this study. FLIM allows the quantitative intracellular monitoring of the binding interactions encompassing Impα and NLS-bound cargo.
Both FRAP and FLIM lead to NLS-Impα affinity values in the micromolar range, different from available in vitro estimates. We argue that the micromolar range actually characterizes complex formation in the cytoplasm and regulates nuclear import rates in living cells. Our experiments also support a model of nuclear import regulation mediated by the intrasteric IBB sequence in Impα and provide the first estimate of the autoinhibition energy in a living cell.
EXPERIMENTAL PROCEDURES
Plasmids, Cell Culture, and Transfections
Cloning of the EGFP, EBFP-EGFP (GFP2), NLS-EGFP, and NLS-EBFP-EGFP (NLS-GFP2) constructs used in this study was described in detail in a previous report (20). The mammalian expression vector encoding for NLS-mCherry fusion protein was generated in two steps. First, the mCherry template (generous gift of Roger Y. Tsien's laboratory) was amplified by PCR. The primers used (Sigma-Genosys) were 5′-CCC AAG CTT GGG ATG GTG AGC AAG GGC GAG GAG-3′ and 5′-CCG GAA TTC CGG TTA CTT GTA CAG CTC GTC CAT GCC-3′. Second, the mCherry template was inserted into HindIII-EcoRI sites of the NLS-EGFP pcDNA3 template (20).
EGFP-Impα plasmid (mouse full-length mNPI2) was kindly provided by Yoshihiro Yoneda (Department of Frontier Biosciences, Osaka University). Detail about the plasmid can be found in Ref. 21.
CHO-K1 were purchased from ATCC (CCL-61) and were grown in Ham's F12K medium supplemented with 10% fetal bovine serum at 37 °C and in 5% CO2. HeLa cells (CCL-2, ATCC) and U2OS cells (HTB-96, ATCC) were grown in Dulbecco's modified Eagle's medium supplemented with fetal bovine serum (10%) with glutamine (2 mm), penicillin (10 units/ml), and streptomycin (10 μg/ml), at 37 °C and 5% CO2 atmosphere.
Transfections were carried out by using Lipofectamine reagent (Invitrogen) according to the manufacturer's instructions. For live imaging, 10 × 104 cells were plated 24 h before experiments onto 35-mm glass bottom dishes (WillCo-dish GWSt-3522).
Fluorescence Microscopy
Cell fluorescence was measured using a Leica TCS SP2 inverted confocal microscope (Leica Microsystems AG, Wetzlar, Germany) interfaced with an Ar laser for excitation at 458, 476, 488, and 514 nm and with a helium-neon laser for excitation at 561 and 633 nm.
Glass bottom Petri dishes containing transfected cells were mounted in a temperature-controlled chamber at 37 °C (Leica Microsystems) and viewed with a 40 × 1.25 numerical aperture oil immersion objective (Leica Microsystems). Images were collected at low excitation power and monitoring emission by means of the Acousto-Optical beam splitter (AOBS) detection system of the confocal microscope. The following collection ranges were adopted: 500–550 nm (EGFP) and 580–650 nm (mCherry). Background signal was subtracted in all images.
Determination of the Global Concentrations of EGFP- and mCherry-linked Proteins in Living Cells
The global concentrations of intracellular EGFP- and mCherry-linked proteins were determined by using the synthetic adduct fluorescein-glycine (“F-Gly”). F-Gly was obtained by reaction of the succinimidyl ester derivative of fluorescein (Invitrogen, Molecular Probes) and glycine (Sigma) in citrate buffer at pH 9. The fluorescence signal of known phosphate-buffered saline solutions of F-Gly was collected under the microscope using EGFP acquisition settings. Fluorescence counts were converted into absolute concentration values taking into account the difference in brightness (molar absorption times fluorescence quantum yield) between EGFP (or mCherry) and F-Gly.
Fluorescence Recovery after Photobleaching: Experimental Details and Data Analysis
Each FRAP experiment started with a four-time line-averaged image (pre-bleach) of the cell followed by a single-point bleach (nonscanning) near the center of the nucleus with laser pulse at full power to photobleach most of the nuclear fluorescence. Fluorescence recovery was measured by starting a time lapse acquisition within a few milliseconds after bleaching, with the imaging settings described above.
Our mathematical description of nucleocytoplasmic exchange in the presence of both passive diffusion and active transport shows that the concentration of fluorescent species in the cytoplasm and nucleoplasm follow a first-order kinetics (supplemental Equations 9–10). Hence, under the assumption of fluorescence proportionality to concentration, the collected FRAP curves in both compartments were fitted to a monoexponential equation,
where superscripts 0 and ∞ label the fluorescence intensity collected at time 0 and asymptotically after bleaching, respectively. Fluorescence values were normalized by the signal of the entire cell at the same time to correct for bleaching caused by imaging and by pre-bleach fluorescence to verify the presence of an immobile fraction of fluorescent molecules within the nucleus. The nuclear volume (V) was calculated by assuming an ellipsoid shape for the nucleus with semiaxes dx, dy, and dz: V = (4/3)·π·dx·dy·dz. The three axes were estimated from confocal images of the nucleus.
Fluorescence Lifetime Measurements
FLIM measurements were performed by illuminating the sample with a 468-nm pulsed laser diode at a 50 MHz repetition rate. Fluorescence emission was detected by means of fast photon-counting heads (H7422P-40, Hamamatsu) and time-correlated single photon counting electronics (SPC-830, Becker & Hickl, Berlin, Germany) at 500–540 nm (bandpass filter 510AF23, Omega Optical, Brattleboro, VT). Measurements were performed in living cells with the confocal system previously described with a 40× oil immersion objective (Leica Microsystems). Laser power was adjusted to yield photon-counting rates of ∼105 counts per second. Fluorescence decay was analyzed by the SPCImage (Becker & Hickl, Berlin, Germany) software package. Time-correlated single photon counting-detection was used to generate a lifetime map by fitting the fluorescence decay curve in each pixel of the image. Fluorescence decay curves of biological samples containing only unbound (EGFP-Impα) or only bound Impα (NLS-mCherry]·EGFP-Impα) were fitted within a monoexponential decay model; the result of the fitting procedure is thus a single fluorescence lifetime, characteristic of the Impα form (τF and τB, respectively). When a mix of unbound and bound Impα molecules were present, lifetime data were fitted to a biexponential decay law,
where τF and τB were set to their previously determined values, and the amplitude coefficients XB and XF are the fitting parameters.
RESULTS
Subcellular Localization of Fusion Proteins
The fluorescent fusion proteins used in this study were separately expressed in CHO-K1 cells, and their subcellular localization was analyzed by confocal microscopy (Fig. 1). As expected, fluorescent proteins (EGFP, GFP2, and mCherry) are evenly distributed in the cells (i.e. ratio between nucleoplasmic and cytoplasmic fluorescence Keq ∼ 1; Fig. 1A), whereas fluorescent proteins fused to the SV40 NLS are predominantly localized in the nucleus (i.e. Keq > 1; Fig. 1B). Nuclear accumulation is more evident with increasing cargo molecular weight (see Table 1 for the range of calculated Keq values), because nucleus-to-cytoplasm passive diffusion is impaired by a larger cargo size (20). FRAP analysis of mCherry and NLS-mCherry nucleus/cytoplasm shuttling kinetics and cytoplasmic diffusivity (data not shown) yielded transport parameters in keeping with previously reported results on analogous EGFP-based constructs (22). EGFP-Impα is localized in both compartments (with a moderate nuclear enrichment; Fig. 1C). Data show Impα accumulation on the nuclear envelope that can be linked to its binding to NPC components, such as nucleoporins and importin β (23). This Impα localization is consistent with existing studies in living cells (21).
FIGURE 1.

Subcellular localization of constructs upon transfection. A, shown is the localization of untagged EGFP, GFP2, and mCherry proteins analyzed by confocal imaging. Scale bars, 10 μm. B, the corresponding NLS-tagged counterparts (NLS-EGFP, NLS-GFP2, and NLS-mCherry) are predominantly localized in the nucleus. C, a subcellular localization of EGFP-Impα recombinant protein is shown.
TABLE 1.
Thermodynamic and kinetic parameters derived for NLS-tagged EGFP and GFP2 cargoes
Keq was calculated by taking the ratio between nucleoplasmic and cytoplasmic fluorescence (range of reported values; NLS-mCherry yielded Keq values similar to those of NLS-EGFP). KD* and vC→N were derived by fitting of cumulative FRAP data to Equation 4. CCImpα was set to the reported estimate of 1 μm (25).
| Keq | KD* | vC→N | |
|---|---|---|---|
| μm | μm3/s | ||
| NLS-EGFP | 2.2–4.6 | 16 ± 7 | 294 ± 24 |
| NLS-GFP2 | 7.5–20.4 | 20 ± 6 | 304 ± 26 |
Determination of Fluorescent Protein Concentration in a Living Cell
Our FRAP analysis requires the quantitative determination of the concentration of GFP-tagged proteins in a living cell (in this case, EGFP-Impα or NLS-EGFP and NLS-mCherry). One possible way to calibrate GFP-tagged proteins makes use of GFP solutions of known concentration in the cell medium. Confocal imaging of GFPs, however, usually exhibits a gradient in the fluorescence intensity along the optical axis (z) that is usually attributed to aspecific adsorption of the protein onto the bottom of the Petri dish (Fig. 2A, right panel). A time-consuming pretreatment of the Petri dish with an adsorption blocking agent such as bovine serum albumin or chlorosilane is required whenever GFPs need be used for calibration (24), but this treatment is not usually compatible with cell viability. Here, we overcame this problem by means of a novel method based on the stable and biocompatible F-Gly. F-Gly displays a homogeneous distribution of fluorescence intensity along the z axis when confocally imaged (Fig. 2A, left panel) and retains most spectral characteristics of EGFP. Importantly, F-Gly does not permeate into cells and can therefore be added to cell cultures and imaged at the same focal height of cells (Fig. 2B) without affecting the intracellular determination of EGFP. This prevents the effect of optical aberration on fluorescence determination at different focal heights from the coverslip.
FIGURE 2.

The concentration calibration method. A, intracellular concentrations of expressed proteins were calibrated using the F-Gly adduct. F-Gly fluorescence is uniformly distributed along optical axis z (left panel), whereas EGFP shows a gradient of fluorescence intensity in the same conditions (right panel, scale bar: 10 μm). B, F-Gly also displays a homogeneous distribution along the x and y axes when confocally imaged and cannot permeate into cells. Scale bar: 10 μm.
Following this procedure, we carried out the calibration of intracellular EGFP concentration by using increasing amounts of F-Gly in the cell medium. The brightness ratio between EGFP and F-Gly was easily determined by steady state fluorescent measurements in a cuvette adopting the same excitation and collection ranges of experiments conducted in living cells. The concentration of mCherry was in turn calculated by using the measured brightness ratio between EGFP and mCherry in two excitation/emission setups.
We found EGFP-Impα concentration values ranging from 1–2 μm up to 20–30 μm in highly transfected cells. Transfected NLS-mCherry generally yielded a wider range of expression levels, ranging from low micromolar concentration up to 200–300 μm.
FRAP Analysis of Nuclear Import Kinetics in Living Cells
FRAP analysis of nucleocytoplasmic shuttling was performed on cells expressing the NLS-EGFP construct (or NLS-GFP2, see “Experimental Procedures”). The nuclear fluorescence was photobleached, and the subsequent recovery was monitored by time-lapse imaging (Fig. 3A). The fluorescence recovery in the nucleoplasm and/or the decay in the cytoplasm were well fitted by monoexponential equations (Fig. 3B), consistently with the kinetic behavior of our model of nucleocytoplasmic exchange (supplemental equations 9–10). The ratio between the asymptotic nuclear and cytoplasmic fluorescence, the recovery constant, the nuclear volume, and the global concentration of NLS molecules in the cytoplasm (denoted here by CNLS) were combined to calculate ΦC→N and PN, which represent the excess flux of cargo toward the nucleus solely due to active transport and nuclear envelope permeability, respectively (for definitions and more details, refer to supplemental data). Our model of nucleocytoplasmic diffusion links the latter two parameters to the concentration of cargo molecules in the cytoplasm bound to the importin complex (denoted here by [NLS·Impα]) according to
where vC→N (μm3/s) is the maximum rate for active transport toward the nucleus (i.e. the rate achievable when all NLS-EGFP is bound to Impα).
FIGURE 3.

The FRAP assay. A, fluorescence recovery after nuclear photobleaching as NLS-EGFP diffuses from cytoplasm to nucleus. Nuclear fluorescence (pre-bleach panel) was photobleached by irradiating a single point at high laser power for ∼10 s. Recovery was recorded by time-lapse imaging. Selected images are reproduced and labeled with the corresponding acquisition time. Scale bar, 10 μm. B, time course of nucleoplasmic fluorescence recovery (filled green circles) and cytoplasmic fluorescence decrease (open green circles) for the cell shown in A. As photobleaching is an irreversible process, the fluorescence recovery in the nucleus is attributable to the influx of unbleached NLS-EGFP molecules from the cytoplasm, in equilibrium with the efflux of bleached molecules from nucleus to cytoplasm: these symmetric curves are fitted by a single-exponential (continuous black lines). The nuclear fluorescence trace shows a higher dynamic range of variation (from 0.25 to 1) compared with the cytoplasmic trace, owing to the effect of concentration of fluorescent molecules in a smaller compartment, the nucleus. C, time-resolved experiments were analyzed using a model that includes both reversible passive diffusion between two compartments (black arrows) and active nuclear import from the cytoplasm (red arrow). Each contribution is characterized by one permeability factor (see supplemental data for more details). D, excess active fluxes (ΦC→N, mol/s) are calculated cell-by-cell by Equation 3. ΦC→N is here plotted against the corresponding cytoplasmic cargo concentration (CNLS), obtaining the whole population data plot. Cumulative data are fitted to the right term of Equation 4 and yield an effective dissociation constant KD* = 16 ± 7 μm.
For each cell, ΦC→N (mol/s) was determined experimentally and plotted against CNLS. (The latter was obtained from the fluorescence emission making use of our calibration procedure; Fig. 3D.) Notably, CNLS spans a large interval of concentrations on account of the large expression variability of the NLS-EGFP cargo and so does the excess active transport flux ΦC→N. Fig. 3D shows that ΦC→N increases linearly up to CNLS ≈ 15–20 μm and indicates that, at this concentration, the endogenous Impα/β transport system is operating below maximum capacity; at higher NLS-EGFP cytoplasmic density values, import rates deviate from linearity and finally reach a saturation value, as expected for a binding isotherm.
If we assume a single binding equilibrium between the NLS cargo and Impα (Scheme 1), [NLS·Impα] can be expressed as a function of CNLS, the global cytoplasmic concentration of Impα (CImpα), and the binding dissociation constant KD*.
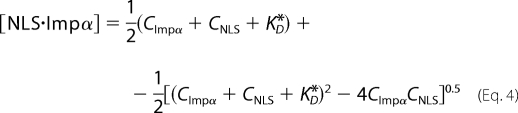 |
To recover the biochemically relevant parameter KD*, we fitted the ΦC→N versus CNLS curve with Equations 3 and 4, setting CImpα = 1 μm, the reported value of global Impα concentration in a living cell (25). Our fitting analysis yields KD* = 16 ± 7 μm and vC→N = 300 μm3/s, as reported in Table 1 (for a mean nuclear volume of 800 femtoliters, this vC→N value corresponds to ∼1.5 × 10⁸ molecules/s). As shown in Fig. 4A, we found an analogous trend in ΦC→N versus CNLS for NLS-GFP2, yielding a similar value for the maximum rate of active transport toward the nucleus, vC→N (Table 1). We previously reported that this 2-fold increase in cargo size has a severe impact on passive diffusion kinetics in living cells (20). Conversely, we show here that the kinetics of NLS cargo nuclear import by the endogenous Impα/β machinery is not significantly affected by the same increase in cargo size. Notably, the trend of ΦC→N versus CNLS does not depend on the specific cell line chosen (Fig. 4B).
SCHEME 1.

Single binding equilibrium between NLS cargo and Impα. X and Y label the fluorescent proteins linked to the two binding partners. FRAP, X = EGFP or GFP2 and Y = none; FLIM, X = mCherry and Y = EGFP.
FIGURE 4.

The FRAP assay: application to NLS-GFP2 and other cell lines. A, despite its influence on the shuttling kinetics (reported in Ref. 20), GFP2 cargo has no effect on the saturation behavior of nuclear import rates. Fitting of cumulative NLS-GFP2 data to Equation 4 (solid black line) yielded KD* = 20 ± 6 μm. B, the same FRAP analysis of nuclear import was conducted in other two cell lines: HeLa (black dots) and U2OS (red dots). Nuclear import saturability in these cell lines is consistent with that observed in CHO-K1 cells.
Available in vitro assays testing the binding equilibrium of NLS and Impα (the latter in the Impβ-activated form) indicate that the thermodynamic dissociation constant (KD) is in the nanomolar range (17), in contrast with our observation of a micromolar binding range. We wish to stress, however, that KD* can indeed be very different from KD, because of the complex and heterogeneous nature of the intracellular environment. On account of this, KD* will be henceforth referred to as the “effective dissociation constant” of the NLS-Impα binding equilibrium. The origin of this difference and the relevance of the KD* value will be discussed in the following sections.
FLIM Analysis of NLS-Impα Interaction
We developed a Förster resonance energy transfer (FRET)-by-FLIM method to quantitatively monitor protein-protein interactions in living cells and obtain a separate independent measurement of the affinity of NLS-Impα binding in physiological conditions. We used EGFP as the donor fluorophore (high brightness and photostability and monoexponential lifetime) fused to Impα and mCherry as the acceptor (fast maturation, large absorption, and high photostability (26, 27)) fused to the NLS. A quantitative description of the NLS-Impα interaction was obtained by extracting from the FLIM data the molar fractions of free and bound Impα, i.e. XF and XB, respectively (Equation 2). Following the procedure described under “Experimental Procedures,” we first determined τF and τB, the donor lifetime values corresponding to free EGFP-Impα and to its bound form, respectively.
To measure the lifetime of donor, we recorded intensity and lifetime images of cells expressing only EGFP-Impα (Fig. 5A). As the expected fluorescence decay was well fitted by a monoexponential function yielding τF = 2.57 ± 0.01 ns (mean ± S.D. for n = 12 analyzed cells, Table 2). The EGFP lifetime is quite homogeneous cell wide (Fig. 5A, color-coded image) consistently with the known insensitivity of EGFP emission to the local details of the cellular environment (see Fig. 5B for the experimental lifetime dispersion).
FIGURE 5.

FLIM analysis of NLS-Impα binding in a living cell. A, a CHO-K1 cell transfected with EGFP-Impα is shown: intensity image (left) and τF lifetime map (right). Scale bar, 10 μm. B, fluorescence decays were fitted by a monoexponential function, yielding a mean τF ≈ 2.59 ns (lifetimes from the whole cell are plotted in the frequency histogram). C, intensity image (left panel) and τB lifetime map (right panel) for a cell expressing both EGFP-Impα and NLS-mCherry under energy-depleting conditions (-ATP). Scale bar, 10 μm. D, monoexponential fitting of fluorescence decays yielded an average τB ≈ 2.19 ns for the whole nucleus.
TABLE 2.
Average (mean ± S.D.) lifetime values (ns) from the whole population of observed cells
FLIM data were analyzed under a monoexponential model as described under “Experimental Procedures.”
| mCherry | NLS-mCherry (−ATP) | ||
|---|---|---|---|
| EGFP-Impα | 2.57 ± 0.01 | 2.55 ± 0.03 | 2.19 ± 0.04 |
To determine τB, we took advantage of the known energy-dependent properties of carrier-mediated nuclear transport (11); ATP-depleting conditions lead to the nuclear accumulation of Impα bound to its interacting partners (28). Indeed, in EGFP-Impα transfected cells (either alone or in cotransfection with NLS-mCherry), ATP depletion rapidly induced nuclear trapping of EGFP-Impα (Fig. 5C, left panel). Frequently, a residual signal from free NLS-mCherry could be detected in the cytoplasm owing to a large excess of this protein compared with EGFP-Impα (data not shown).
We used this assay to concentrate the NLS-Impα complex in the nucleoplasm. Lifetime decays from energy-depleted nuclei could be well fitted by a monoexponential function (Fig. 5D). We obtained τB = 2.19 ± 0.04 ns (mean ± S.D. for n = 11 cells; Table 2), a value significantly smaller than τF, indicating the impact of the FRET caused by the formation of the binding complex between EGFP-Impα and NLS-mCherry. Experimental τB dispersion was quite similar to that observed for τF (Fig. 5D). As a control, we verified that the energy-depleting treatment did not alter the EGFP lifetime in cells expressing the donor only (data not shown). The average τB value corresponds to a FRET efficiency of E = 1 − τB/τF = 0.15. Given the steric hindrance of the complex, this value appears fully consistent with the recently reported FRET efficiency value of 0.25 for a linked EGFP-mCherry pair (29).
Finally, we measured donor lifetime in cells coexpressing EGFP-Impα and NLS-mCherry in physiological conditions. Two exponential components (Equation 2) yielded a satisfactory fitting of the fluorescence decay curves consistently with the presence of free and bound complexes. As a control, we verified that cells coexpressing EGFP-Impα and untagged mCherry showed an absence of FRET (data not shown). In this case, lifetime decays were well fitted by a monoexponential function with fluorescence lifetime 2.55 ± 0.03 ns (mean ± S.D. for n = 6 cells), a value consistent with τF that measured in the absence of the acceptor (Table 2).
According to our procedure, we set the lifetimes of the two components to the values found for the donor alone (τF = 2.57 ns) and the complex (τB = 2.19 ns) and used the corresponding fractional populations (XF and XB) as fitting parameters. Fig. 6A highlights the nonhomogeneous spatial distribution of XB, i.e. of the NLS-Impα interaction in living cells. FRET occurs preferentially in the cytoplasm (XB ≈ 0.32 in the top cell in Fig. 6) then in the nucleus (XB ≈ 0.19 in the nucleus of the same cell), consistently with the accepted nuclear import mechanism (NLS-Impα complex formation in the cytoplasm, complex dissociation in the nucleus (30)). This behavior is also in line with the difference in mobility between compartments of NLS-EGFP (reduced mobility in the cytoplasm with respect to the nucleus) that we recently reported by FRAP analysis (22). Finally, we can correlate XB with the relative concentration of reactants in the cell cytoplasm (acceptor/donor concentration ratio; A/D); as shown in Fig. 6B, the fractional population of cytoplasmic interacting molecules saturates at a high A/D, as expected for a binding equilibrium relevant to the NLS-Impα interaction.
FIGURE 6.

Quantitative analysis of NLS-Impα binding. A, intensity image (left) and XB map (right) for a cell coexpressing EGFP-Impα and NLS-mCherry in physiological conditions (biexponential fitting with τB set to 2.19 ns and τF to 2.57 ns). B, XB values plotted against the ratio between acceptor and donor absolute concentrations (A/D): the fractional population of interacting molecules in the cytoplasm saturates at a high A/D ratio. Each point in the plot represents a single cell measurement. (The red point indicates the cell indicated by an arrow in A.)
Calculation of NLS-Impα Effective Dissociation Constant (KD*) from FLIM Data
Lifetime amplitudes XF and XB are proportional to the molar fraction of unbound and bound EGFP-Impα molecules; therefore, the effective dissociation constant of the single binding equilibrium (Scheme 1) can be written as,
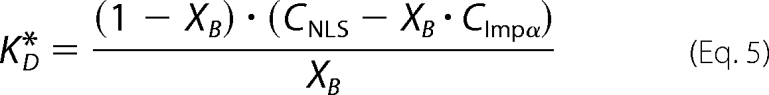 |
where CNLS and CImpα were determined thanks to our calibration system. Not surprisingly, given the multicomponent character of the complex assembly around the cargo, we found a KD* value that varies with Impα concentration and saturates at high concentration. Indeed, different Impα expression levels can modify the stoichiometry relationship with its partner Impβ, which is known to play an active role in the binding reaction with NLS (7).
Two ranges of protein concentration are of interest. At low EGFP-Impα concentration close to the endogenous value (1 μm) (25), we obtained KD* = 22 ± 8 μm (Table 3), similarly to the value derived by FRAP. This KD* value provides an estimate of the actual binding constant in a living cell. On the contrary, at high EGFP-Impα expression levels (>10 μm), endogenous Impβ can be considered negligible compared with EGFP-Impα (see “Discussion”). Here, we obtained a higher value for the effective dissociation constant (KD* = 160 ± 25 μm, Table 3). We believe this value provides the binding constant of direct NLS-Impα recognition independent of Impβ intervention.
TABLE 3.
Thermodynamic parameters derived by FLIM
| KD* | |
|---|---|
| μm | |
| EGFP-Impα | |
| ∼1 μm | 22 ± 8 |
| >10 μm | 160 ± 26 |
DISCUSSION
The thorough understanding of any signal-dependent nuclear import mechanism requires a quantitative analysis of both thermodynamic and kinetic aspects of the phenomenon. Concerning the first issue, several in vitro analyses of Impα/Impβ-mediated nuclear import consistently reported high binding affinities between the purified molecular components of the system (i.e. nanomolar dissociation constants for the NLS-Impα interaction) (7, 10, 16, 18). A recent study on nuclear import kinetics in living yeast cells, however, reported no saturation of import rates despite NLS cargoes being >20-fold more abundant than their carriers (17). These authors reported nanomolar in vitro NLS-carrier dissociation constants and underlined the discrepancy between the measured affinity and the observed nuclear import saturability.
We investigated these controversial results by studying both thermodynamics and kinetics of nuclear import in living cells. Previous studies were limited in their ability to quantitatively study nucleocytoplasmic transport by two factors: the lack of a method to accurately calculate import rates in single living cells and the inability to quantify the concentration of key players in the import reactions in those cells.
We first addressed these issues by a combination of FRAP-based transport analysis, confocal imaging, and concentration-calibration measurements. We obtained nuclear import rates as a function of cytoplasmic cargo concentration (Fig. 3). Our FRAP data were analyzed within a model for nucleocytoplasmic exchange that we developed (see supplemental equations 1–19) and yielded the effective NLS-Impα affinity constant in living cells (KD* = 16 ± 7 μm). This value confirms in a quantitative fashion the inconsistency between in vitro and in vivo observations first reported by Timney et al. (17).
To obtain an alternative direct measurement of NLS-Impα binding properties, we introduced a quantitative FLIM-based approach to the study of protein-protein interactions in living cells. In detail, EGFP-tagged Impα and NLS-tagged mCherry were coexpressed in cells, and their interaction was monitored by FLIM. To our knowledge, this is the first assay addressing NLS-Impα binding in a living cell. As expected, FRET was detected only in cells co-transfected with EGFP-Impα and NLS-mCherry, and we performed a quantitative analysis of this interaction. To this end, we first separately determined the characteristic lifetimes of isolated EGFP-Impα (τF) and of the NLS-mCherry·EGFP-Impα complex (τB). This allowed us to measure the molar fraction of unbound and bound EGFP-Impα (XF and XB, respectively) in cells expressing both EGFP-Impα and NLS-mCherry. By combining FLIM measurements with the calibration of reactant intracellular concentration, we were able to analyze XB values as a function of A/D (Fig. 6). The XB versus A/D curve is evidence of the association/dissociation equilibrium between NLS and Impα in a living cell.
Finally, by means of the derived parameters, we calculated the effective equilibrium constant (KD*) for NLS-Impα interaction (Equation 5). At EGFP-Impα concentration close to the endogenous expression of Impα (1–3 μm), we obtained a mean NLS-Impα effective affinity KD* = 22 ± 8 μm, consistent with the value estimated by FRAP (16 ± 8 μm). The equivalence of the two independently measured constants suggests that EGFP-tagging to Impα (FLIM assay) does not significantly perturb Impα physiological activity and binding affinity to its respective NLS ligand (sampled in FRAP assay). Note that at these expression levels, one must take into account the role of endogenous Impβ in promoting the formation of the NLS·Impα complex. We believe that this KD* value provides insight into the autoinhibitory model that identifies Impβ as a regulator of NLS-Impα binding affinity through its direct interaction with the IBB domain of Impα (7, 10, 16, 18).
On the other hand, at higher EGFP-Impα expression levels (above 10–15 μm), we found much larger KD* values that we believe characterize the unmediated NLS-Impα reaction because the endogenous Impβ concentration (reported estimate of ∼1–3 μm) (31) is here negligible compared with that of expressed Impα. Hence, FLIM measurements at high EGFP-Impα expression levels can mainly probe the thermodynamic behavior of the autoinhibited Impα receptor. According to this picture, a lower bound for the free energy change of Impα autoinhibition can be derived from the two measured dissociation constants: ΔG = −kT ln(KD*off/KD*on) (Fig. 7). We obtain ΔG ∼ 1.5 kcal/mol, in good agreement with the estimate previously derived on the basis of in vitro measurements (18).
FIGURE 7.

An estimate for Impα autoinhibition energy in living cells. A, the FRAP assay (where endogenous Impα and Impβ are at stoichiometric ratio) probes the average transport complex assembly in physiological conditions. Thus, we assume that the dissociation constant derived by FRAP (here named KD*on) corresponds to NLS binding to the noninhibited form of Impα, although the formation of the transport complex could be heterogeneously distributed within the cell (B). On the contrary, the FLIM method applied to high EGFP-Impα concentrations (>10 μm) yields the equilibrium constant (KD*off) corresponding to NLS binding to the autoinhibited form of Impα (endogenous Impβ here is negligible) (31). The combination of these two measurements yields the first estimate of IBB-mediated Impα autoinhibition energy in a living cell (ΔG = 1.5 kcal/mol).
Our kinetic and thermodynamic analyses of nuclear import independently and consistently show effective affinity values between NLS and Impα in the micromolar range, in contrast with the reported in vitro nanomolar affinities. Furthermore, in light of the measured concentration values of the two players in the cell, our results show that subsaturation of Impα with a single NLS moiety is characteristic of physiological conditions. This somewhat unexpected observation can be explained by considering the impact of the complex environment within a living cell on the NLS-Impα interaction. There are several nonexclusive possibilities that can lead to competing phenomena. (i) The highly charged NLS sequence is likely to interact with cytosolic moieties nonspecifically. Timney et al. demonstrated that bacterial cytoplasmic extracts, free from any natural NLS, effectively compete with NLS·karyopherin complex formation in yeast Saccharomyces cerevisiae (17). Also, we recently found that NLS-EGFP displays a cytoplasmic mobility significantly lower than EGFP alone (22), an effect not explained by the marginal increase of molecular weight brought by the NLS sequence but rather suggesting the presence of larger complexes. (ii) In living cells, NLS-EGFP cargoes are competing with other endogenous NLS moieties for Impα, thus reducing the ability of NLS-EGFP to saturate the import machinery. Impα is actually expected to have hundreds of different cargoes competing for binding at possibly micromolar overall concentration (15). (iii) Impα is strongly autoinhibited by its own IBB domain if the association with Impβ does not take place. Impβ has a well known nonuniform distribution in the cell, being very scarce far from the nuclear envelope, where it exerts its transport action. Hence, the amount of Impα actually available for efficient NLS-binding will be variable throughout the cell. Affinity measurements, however, represent an average over all the cytoplasm volume and cannot take into account this heterogeneity. We stress that the observed micromolar range of NLS-Impα affinity is not an effect of the fusion of EGFP to the NLS. In fact, several in vitro studies using the same EGFP-tagging system reported NLS-Impα affinities in the nanomolar range (7, 16, 18). Furthermore, Timney et al. observed nanomolar affinity values between NLS-EGFP and import carriers in vitro but not the expected saturation of import rates in vivo (17). These reports highlight the same controversy addressed here. We argue that the complex intracellular environment is responsible for the measured affinity values.
The binding competition with other intracellular moieties or the heterogeneity of binding affinity has significant implications, as it may represent a way by which the cell controls the intricate mechanisms of protein segregation between compartments. We believe that these effects always need to be addressed in in vivo studies because the presence of large numbers of interacting moieties may limit or regulate drastically binding processes at intracellular level.
Acknowledgments
We thank Dr. Yoshihiro Yoneda for kindly making available the plasmid encoding for EGFP-Impα. We are grateful to Dr. Laura Marchetti for kindly providing the plasmid encoding for mCherry. We also thank Dr. Patrizia Lavia for stimulating discussions.
This work was partially supported by the Italian Ministry for University and Research under the framework of “Fondo per gli Investimenti della Ricerca di Base” Project RBLA03ER38.

The on-line version of this article (available at http://www.jbc.org) contains supplemental data, Equations 1–19, and additional references.
- NPC
- nuclear pore complex
- NLS
- nuclear localization signal
- IBB
- importin β-binding domain
- FRAP
- fluorescence recovery after photobleaching
- FLIM
- fluorescence lifetime imaging microscopy
- EGFP
- enhanced green fluorescent protein
- A/D
- acceptor/donor concentration ratio
- Imp
- importin
- FRET
- Förster resonance energy transfer
- CHO
- Chinese hamster ovary
- EBFP
- enhanced blue fluorescent protein.
REFERENCES
- 1.Paine P. L., Moore L. C., Horowitz S. B. (1975) Nature 254, 109–114 [DOI] [PubMed] [Google Scholar]
- 2.Kalderon D., Roberts B. L., Richardson W. D., Smith A. E. (1984) Cell 39, 499–509 [DOI] [PubMed] [Google Scholar]
- 3.Robbins J., Dilworth S. M., Laskey R. A., Dingwall C. (1991) Cell 64, 615–623 [DOI] [PubMed] [Google Scholar]
- 4.Görlich D., Kutay U. (1999) Annu. Rev. Cell Dev. Biol. 15, 607–660 [DOI] [PubMed] [Google Scholar]
- 5.Conti E., Uy M., Leighton L., Blobel G., Kuriyan J. (1998) Cell 94, 193–204 [DOI] [PubMed] [Google Scholar]
- 6.Kobe B. (1999) Nat. Struct. Biol. 6, 388–397 [DOI] [PubMed] [Google Scholar]
- 7.Fanara P., Hodel M. R., Corbett A. H., Hodel A. E. (2000) J. Biol. Chem. 275, 21218–21223 [DOI] [PubMed] [Google Scholar]
- 8.Bayliss R., Littlewood T., Stewart M. (2000) Cell 102, 99–108 [DOI] [PubMed] [Google Scholar]
- 9.Görlich D., Panté N., Kutay U., Aebi U., Bischoff F. R. (1996) EMBO J. 15, 5584–5594 [PMC free article] [PubMed] [Google Scholar]
- 10.Catimel B., Teh T., Fontes M. R., Jennings I. G., Jans D. A., Howlett G. J., Nice E. C., Kobe B. (2001) J. Biol. Chem. 276, 34189–34198 [DOI] [PubMed] [Google Scholar]
- 11.Kutay U., Bischoff F. R., Kostka S., Kraft R., Görlich D. (1997) Cell 90, 1061–1071 [DOI] [PubMed] [Google Scholar]
- 12.Bischoff F. R., Görlich D. (1997) FEBS Lett. 419, 249–254 [DOI] [PubMed] [Google Scholar]
- 13.Floer M., Blobel G., Rexach M. (1997) J. Biol. Chem. 272, 19538–19546 [DOI] [PubMed] [Google Scholar]
- 14.Izaurralde E., Kutay U., von Kobbe C., Mattaj I. W., Görlich D. (1997) EMBO J. 16, 6535–6547 [DOI] [PMC free article] [PubMed] [Google Scholar]
- 15.Riddick G., Macara I. G. (2005) J. Cell Biol. 168, 1027–1038 [DOI] [PMC free article] [PubMed] [Google Scholar]
- 16.Harreman M. T., Hodel M. R., Fanara P., Hodel A. E., Corbett A. H. (2003) J. Biol. Chem. 278, 5854–5863 [DOI] [PubMed] [Google Scholar]
- 17.Timney B. L., Tetenbaum-Novatt J., Agate D. S., Williams R., Zhang W., Chait B. T., Rout M. P. (2006) J. Cell Biol. 175, 579–593 [DOI] [PMC free article] [PubMed] [Google Scholar]
- 18.Hodel M. R., Corbett A. H., Hodel A. E. (2001) J. Biol. Chem. 276, 1317–1325 [DOI] [PubMed] [Google Scholar]
- 19.Hu W., Jans D. A. (1999) J. Biol. Chem. 274, 15820–15827 [DOI] [PubMed] [Google Scholar]
- 20.Cardarelli F., Serresi M., Bizzarri R., Giacca M., Beltram F. (2007) Mol. Ther. 15, 1313–1322 [DOI] [PubMed] [Google Scholar]
- 21.Miyamoto Y., Hieda M., Harreman M. T., Fukumoto M., Saiwaki T., Hodel A. E., Corbett A. H., Yoneda Y. (2002) EMBO J. 21, 5833–5842 [DOI] [PMC free article] [PubMed] [Google Scholar]
- 22.Cardarelli F., Serresi M., Bizzarri R., Beltram F. (2008) Traffic 9, 528–539 [DOI] [PubMed] [Google Scholar]
- 23.Ciciarello M., Mangiacasale R., Thibier C., Guarguaglini G., Marchetti E., Di Fiore B., Lavia P. (2004) J. Cell Sci. 117, 6511–6522 [DOI] [PubMed] [Google Scholar]
- 24.Brown C. M., Dalal R. B., Hebert B., Digman M. A., Horwitz A. R., Gratton E. (2008) J. Microsc. 229, 78–91 [DOI] [PMC free article] [PubMed] [Google Scholar]
- 25.Percipalle P., Butler P. J., Finch J. T., Jans D. A., Rhodes D. (1999) J. Mol. Biol. 292, 263–273 [DOI] [PubMed] [Google Scholar]
- 26.Shaner N. C., Campbell R. E., Steinbach P. A., Giepmans B. N., Palmer A. E., Tsien R. Y. (2004) Nat. Biotechnol. 22, 1567–1572 [DOI] [PubMed] [Google Scholar]
- 27.Albertazzi L., Arosio D., Marchetti L., Ricci F., Beltram F. (2009) Photochem. Photobiol. 85, 287–297 [DOI] [PubMed] [Google Scholar]
- 28.Schwoebel E. D., Ho T. H., Moore M. S. (2002) J. Cell Biol. 157, 963–974 [DOI] [PMC free article] [PubMed] [Google Scholar]
- 29.Tramier M., Zahid M., Mevel J. C., Masse M. J., Coppey-Moisan M. (2006) Microsc. Res. Tech. 69, 933–939 [DOI] [PubMed] [Google Scholar]
- 30.Görlich D., Mattaj I. W. (1996) Science 271, 1513–1518 [DOI] [PubMed] [Google Scholar]
- 31.Ribbeck K., Lipowsky G., Kent H. M., Stewart M., Görlich D. (1998) EMBO J. 17, 6587–6598 [DOI] [PMC free article] [PubMed] [Google Scholar]