

Abstract
Bicelles of various lipid/detergent ratios are commonly used in nuclear magnetic resonance (NMR) studies of membrane-associated molecules without the need to freeze the sample. While a decrease in the size (defined at a low temperature or by the q value) of a bicelle decreases its overall order parameter, the variation of lipid dynamics with a change in the lipid/detergent ratio is unknown. In this study, we report a thorough atomistic level analysis on the variation of lipid dynamics with the size and hydration level of bicelles composed of a phospholipid, 1,2-dimyristoyl-sn-glycero-3-phosphocholine (DMPC), and a detergent, 1,2-dihexanoyl-sn-glycero-3-phosphocholine (DHPC). Two-dimensional (2D) separated-local-field NMR experiments were performed on magnetically aligned bicelles to measure 1H-13C dipolar couplings, which were used to determine order parameters at various (head-group, glycerol, and acyl chain) regions of lipids in the bilayer. From our analysis, we uncover the extreme sensitivity of the glycerol region to the motion of the bicelle, which can be attributed to the effect of viscosity because of an extensive network of hydrogen bonds. As such, the water-membrane interface region exhibits the highest order parameter values among all three regions of a lipid molecule. Our experimental results demonstrate that the laboratory-frame 2D proton-detected-local-field pulse sequence is well-suited for the accurate measurement of motionally averaged (or long-range) weak and multiple 1H-13C dipolar couplings associated with a single carbon site at the natural abundance of 13C nuclei.
Introduction
Bicelles are rapidly becoming an important class of biomembrane mimics used in the high-resolution structural studies of membrane proteins.1-4 Bicelles are a fascinating category of versatile and robust lipid assemblies that bridge the gap between micelles and lipid vesicles. One of the often-exploited features of bicelles is their propensity to spontaneously align in the presence of an external magnetic field.5-7 This macroscopic alignment enables one to acquire high-resolution solid-state nuclear magnetic resonance (NMR) spectra while retaining various essential anisotropic interactions, such as dipolar coupling, chemical-shift anisotropy (CSA), and quadrupole coupling, which are rich in dynamic and structural information.8-10 The easy and quick preparation of bicelles, in conjunction with their excellent filling factor in a NMR RF coil for better sensitivity, enable one to address some of the complex problems related to biological membranes at atomic-level resolution. The magnetic alignment of bicelles can be maintained over a reasonable range of physiological conditions, making bicelles an attractive class of model membranes for studies of structure, dynamics, molecular imaging, and functional properties of a variety of exciting biological systems, such as antimicrobial peptides, amyloid peptides, toxins, fusion peptides, membrane proteins, and membrane-binding pharmaceutical compounds.10-13
While bicelles display many features comparable to a lipid bilayer, they differ in several aspects, such as compositions and morphology. Bicelles are primarily composed of a mixture of long- and short-chain lipids, such as 1,2-dimyristoyl-sn-glycero-3-phosphocholine (DMPC) and 1,2-dihexanoyl-sn-glycero-3-phosphocholine (DHPC) (Figure 1). They exhibit a wide spectrum of fascinating yet controversial morphologies, ranging from perforated lamellae to giant worm-like micelles, as dictated by sample conditions, such as the q ratio (q = [DMPC]/[DHPC]), temperature, and lipid composition.14-18 Over the years, the morphology of bicelles has been exhaustively investigated using 2H and 31P NMR spectroscopy.6,19-21 Despite the fact that bicelles have become an excellent platform for functional reconstitution of membrane proteins, a complete mapping of lipid dynamics that correlates all three regions (head-group, glycerol, and acyl chains) of bicelles as a function of the q ratio, temperature, and hydration remains to be elucidated. These parameters are essential for formulating a proper bilayer environment for relevant biological studies of membrane proteins. In previous studies, the effect of hydration has shown to be highly critical in maintaining bilayer fluidity, which facilitates proper functioning of membrane proteins.22,23 For example, many signaling proteins rely on the membrane fluidity for signal transduction and domain formation in the plasma membrane.22 In addition, q ratios and temperatures can strongly influence the dynamics of lipids in bicelles and may alter their interactions with other membrane constituents. Therefore, to effectively use bicelles for NMR structural studies, an optimization of these parameters is essential and an understanding of how the three lipid regions are correlated with each other as a function of these parameters is an important first step in formulating a suitable bilayer environment for biophysical applications.17,24-27
Figure 1.

Schematic representations of lamellar phase bicelles. (A) Schematic representation of the perforated lamellae morphology of magnetically aligned DMPC/DHPC bicelles consisting of both planar and high-curvature regions. DMPC and DHPC molecules are represented by the yellow and red colors, respectively. (B) Schematic representation of DHPC undergoing fast exchange between the planar and highly curved toroidal pore regions, as indicated by the arrows.
Separate-local-field (SLF) experiments, such as polarization inversion spin exchange at the magic angle (PISEMA), broad-band PISEMA, heteronuclear isotropic mixing leading to spin exchange via the local field (HIMSELF), or heteronuclear rotating-frame leading to spin exchange via the local field (HERSELF), and SAMMY, which correlate heteronuclear dipolar couplings with chemical shifts while suppressing the dominant dipolar couplings among protons, are employed in solid-state NMR studies of membrane proteins embedded in aligned lipid bilayers.9,10,28,29 Experimentally measured heteronuclear dipolar couplings can provide atomic-level detailed information regarding segmental mobility and orientation of molecules.9,10,30-32 The order parameter gives a measure of the mobility of a chemical bond in a molecule with respect to a molecular frame and can be determined from the observed dipolar coupling 〈Dij〉 values using the following equation:
| (1) |
| (2) |
Dij is the static dipolar coupling between nuclei i and j, Sij is an order parameter (0 ≤ Sij ≤ 1), and θ is the angle between the i-j internuclear vector and the external magnetic field axis. While most SLF pulse sequences can be used to measure dipolar couplings on aligned samples, rotating-frame pulse sequences, such as HIMSELF, have been shown to provide superior resolution in the heteronuclear dipolar coupling dimension of a 2D SLF spectrum and, hence, commonly used in the structural studies of membrane proteins.11,12 On the other hand, these rotating-frame SLF sequences provide higher resolution by suppressing weak heteronuclear dipolar couplings, which are essential for the present study on bicelles. To overcome this problem, a variation of a SLF pulse sequence called proton-evolved-local-field [PELF, also called as proton-detected local field (PDLF), but protons are not detected in the present study]31 experiment was successfully applied in a high-resolution NMR study of magnetically aligned bicelles and provided a comprehensive mapping of lipid dynamics at each carbon position, from the head-group to the acyl chains, in response to various ligands.9,10 It has been shown that this 2D PELF technique is capable of providing high-resolution 13C-1H dipolar coupling spectral lines at the natural abundance of 13C nuclei and also enables the measurement of multiple couplings associated with a single carbon site.10 Therefore, we chose to use this PELF technique for the present study to accomplish a complete mapping of lipid dynamics as a function of the q ratio, hydration, and temperature of bicelles. Unlike the requirement of deuterated lipids for deuterium NMR studies, PELF measurement can be carried out on normal lipids with the natural abundance of 13C and can also be used to measure long-range C-H dipolar couplings.10,28
Experimental Section
Materials
DMPC and DHPC were purchased from Avanti Polar Lipids, Alabaster, AL, and used without further purification. All other biochemicals and reagents used in this study were purchased from Sigma-Aldrich, St. Louis, MO.
Preparation of Bicelles
Bicelles were prepared with a desired amount of lipid in buffered D2O. The ratio q was calculated as moles of DMPC per mole of DHPC. A typical preparation involved dissolving the desired quantities of DMPC and DHPC in buffered D2O solution (10 mM Tris at pH 7.4 and 150 mM NaCl), followed by a series of cycles of freezing, thawing, and gentle vortexing until a clear solution, was obtained. The solution was then stored at 4 °C for up to 24 h before use.
NMR Spectroscopy
NMR experiments were carried out on a Chemagnetics/Varian Infinity 400 MHz solid-state NMR spectrometer using a 5 mm double-resonance magic-angle spinning probe under static sample conditions. About 150–200 mg of bicelles was loaded in a 5 mm NMR glass tube of 4 cm length, and the tube was closed tightly with a Teflon tape and a cap. The sample was then equilibrated for about 30 min in the magnet at the desired temperature prior to signal acquisitions. 31P chemical-shift spectra were recorded using the Hahn echo (90°-τ-180°-τ acquire) experiment with a 90 pulse length of 5 μs, an echo delay of 100 μs, and under a 15–25 kHz continuous-wave proton decoupling. A total of 32 transients were sufficient to acquire reasonable signal-to-noise ratio 31P chemical-shift spectra of well-aligned samples, while about 64 scans were acquired for relatively poorly aligned samples. The chemical-shift scale was referenced by setting the 31P chemical-shift peak from phosphoric acid (H3PO4) to 0 ppm at 37 °C. A ramped-cross-polarization (ramp-CP) sequence with a contact time of 5 ms was used to record the 1D 13C chemical-shift spectra under proton decoupling using various decoupling sequences for a comparative study, while the flip-flop spectroscopy (FLOPSY)-848 multiple pulse sequence was used in our experiments because it provided the best resolution. The 2D PELF spectra were obtained using 64 t1 experiments, 64 scans, a 5 s recycling delay, and a 20 kHz 1H decoupling.
Results
31P Chemical-Shift Spectra of Magnetically Aligned Bicelles as a Function of the q Ratio
31P NMR spectroscopy is a convenient and reliable tool commonly used to assess the quality of bicelles alignment and the angle between the bilayer normal and the applied magnetic field.20 Parts A and C of Figure 2 show a series of 31P chemical-shift spectra as a function of the hydration and q ratio obtained at 35 °C, and Figure 2B shows a series of 31P spectra obtained as a function of the temperature of the sample. In these spectra, two well-resolved resonances corresponding to DMPC and DHPC were observed. These spectra are typical of magnetically aligned bicelles, as shown in previous studies.6,20 The low- and high-field peaks are assigned to DMPC and DHPC, respectively. The chemical-shift frequency of the DMPC peak corresponds to the perpendicular shoulder of the 31P CSA powder pattern of DMPC in the liquid-crystalline phase, indicating that magnetic alignment of bicelles was indeed achieved. The difference between the chemical-shift values of DHPC and DMPC is the direct consequence of the difference in their residual CSA spans. DHPC molecules in bicelles are highly mobile compared to DMPC; DHPC molecules undergo a fast exchange between the planar regions and the toroidal-pore regions of bicelles, whereas the DMPC molecules are confined to the planar region of the bilayer as shown in Figure 1. This mobility scales down the CSA of DHPC, leading to a smaller absolute chemical-shift value, as seen in Figure 2.
Figure 2.

31P chemical-shift spectra of magnetically aligned bicelles for various (A) hydration levels with q = 3.5 at 37 °C, (B) temperatures with q = 3.5 and 77% hydration, and (C) q ratios at 37 °C with 77% hydration. 31P spectrum of partially aligned bicelles is given at the bottom of A for 40% hydration (spectra of bicelles with 50 and 40% hydration levels are similar), and that of unaligned multilamellar vesicles (MLVs) is given at the bottom of C for 63% hydration at 37 °C. The hydration level is given in (w/v) % of water.
31P chemical shifts of both DMPC and DHPC measured as a function of the q ratio, hydration, and temperature are consistent with the results reported in previous studies. With the increasing q ratio, the observed chemical-shift frequency of DMPC progressively increased from −11.25 to −13.46 ppm, while that of DHPC increased from −5.31 to −6.79 ppm. A similar but gradual trend was observed in the chemical-shift values of DMPC and DHPC as a function of the hydration level and temperature of bicelles. The chemical-shift values of both DMPC and DHPC decrease as hydration increases and plateau for hydration levels greater than 60%. On the other hand, the 31P chemical shifts of both DMPC and DHPC increase as a function of the temperature and are consistent with previous studies. The changes in the observed 31P chemical-shift value as a function of the q ratio, temperature, and hydration are a manifestation of the scaling of the bicelles order parameter Sbicelles.6 Sanders et al. first introduced the Sbicelles order parameter as a measure of the additional local “wobbling” effect experienced by a phospholipid within the bicelle relative to a unoriented bilayer.6 The Sbicelles parameter is calculated from the 31P residual CSA using the following equation:
| (3) |
where δobs is the observed 31P chemical-shift frequency, δiso is the isotropic chemical shift, and δ90 is the perpendicular edge frequency of the 31P CSA powder pattern spectrum of unaligned DMPC in the liquid-crystalline phase. Sbicelles values of bicelles are summarized in Tables 1-3.
Table 1. Sbicelle Order Parameter of DMPC and DHPC Molecules Determined from NMR Experiments on Magnetically Aligned Bicelles at Different Temperatures.
| temperatures (°C) |
δDMPC | δDHPC | ||
|---|---|---|---|---|
| 30 | −12.5 | −4.8 | 0.83 | 0.32 |
| 37 | −12.7 | −5.5 | 0.85 | 0.36 |
| 45 | −13.2 | −7.5 | 0.88 | 0.5 |
Table 3. Sbicelle Order Parameter of DMPC and DHPC Molecules Determined from NMR Experiments on Magnetically Aligned Bicelles of Different q Ratios.
| q ratio | δDMPC | δDHPC | ||
|---|---|---|---|---|
| 2.7 | −11.2 | −5.3 | 0.75 | 0.35 |
| 3.5 | −12.2 | −5.3 | 0.82 | 0.36 |
| 4.3 | −13.4 | −6.7 | 0.89 | 0.45 |
31P spectra at relatively low hydration levels show significant deviation from the typical 31P NMR spectrum of magnetically aligned bicelles. Poor alignment of bicelles was observed at 50 and 40% hydration levels. In these samples, a broad powder pattern, such as 31P line shape, was observed, indicating the presence of unaligned lipids. Under these conditions, bicelles most likely exhibit an ellipsoidal morphology with a dispersion of 31P chemical shifts, which is commonly observed for bicelles at high q ratios.21,33 The lack of alignment at these hydration levels can be attributed to numerous factors; however, the most likely factor under these circumstances is the sample viscosity. The kinetic of bicelles alignment is a function of two intrinsic parameters: the size of aggregates and the sample viscosity. Because of low hydration levels for these samples, they exhibit the highest viscosity, preventing them from proper magnetic alignment and leading to a mosaic spread of bicelle orientations. Therefore, a broad 31P chemical-shift spectrum was observed for these samples.
2D PELF Spectra of Magnetically Aligned Bicelles
A2D PELF experiment was used to measure 13C-1H dipolar couplings from magnetically aligned bicelles. A typical 2D PELF spectrum that correlates 13C-1H dipolar couplings with 13C chemical shifts is shown in Figure 3A for bicelles with q = 3.5 at 35 °C. Each representative 13C-1H dipolar-coupling slice corresponds to a specific carbon site of a phospholipid in bicelles. The 2D spectrum exhibits well-resolved doublets in the indirect frequency dimension, corresponding to the combined dipolar and scalar couplings between 13C and 1H spins. A1D 13C chemical-shift spectrum of bicelles is also shown; a significant overlap of resonances, especially for the C4-C11 region of acyl chains, was observed. Interestingly, these resonances are resolved in the 2D spectrum. Because experimental conditions were optimized for the observation of resonances from DMPC, 13C NMR resonances from DHPC were not readily observed. In the PELF spectrum, multiplets with small splittings were observed because of interactions between 13C and remote protons.9,10
Figure 3.

(A) 13C chemical-shift spectrum (left), a 2D PELF spectrum (middle) that correlates the 13C chemical shifts (vertical dimension) and 1H-13C dipolar coupling (horizontal dimension), and individual 1H-13C dipolar coupling slices (right) of q = 3.5 magnetically aligned bicelles with 77% hydration level [given in (w/v) % of water] at 37 °C. The details on the pulse sequence used in these experiments can be found elsewhere.8 The acquisition parameters used to obtain these spectra are 64 scans, 200 t1 points with an increment time of 384 μs, a recycle delay of 5 s, a 31 kHz 1H RF field strength during t1, and a 3.0 ms CP contact time. (B) 2D PELF spectrum showing distinct doublets for g2, Cα, and Cβ carbons because of residual 13C-31P dipolar couplings.
Interestingly, additional dipolar couplings were observed for carbons in the head-group and the glycerol moiety of lipids. A 2D 13C/1H heteronuclear chemical-shift correlation spectrum of bicelles is shown in Figure 3B, with resonances only from the glycerol and head-group regions displayed. The doublets observed in the spectrum are the direct consequences of the dipolar interactions between 13C-31P nuclei.6,34,35 The 13C-13P dipolar couplings were observed for carbons in these regions (that is for g1, g2, g3, Cα, and Cβ carbon sites) because they are geometrically in close proximity with the 31P nucleus of the phosphate head-group. However, for the Cγ of the choline head-group, no 13C-13P dipolar coupling was observed. This is mainly due to the large distance separation between Cγ and 31P nucleus. In general, dipolar couplings associated with the Cα and g3 carbons are the largest among all measured.
Lipid Order Parameters as a Function of the q Ratio, Hydration, and Temperature
Dipolar couplings are sensitive to the motional properties of lipids in a bilayer membrane and can provide valuable dynamic information. The order parameter of C-H bonds (SCH) in the acyl chains of DMPC can be determined from the residual 13C-1H dipolar couplings measured from 2D PELF spectra of bicelles. PELF experiments were performed on bicelles under various conditions to understand the effects of the q ratio, hydration level, and temperature. The data were processed and interpreted as discussed above. The SCH values are given in Figure 4 for all carbon sites of DMPC in bicelles for different q ratios, hydration levels, and temperatures. Because the C-H order parameters are determined from the experimentally measured C-H dipolar coupling values, the accuracy of SCH values strongly depends upon the resolution of 2D PELF spectral lines in the C-H dipolar coupling dimension. As can be seen from the spectral slices provided in Figure 4, the lines are narrow, with the full width at half-maximum varying from ~50 Hz (119 Hz after taking the scaling factor of the BLEW-48 multiple pulse sequence in the t1 period into account) to 111 Hz (264 Hz after the inclusion of the scaling factor). Therefore, the reported SCH values are of high accuracy.
Figure 4.

Order parameter of bicelles. The order parameter profile determined from experimentally measured 1H-13C dipolar coupling values at different (A) q ratios at 37 °C with 77% hydration level [given in (w/v) % of water], (B) temperatures with q = 3.5 and 77% hydration, and (C) hydration levels with q = 3.5 at 37 °C. Selective regions of 2D PELF spectra for g3, g2, Cα, Cβ, Cγ, C3, and C13 carbons at two different temperatures of 37 °C (black) and 45 °C (red) are given in parts D-G.
Here are some common features among the plots of SCH values. The magnitude of SCH homogenously decreases along the acyl chains of lipids, reflecting an increase in the overall motions down the acyl chains, which is consistent with previous 2H NMR studies. Similarly, the head-group moiety of lipids also displayed a similar trend.19,36 Because of the rapid rotation of the methyl group, the residual dipolar coupling associated with Cγ is projected along an additional director axis of motion defined by the methyl rotor, leading to a lower SCH value for Cγ relative to that of Cα and Cβ. Interestingly, the order parameter associated with Cβ is significantly higher than that of Cα of the choline head-group. This can be attributed to a higher range of motions experienced by Cα, while the motions around the Cβ are restricted by the electrostatic interaction between the positively charged nitrogen and the negatively charged phosphate group. As such, this interaction will significantly hinder motions around the Cβ-N bond, leading to a higher order parameter, as observed for Cβ. Furthermore, the order parameters associated with glycerol carbons display a gradual decrease from positions g3 to g1. The glycerol section of a lipid bilayer is highly viscous because of an extensive network of hydrogen bonds near the water-membrane interface; this will considerably hinder the overall motions of the C-H bond at the g3 position, leading to a higher SCH value relative to that of g1, which is buried closer to the hydrophobic core of the membrane.
The dependence of SCH upon the q ratio and hydration level is gradual, but interestingly, only specific regions, in particular, near the water-membrane interface, are significantly affected. In general, the SCH values vary proportionally to both the q value and the extent of hydration, indicating an overall increase in the Sbicelles value. However, one should be cautious when examining the order parameter at a very low hydration level, for example, 40%, because of the poor alignment of the bicelles (data not included). Because of the rapid motion exhibited by the terminal methyl groups of the acyl chains and the head-group, these regions are reasonably insensitive to the additional local “wobbling” effect in bicelles, as defined by the Sbicelle value. Therefore, their SCH order parameters remain relatively constant as a function of both the q ratio and hydration level. In contrast, the region near the water-membrane interface, where an extensive network of hydrogen bonds considerably hinders motions, will be particularly sensitive to the local wobbling effect of bicelles, leading to a gradual dependence of SCH upon the q ratio. On the other hand, the dependence of SCH values upon the hydration level of bicelles is only moderate at best because all of the plots in Figure 4C virtually overlap with each other.
Interestingly, the SCH values vary differently at different regions of the bilayer as a function of the temperature of bicelles: the SCH values of carbon sites in the acyl chains uniformly decrease as the temperature increases, while SCH values in the head-group and glycerol moieties increase as the temperature increases. This could be a consequence of the dynamical difference exhibited at different regions of the lipid bilayer. The SCH values homogeneously decrease in the acyl chain region as a function of the temperature, indicating an increase in the motion of acyl chains of lipids from the additional thermal energy. In contrast, the SCH values of the head-group moiety are inversely proportional to the temperature, which can be attributed to the combined effects of water dynamics and an increase in the Sbicelles order parameter value. Representative PELF spectra for carbon positions g3, g2, Cα, Cβ, Cγ, C3, and C13 at 37 and 45 °C are shown in parts D-G of Figure 4. These spectra show a clear difference in the 13C-1H dipolar couplings at two different temperatures. In addition, the increase in the 13C chemical shift of these resonances is indicative of an increase in their overall Sbicelles order parameter as the temperature of the sample increases. The hydration shell close to the surface of the lipid bilayer is highly dynamic in nature: water molecules exchange rapidly between the bound and free states. The increase in temperature depletes this hydration shell around the bilayer because of an increase in kinetic energy, which prompts water molecules to be in the free state, leading to dehydration of the membrane surface. Therefore, this effect can increase the ordering of the head-group moiety (particularly in the glycerol region) as evident in the raise of the SCH order parameter.37-40 In addition, an increase in temperatures also increases the value of Sbicelles, as evident in numerous studies in the past. At high temperatures, the DHPC becomes miscible with DMPC, which reduces the surface area of perforations and local “wobbling” motions of the bicelle. Therefore, a higher Sbicelles value or 1H-13C dipolar coupling is observed.
Interestingly, additional heteronuclear dipolar couplings, particularly 13C-31P couplings (DCP), are observed in the glycerol and head-group regions of the bicelle. These couplings provide specific details regarding the motions and dynamics at the water-membrane interface. In general, the magnitude of DCP varies proportionally with the q ratio, as shown in Figure 5, similar to that of 13C-1H dipolar couplings observed in this study, which is a manifestation of the global Sbicelles order parameter. Furthermore, the effect of hydration has a rather complicated effect on the observed values of DCP, particularly at Cβ and g3 carbons, as shown in Figure 6.
Figure 5.
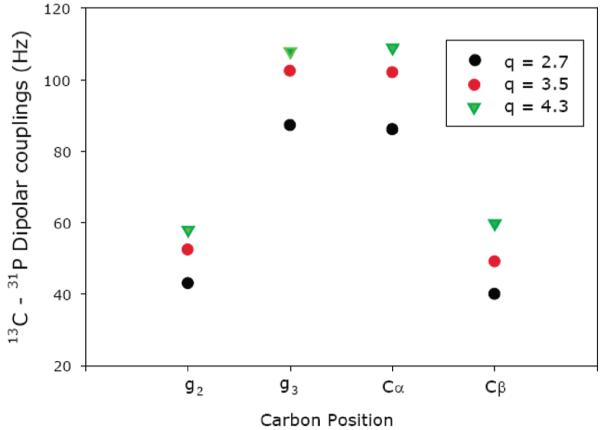
Plot of experimentally measured 13C-31P dipolar couplings from magnetically aligned bicelles at 37 °C with 77% hydration level [given in (w/v) % of water] and q ratios (black circle) 2.7, (red circle) 3.5, and (green inverted triangle) 4.3 at g2, g3, Cα, and Cβ carbons.
Figure 6.

(A) Plot of experimentally measured 13C-31P dipolar couplings as a function of the hydration level [given in (w/v) % of water] for (black circle) g2, (red circle) g3, (blue square) Cα, and (green square) Cβ carbons from bicelles with a q ratio of 3.5 at 37 °C. (B) 2D 1H/13C chemical-shift correlation spectrum that shows the dipolar couplings among 13C and 31P nuclei at 40% (red) and 70% (black) hydration level [given in (w/v) % of water]. Line broadening because of poor alignment of bicelles at 40% hydration and a significant increase in 13C-31P dipolar couplings at a higher hydration level are evident from the 2D spectrum.
In general, an increase in the hydration level reduces the ordering of bicelles, particularly in the head-group region, and is consistent with previous 2H NMR studies.40 The profound sensitivity of DCP at the Cβ and g3 carbon positions can be attributed to their local motions and dynamics. Motions at the site of Cβ are highly restricted because of the electrostatic interactions associated with the P−-N+ dipole. Therefore, any change in the ordering of this dipole will have a dramatic impact on the local dynamics around Cβ, which results in a notable change in its DCP value. Furthermore, the sensitivity of DCP at the g3 position is attributed to the ordering of water at the membrane surface. An increase in hydration reduces ordering of water at the bilayer surface and ultimately influences the local dynamics at the glycerol region, particularly near g3 because of its close proximity to the network of hydrogen bonding at the surface-membrane surface. Therefore, a change in the hydration of bicelles leads to a profound change in the value of DCP at the g3 position.
Discussion
Dynamics of lipids in bicelles are crucial in producing a native bilayer environment for in-depth biophysical studies of membrane-associated amphiphiles, in particular, membrane proteins. In previous studies, the basic dynamics of both head-group and acyl chains were extensively investigated using 2H NMR experiments. However, the intricate relationship between the dynamics at different regions of the bilayer under various sample conditions remains an issue that requires attention. In this study, we have revealed the complex influence of the q ratio, hydration level, and temperature on the motion of lipids in bicelles using both 13C-1H and 13C-31P dipolar couplings. The order parameter, which is a measure of motions, was carefully extracted from the dipolar coupling for different regions of the lipid. In general, the basic behavior of order parameters in the acyl chains as a function of the q ratio, temperature, and hydration is consistent with previous 2H NMR studies. Surprisingly, the glycerol region of the bilayer is extremely sensitive to the conditions of bicelles compared to other regions of the bilayer. Because of an extensive hydrogen-bonding network in the water--membrane interface, the motional freedom at the glycerol region is profoundly restricted, such that larger order parameters are observed in this region.
The phosphocholine head-group is highly flexible and exhibits a wide range of orientations that can be determined using 13C-1H dipolar couplings from different carbon positions, Cα, Cβ, and Cγ, along the phosphocholine moiety. For a lipid molecule in the liquid-crystalline phase undergoing a rapid anisotropic rotation about its long axis, many anisotropic interactions, such as dipolar coupling and chemical-shift anisotropy, are projected along this director axis of motion and only the motionally averaged values of these nuclear spin interactions influence the observed NMR spectrum. Interestingly, the motions of the phosphocholine moiety will have an additional averaging effect on the magnitude of nuclear spin interactions exhibited in the choline head-group. Therefore, the 13C-1H dipolar couplings associated with Cα and Cβ are motionally averaged along two different director axes: the long axis of the lipid and an axis defined by the phosphocholine moiety. For Cγ, its 13C-1H dipolar coupling is motionally averaged along an additional director axis defined by the methyl rotor. The orientation of the different director axis with respect to the external magnetic field is shown in Figure 7.
Figure 7.

Orientation of the choline head-group of DMPC is represented, by two angles φ and φ + θ, with respect to the director of the lipid (d) and the external magnetic field axis (B0). The relationship between ϕ and φ is ϕ = 90 ° − φ; ϕ is the angle between the bilayer surface and the choline lipid head-group.
The angle of the phosphocholine head-group with respect to the surface of the bilayer is summarized in Tables 4-6 for different q ratios, temperatures, and hydration levels.
Table 4. Angle ϕ (in Degrees) Calculated from Experimentally Measured C-H Dipolar Couplings at Different Carbon Sites of DMPC Head-Group in Bicelles of Different q Ratios.
| q ratio | Cα (Hz) | Cβ (Hz) | Cγ (Hz) | average angle 〈ϕ〉 |
|---|---|---|---|---|
| 2.7 | 32.1 | 28.4 | 24.8 | 28.4 |
| 3.5 | 32.7 | 29.6 | 25.8 | 29.3 |
| 4.3 | 32.1 | 28.8 | 26.1 | 29.0 |
Table 6. Angle ϕ (in Degrees) Calculated from Experimentally Measured C-H Dipolar Couplings at Different Carbon Sites of DMPC Head-Group in Bicelles of Different Hydration Levels.
| water molecules per lipid |
Cα (Hz) | Cβ (Hz) | Cγ (Hz) | average angle 〈ϕ〉 |
|---|---|---|---|---|
| 338 | 27.4 | 25.9 | 25.4 | 26.3 |
| 151 | 27.0 | 25.4 | 22.1 | 25 |
| 87 | 26.9 | 25.5 | 22.1 | 24.8 |
| 56 | 26.8 | 25.5 | 21.4 | 24.6 |
| 37 | 26.7 | 25.4 | 21.26 | 24.5 |
The average angle 〈ϕ〉 between the phosphocholine moiety with respect to the bilayer surface is ~30 ° and is consistent among the series of q ratios, indicating that changes in the observed dipolar couplings in the head-group moiety are indeed due to the Sbicelles order parameter and not because of the reorientation of the head-group. Furthermore, the values of 〈ϕ〉 that we obtained from measured dipolar couplings are consistent with observations reported in the literature.35,37,39,41 Because of the dynamic nature of the phosphocholine head-group, the value of 〈ϕ〉 is not unique, rather a collection of values is observed; however, the head-group prefers to be in close proximity to the bilayer surface because of an electrostatic interaction associated with the P−-N+ dipole. This result is consistent with the crystal structure of POPE and small-angle neutron scattering studies, where the P−-N+ dipole is seen to be approximately perpendicular to the bilayer normal.39,42 Interestingly, the effect of temperature has a minimal impact on lipid head-group orientations. The value of 〈ϕ〉, defined as the angle between the choline lipid head-group and the bilayer surface (Figure 7), does not significantly vary with temperature. Therefore, the increase in the observed dipolar couplings in Cα and Cβ positions is a consequence of an increase in the Sbicelles order parameter. Similar trends are observed for the effect of hydration on the head-group moiety. The values obtained for 〈ϕ〉 are constant among various hydration levels, indicating the changes in the dipolar couplings are due to an increase in the ordering of the head-group region. At the lowest hydration level of 50%, which corresponds to 37 water molecules per lipid, the surface of the bilayer still remains properly hydrated and well above the critical number of 25 water molecules per lipid; in fact, only when the number of water molecules per lipid is <18 should one expects a reorientation of the head-group moiety.40 Therefore, at these hydration levels, it is not surprising that the orientation of the lipid head-group remains relatively constant.
Both the q ratio and the hydration level exert similar effects on the dynamics of bicelles: they mainly influence the global Sbicelles order parameter. This order parameter influences each region of the bilayer equally; most changes observed in the dipolar coupling as a function of either the q ratio or hydration level can be attributed to a change in this parameter. In contrast, the influence of the temperature has a differential effect on the dynamics of lipids at different regions of the bilayer. The SCH order parameter scales inversely with the temperature as motions in the acyl chains increase. The increase in the thermal kinetic energy translates to a higher degree of overall motion in the acyl chains, leading to a significant decrease in the order parameter. Interestingly, the head-group and glycerol regions respond slightly different from that of acyl chains for a change in the temperature. The increase in temperature causes an increase in ordering of these regions and can be attributed to the dehydration effects with increasing temperature. It would be interesting to use the measured C-H dipolar couplings and the C-H order parameters to probe the dehydration induced by ligand binding to membrane bilayers. For example, such measurements will be useful in understanding the membrane fusogenic activities by viral peptides43 and also the membrane-disrupting mechanisms by antimicrobial peptides44 or amyloid peptides.45
Knowledge on the variation of lipid dynamics in bicelles is essential in the investigation of ligand-induced structural and dynamical disorders in membranes. For example, bicelles are valuable in probing the mechanism of membrane disruption by antimicrobial peptides, toxins, amyloid peptides, fusion peptides, dendrimers, and pharmaceutical compounds.9,10,46-48 In such studies, changes in the order at each carbon site have been shown to provide valuable insights into various important aspects of ligand-membrane interactions. The depth of insertion, disorder/order induced by ligands near the lipid head-group or hydrophobic core regions of lipid bilayers, tilt of the lipid head-group, phase changes, and toroidal-pore formation are commonly characterized using order parameters measured from NMR experiments on bicelles. In such analysis, caution must be exercised because dehydration effects and detergent-like behavior of peptides can be misinterpreted for a change in the size of the bicellar aggregates. The unique way of preparing well-defined toroidal pores in bicelles is highly valuable to understand the mechanism of membrane disruption by a variety of systems, such as antimicrobial and amyloidogenic peptides.
The increasing popularity of bicelles in NMR studies of membrane proteins necessitates a better understanding of lipid dynamics in bicelles. It is now possible to obtain a high-resolution solid-state NMR spectrum of a membrane protein embedded in magnetically aligned bicelles. SLF experiments, such as PISEMA or HIMSELF, require a fine balance between motions of a protein in the membrane and the various anisotropic nuclear interactions. Therefore, one of the avenues to fine tune this delicate balance is through manipulating the experimental conditions of bicelles. Our series of comprehensive experiments shows that the q ratio greatly influences the overall ordering of bicelles and the motions of lipids relative to other experimental parameters, such as temperature and hydration. As such, increasing the q ratio as a mean to exemplify dipolar couplings is a reasonable approach to improve spectral resolutions of a SLF spectrum. Unfortunately, this approach may compromise the alignment of bicelles; however, bicelles have been shown to exhibit macroscopic alignment over a wide range of q ratios from 2.5 to 5.5.33 Therefore, there must exist a q ratio where experimental conditions, bicelles alignment, and spectral resolutions can be satisfied for a specific membrane protein. Nevertheless, the use of bicelles in solid-state NMR studies of membrane proteins is a continuing endeavor that requires constant optimization of sample conditions.
Conclusion
The effects of the ratio of lipid and detergent, hydration level, and temperature of bicelles are investigated. The q ratio mainly influences the Sbicelle order parameter and has a great impact on the SCH order parameter of lipids. Although both the temperature and hydration level of bicelles can exert an effect on bicelles, their influence is gradual and moderate at best relative to the q ratio. In addition, the head-group orientation remains relatively constant under various sample conditions. Lastly, among the different regions of the bilayer, the glycerol region is profoundly sensitive to the conditions of the bicelles: it exhibits a wide range of order parameter values compared to other regions of a lipid in the bilayer membrane. Because several unique features of bicelles, such as easy preparation, stability in a variety of experimental conditions, excellent filling factor, and composition of toroidal pores, will continue to be exploited in the biophysical and structural studies of a variety of membrane-associated molecules via NMR spectroscopy, we believe that the analysis presented in this paper will lay the foundation for numerous such studies.
Table 2. Sbicelle Order Parameter of DMPC and DHPC Molecules Determined from NMR Experiments on Magnetically Aligned Bicelles at Different Hydration Levels.
| hydration levels (%) |
δDMPC | δDHPC | ||
|---|---|---|---|---|
| 40 | −14.2 | −8.7 | 0.94 | 0.58 |
| 50 | −13.0 | −6.8 | 0.86 | 0.45 |
| 60 | −12.5 | −5.5 | 0.83 | 0.36 |
| 70 | −12.4 | −5.4 | 0.82 | 0.36 |
| 80 | −12.5 | −5.5 | 0.83 | 0.36 |
| 90 | −12.4 | 5.3 | 0.83 | 0.35 |
Table 5. Angle ϕ (in Degrees) Calculated from Experimentally Measured C-H Dipolar Couplings at Different Carbon Sites of DMPC Head-Group in Bicelles of Different Temperatures.
| temperatures (°C) |
Cα (Hz) | Cβ (Hz) | Cγ (Hz) | average angle 〈ϕ〉 |
|---|---|---|---|---|
| 30 | 33.1 | 30.3 | 28.2 | 30.5 |
| 37 | 33.0 | 30.2 | 27.9 | 30.4 |
| 45 | 32.8 | 29.4 | 27.2 | 29.8 |
| 50 | 32.8 | 29.3 | 27.1 | 29.7 |
Acknowledgment
This research was supported by grants from the National Institute of Health (AI 054515, GM 084018, and RR023597 to A.R.).
References
- (1).Sanders CR, Hare BJ, Howard KP, Prestegard JH. Prog. NMR Spectrosc. 1994;26:421–444. [Google Scholar]
- (2).Prosser RS, Evanics F, Kitevski JL, Al-Abdul-Wahid MS. Biochemistry. 2006;45:8453–8465. doi: 10.1021/bi060615u. [DOI] [PubMed] [Google Scholar]
- (3).Marcotte I, Auger M. Concepts Magn. Reson., Part A. 2005;24:17–37. [Google Scholar]
- (4).Sanders CR, Prosser RS. Structure. 1998;6:1227–1234. doi: 10.1016/s0969-2126(98)00123-3. [DOI] [PubMed] [Google Scholar]
- (5).Prosser RS, Hwang JS, Vold RR. Biophys. J. 1998;74:2405–2418. doi: 10.1016/S0006-3495(98)77949-4. [DOI] [PMC free article] [PubMed] [Google Scholar]
- (6).Sanders CR, Schwonek JP. Biochemistry. 1992;31:8898–8905. doi: 10.1021/bi00152a029. [DOI] [PubMed] [Google Scholar]
- (7).Vold RR, Prosser RS. J. Magn. Reson. B. 1996;113:267–271. [Google Scholar]
- (8).De Angelis AA, Howell SC, Nevzorov AA, Opella SJ. J. Am. Chem. Soc. 2006;128:12256–12267. doi: 10.1021/ja063640w. [DOI] [PMC free article] [PubMed] [Google Scholar]
- (9).Dvinskikh SV, Dürr U, Yamamoto K, Ramamoorthy A. J. Am. Chem. Soc. 2006;128:6326–6327. doi: 10.1021/ja061153a. [DOI] [PMC free article] [PubMed] [Google Scholar]; Dvinskikh SV, Yamamoto K, Scanu D, Deschenaux R, Ramamoorthy A. J. Phys. Chem. 2008;112:12347–12353. doi: 10.1021/jp803265z. [DOI] [PubMed] [Google Scholar]
- (10).Dvinskikh SV, Dürr UHN, Yamamoto K, Ramamoorthy A. J. Am. Chem. Soc. 2007;129:794–802. doi: 10.1021/ja065536k. [DOI] [PMC free article] [PubMed] [Google Scholar]
- (11).Dürr UHN, Waskell L, Ramamoorthy A. Biochim. Biophys. Acta, Biomembr. 2007;1768:3235–3259. doi: 10.1016/j.bbamem.2007.08.007. [DOI] [PubMed] [Google Scholar]
- (12).Dürr UHN, Yamamoto K, Im SC, Waskell L, Ramamoorthy A. J. Am. Chem. Soc. 2007;129:6670–6671. doi: 10.1021/ja069028m. [DOI] [PMC free article] [PubMed] [Google Scholar]
- (13).Li C, Yi M, Hu J, Zhou HX, Cross TA. Biophys. J. 2008;94:1295–1302. doi: 10.1529/biophysj.107.112482. [DOI] [PMC free article] [PubMed] [Google Scholar]
- (14).Nieh MP, Glinka CJ, Krueger S, Prosser RS, Katsaras J. Langmuir. 2001;17:2629–2638. [Google Scholar]
- (15).Nieh MP, Glinka CJ, Krueger S, Prosser RS, Katsaras J. Biophys. J. 2002;82:2487–2498. doi: 10.1016/s0006-3495(02)75591-4. [DOI] [PMC free article] [PubMed] [Google Scholar]
- (16).Nieh MP, Raghunathan VA, Glinka CJ, Harroun TA, Pabst G, Katsaras J. Langmuir. 2004;20:7893–7897. doi: 10.1021/la048641l. [DOI] [PubMed] [Google Scholar]
- (17).Soong R, Macdonald PM. Biophys. J. 2005;88:255–268. doi: 10.1529/biophysj.104.043620. [DOI] [PMC free article] [PubMed] [Google Scholar]
- (18).Soong R, Macdonald PM. Biophys. J. 2005;89:1850–1860. doi: 10.1529/biophysj.105.064725. [DOI] [PMC free article] [PubMed] [Google Scholar]
- (19).Aussenac F, Laguerre M, Schmitter JM, Dufourc EJ. Langmuir. 2003;19:10468–10479. [Google Scholar]
- (20).Triba MN, Warschawski DE, Devaux PF. Biophys. J. 2005;88:1887–1901. doi: 10.1529/biophysj.104.055061. [DOI] [PMC free article] [PubMed] [Google Scholar]
- (21).Raffard G, Steinbruckner S, Arnold A, Davis JH, Dufourc EJ. Langmuir. 2000;16:7655–7662. [Google Scholar]
- (22).Kusumi A, Nakada C, Ritchie K, Murase K, Suzuki K, Murakoshi H, Kasai RS, Kondo J, Fujiwara T. Ann. Rev. Biophys. Biomol. Struct. 2005;34:351–354. doi: 10.1146/annurev.biophys.34.040204.144637. [DOI] [PubMed] [Google Scholar]
- (23).Lindblom G. Curr. Opin. Colloid Interface Sci. 1996;1:287–295. [Google Scholar]
- (24).Mangels ML, Cardon TB, Harper AC, Howard KP, Lorigan GA. J. Am. Chem. Soc. 2000;122:7052–7058. [Google Scholar]
- (25).Tiburu EK, Moton DM, Lorigan GA. Biochim. Biophys. Acta, Biomembr. 1512:206–214. doi: 10.1016/s0005-2736(01)00320-0. 200. [DOI] [PubMed] [Google Scholar]
- (26).Soong R, Macdonald PM. Biochim. Biophys. Acta, Biomembr. 2007;1768:1805–1814. doi: 10.1016/j.bbamem.2007.03.028. [DOI] [PubMed] [Google Scholar]
- (27).Soong R, Macdonald PM. Langmuir. 2008;24:518–527. doi: 10.1021/la7022264. [DOI] [PubMed] [Google Scholar]
- (28).Lu JX, Damodaran K, Lorigan GA. J. Magn. Reson. 2006;178:283–287. doi: 10.1016/j.jmr.2005.09.006. [DOI] [PubMed] [Google Scholar]
- (29).Dvinskikh SV, Yamamoto K, Dürr UHN, Ramamoorthy A. J. Magn. Reson. 2007;184:228–235. doi: 10.1016/j.jmr.2006.10.004. [DOI] [PMC free article] [PubMed] [Google Scholar]
- (30).Koenig BW, Gawrisch K. J. Phys. Chem. B. 2005;109:7540–7547. doi: 10.1021/jp044980b. [DOI] [PubMed] [Google Scholar]
- (31).Schmidt-Rohr K, Nanz D, Emsley L, Pines A. J. Phys. Chem. 1994;98:6668–6670. [Google Scholar]
- (32).Bertram R, Asbury T, Fabiola F, Quine JR, Cross TA, Chapman MS. J. Magn. Reson. 2003;163:300–309. doi: 10.1016/s1090-7807(03)00147-2. [DOI] [PubMed] [Google Scholar]
- (33).Cardon TB, Dave PC, Lorigan GA. Langmuir. 2005;21:4291–4298. doi: 10.1021/la0473005. [DOI] [PubMed] [Google Scholar]
- (34).Sanders CR. Biophys. J. 1993;64:171–181. doi: 10.1016/S0006-3495(93)81352-3. [DOI] [PMC free article] [PubMed] [Google Scholar]
- (35).Semchyschyn DJ, Macdonald PM. Magn. Reson. Chem. 2004;42:89–104. doi: 10.1002/mrc.1333. [DOI] [PubMed] [Google Scholar]
- (36).Davis JH. Biochim. Biophys. Acta. 1983;737:117–171. doi: 10.1016/0304-4157(83)90015-1. [DOI] [PubMed] [Google Scholar]
- (37).Seelig J, Gally HU, Wohlgemuth R. Biochim. Biophys. Acta. 1977;467:109–119. doi: 10.1016/0005-2736(77)90188-2. [DOI] [PubMed] [Google Scholar]
- (38).Brown MF, Seelig J. Nature. 1977;269:721–723. [Google Scholar]; Buldt G, Gally HU, Seelig A, Seelig J. Nature. 1978;271:182–184. doi: 10.1038/271182a0. [DOI] [PubMed] [Google Scholar]
- (39).Lee DL, Kwon BS, Ramamoorthy A. Langmuir. 2008;24:13598–13604. doi: 10.1021/la8023698. [DOI] [PMC free article] [PubMed] [Google Scholar]
- (40).Bechinger B, Seelig J. Chem. Phys. Lipids. 1991;58:1–5. doi: 10.1016/0009-3084(91)90105-k. [DOI] [PubMed] [Google Scholar]
- (41).Scherer PG, Seelig J. Biochemistry. 1989;28:7720–7728. doi: 10.1021/bi00445a030. [DOI] [PubMed] [Google Scholar]
- (42).Akutsu H, Seelig J. Biochemistry. 1981;20:7366–7373. doi: 10.1021/bi00529a007. [DOI] [PubMed] [Google Scholar]
- (43).Wasniewski CM, Parkanzky PD, Bodner ML, Weliky DP. Chem. Phys. Lipids. 2004;132:89–100. doi: 10.1016/j.chemphyslip.2004.09.008. [DOI] [PubMed] [Google Scholar]
- (44).Hallock KJ, Lee DK, Ramamoorthy A. Biophys. J. 2002;83:1004–1013. doi: 10.1016/S0006-3495(02)75226-0. [DOI] [PMC free article] [PubMed] [Google Scholar]
- (45).Brender JR, Durr UHN, Heyl D, Budarapu MB, Ramamoorthy A. Biochim. Biophys. Acta, Biomembr. 2007;1768:2026–2029. doi: 10.1016/j.bbamem.2007.07.001. 2007. [DOI] [PMC free article] [PubMed] [Google Scholar]
- (46).Ramamoorthy A, Lee DK, Santos JS, Henzler-Wildman KA. J. Am. Chem. Soc. 2008;130:11023–11029. doi: 10.1021/ja802210u. [DOI] [PubMed] [Google Scholar]; Ramamoorthy A. Solid State Nucl. Magn. Reson. 2009 doi: 10.1016/j.ssnmr.2009.03.003. in press. [DOI] [PMC free article] [PubMed] [Google Scholar]
- (47).Smith PES, Brender JR, Ramamoorthy A. J. Am. Chem. Soc. 2009;131:4470–4478. doi: 10.1021/ja809002a. [DOI] [PMC free article] [PubMed] [Google Scholar]
- (48).Barry J, Fritz M, Brender JR, Smith PES, Lee DK, Ramamoorthy A. J. Am. Chem. Soc. 2009;131:4490–4498. doi: 10.1021/ja809217u. [DOI] [PMC free article] [PubMed] [Google Scholar]