Abstract
Hepatic ischemia and reperfusion (IR) injury is a major complication after liver transplantation, major hepatic resection or prolonged portal vein occlusion. Furthermore, acute kidney injury is frequent after hepatic IR and greatly increases postoperative complications. Sphinganine-1-phosphate is a sphingolipid with uncharacterized physiological effects. We serendipitously determined that plasma levels of sphinganine 1-phosphate fell significantly after liver IR in mice. In this study, we hypothesized that repletion of plasma sphinganine 1-phosphate would protect against liver and kidney injury after liver IR. C57BL/6 mice were subjected to 60 min of partial hepatic IR and treated with either vehicle or with sphinganine 1-phosphate (given immediately before and 2 hrs after reperfusion). Vehicle-treated mice subjected to liver IR developed acute liver and kidney injury with elevated plasma alanine aminotransferase and creatinine 5 and 24 hrs after liver IR. However, liver and kidney injuries were significantly attenuated with sphinganine 1-phosphate treatment. Sphinganine 1-phosphate markedly inhibited liver and kidney necrosis and apoptosis 24 hrs after liver IR. Moreover, sphinganine 1-phosphate attenuated neutrophil infiltration, reduced plasma IL-6 and TNF-α upregulation and preserved liver and kidney vascular integrity wile reducing liver and kidney F-actin degradation after liver IR. Finally, sphinganine 1-phosphate-mediated hepatic and renal protection was blocked by VPC23019, an antagonist for sphingosine-1-phosphate type 1 receptor (S1P1R). Therefore, sphinganine 1-phosphate improves acute liver and kidney injury after hepatic IR via S1P1R-mediated inhibition of necrosis and apoptosis and by improving vascular integrity. Harnessing the mechanisms of cytoprotection with sphinganine 1-phosphate activation may lead to new therapies for perioperative hepatic IR injury and subsequent remote organ injury.
Keywords: apoptosis, dihydrosphingosine 1-phosphate, inflammation, kidney, liver, necrosis, sphingolipid, sphingosine 1-phosphate
Introduction
Hepatic ischemia and reperfusion (IR) complicates liver transplantation, major hepatic resection and prolonged portal vein occlusion (1, 2). The pathophysiology of hepatic IR injury is complex and involves a complex orchestration of necrosis, apoptosis and inflammation mediated by hepatic (hepatocytes, Kupffer cells) and extra-hepatic (leukocytes, circulating cytokines) components (3). Moreover, hepatic IR frequently leads to remote organ injury including the kidney, lung, and heart (4). In particular, acute kidney injury (AKI) after major liver IR is extremely common (40-85% incidence) and the development of AKI after liver injury greatly increases patient mortality and morbidity during the perioperative period (4). We recently developed a murine model of liver IR induced AKI characterized by early renal endothelial cell apoptosis and dysfunction, proximal tubule inflammation and necrosis (5). Liver IR induced AKI also produced severe impairment in vascular permeability of the liver and kidney together with filamentous (F)-actin degradation (5). Therefore, AKI developed due to liver IR is a disease of early endothelial cell apoptosis and dysfunction along with renal inflammation with subsequent F-actin degradation and tubular necrosis.
Sphingolipid metabolites have been recognized as important regulators of various physiological as well as pathophysiological conditions (6, 7). Sphingosine 1-phosphate (S1P) in particular is well known for its anti-apoptotic and endothelial cell protective properties to counteract against ischemia reperfusion injury and inflammation (8). Therefore, we originally postulated that hepatic IR in mice results in downregulation of S1P leading to dysregulation of balance between pro-apoptotic/death pathways (cytokine storm with subsequent TNF-α and HMG-B1 upregulation) and pro-survival/anti-apoptotic effects of S1P. Therefore, we utilized High Pressure Liquid Chromatography (HPLC) to measure plasma levels of S1P in mice after liver IR or sham-operation. We discovered that the plasma level of S1P did not change after liver IR in mice. However, we were surprised to discover that the plasma levels of a novel sphingolipid metabolite, dihydrosphingosine 1-phosphate or sphinganine 1-phosphate decreased significantly after liver IR. In contrast to S1P, sphinganine 1-phosphate has not been widely studied and little is known about its physiologic function. In this study, we tested the hypothesis that sphinganine 1-phosphate is biologically active, becomes depleted after massive liver IR injury and may have important cytoprotective functions to protect against liver and kidney injury after liver IR.
Materials and Methods
Detailed methods describing surgery and anesthesia protocols, immunohistochemistry and RNA isolation are available as on line supplemental digital content.
Reagents
Sphinganine 1-phosphate, S1P as well as (R)-phosphoric acid mono-[2-amino-2-(3-octyl-phenylcarbamoyl)-ethyl] ester (VPC23019) were purchased from Avanti Polar Lipids (Alabaster, AL). Unless otherwise specified, all other reagents were purchased from Sigma (St. Louis, MO).
Murine model of hepatic IR
All protocols were approved by the Institutional Animal Care and Use Committee of Columbia University. Male C57BL/6 mice (20-25 g, Harlan, Indianapolis, IN) were subjected to liver IR injury as described previously (5) (please see the on line supplemental digital content). This method of partial hepatic ischemia for 60 min. results in a segmental (∼70%) hepatic ischemia but spares the right lobe of the liver and prevents mesenteric venous congestion by allowing portal decompression through the right and caudate lobes of the liver. Sham operated mice were subjected to laparotomy and identical liver manipulations without the vascular occlusion. Sphinganine 1-phosphate or vehicle (40% DMSO, 40% ethanol in saline) was injected intravenously (i.v.) prior to reperfusion and then subcutaneously (s.c.) 2 hrs after reperfusion (Figure 1). Five doses of sphinganine 1-phosphate were tested: 0.01, 0.05, 0.1, 0.5 or 1 mg/kg i.v. immediately prior to reperfusion and 0.02, 0.1, 0.2, 1 or 2 mg/kg s.c. 2 hrs after reperfusion, respectively. In a separate cohort of mice, we also gave a dose of S1P (0.1 mg/kg i.v. immediately prior to reperfusion and 0.2 mg/kg s.c. 2 hrs after reperfusion dissolved in 40% DMSO, 40% ethanol in saline) to test whether S1P also provided liver and kidney protection. Preliminary data showed that sphinganine 1-phosphate, S1P or vehicle injection alone in sham-operated mice had no effect on any of the injury parameters tested in the liver or in the kidney. Twenty-four hrs after reperfusion, the liver and kidneys from sham-operated or liver IR subjected mice were collected to measure necrosis, neutrophil infiltration (with immunohistochemistry), vascular permeability, apoptosis (with terminal deoxynucleotidyl transferase-mediated dUTP nick end labeling staining, DNA laddering and caspase 3 protein cleavage) and F-actin integrity. In some mice, liver and kidneys were collected 5 hrs after reperfusion to detect inflammatory changes by RT-PCR for pro-inflammatory cytokines and adhesion molecule mRNAs. We also collected plasma for the measurement of alanine aminotransferase (ALT), creatinine, tumor necrosis factor (TNF)-α and interleukin-6 (IL-6) at 5 and 24 hrs after reperfusion.
Figure 1.
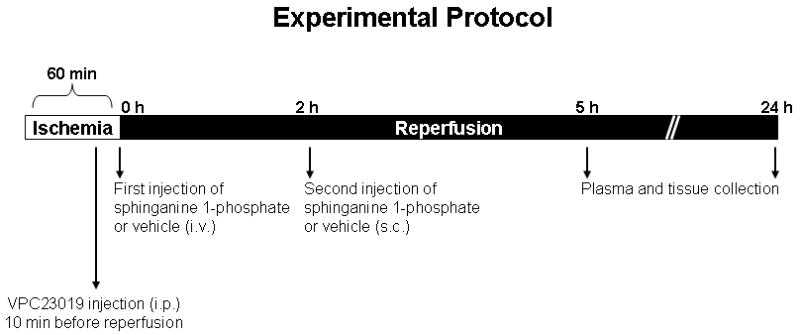
Experimental protocol and time line. Mice were subjected to 60. min liver ischemia and 24 hrs of reperfusion. Sphinganine 1-phosphate was injected immediately before reperfusion intravenously (i.v.) and another dose (twice the i.v. dose) given subcutaneously (s.c.) 2 hrs after reperfusion. VPC23019 = (R)-phosphoric acid mono-[2-amino-2-(3-octyl-phenylcarbamoyl)-ethyl] ester. Vehicle for sphinganine 1-phosphate = 40% DMSO, 40% ethanol in water. i.v. = intravenously, s.c. = subcutaneously and i.p. = intraperitoneally.
Effects of VPC23109 on sphinganine 1-phosphate-mediated liver and kidney protection after liver IR injury
VPC23019, a specific S1P1/S1P3 receptor antagonist (50-fold more selective at the S1P1 vs. the S1P3 receptor, (9)), was administered to test the effect of S1P receptor inhibition on hepatic IR injury (Figure 1). VPC23019 (0.1 mg/kg) was given intraperitoneally (i.p.) 10 min. before vehicle or sphinganine 1-phosphate injection in mice subjected to sham-operation or liver IR.
Determination of plasma sphinganine 1-phosphate and S1P levels
Twenty four hrs after liver IR or sham-operation, mouse plasma were collected for the measurements of S1P and sphinganine 1-phosphate levels. HPLC to detect plasma (20 μl) sphingolipids was performed as described by Min et al. (10) with two steps of sample pretreatment: enzymatic dephosphorylation of S1P and sphinganine 1-phosphate by alkaline phosphatase and subsequent analysis of o-phthalaldehyde derivatives of the liberated sphingosine bases by HPLC. By introducing C17 S1P as an internal standard, S1P and sphinganine 1-phosphate present in a sample can be quantified. The HPLC system used for analysis consisted of Hitachi HTA pump-LPG (model LCE-2130), fluorescence detector (model LCE-2485, excitation at 340 nm and emission at 455 nm) and autosampler (model LCE-2200) (Hitachi High Technologies America, Inc, Dallas, TX). Chromatographic separation was achieved on a C18 reversed-phase column (Zorbax SB-C18, 3.5 μm; 4.6 × 150 mm, Agilent Technologies, Santa Clara, CA) and a mobile phase consisting of acetonitrile: deionized distilled water (89:11, v/v) at a flow rate of 0.8 ml/min. Peak areas were measured by using EZChrom Elite chromatography software (Agilent Technologies, Santa Clara, CA). To confirm accurate detection of sphinganine 1-phosphate and S1P peaks, generation of standard curves with known concentrations of sphinganine 1-phosphate or S1P preceded the sample analysis.
Plasma ALT activity and creatinine level
The plasma ALT activities were measured using the Infinity™ ALT assay kit according to the manufacturer's instructions (Thermo Fisher Scientific, Waltham, MA). Plasma creatinine was measured by a colorimetric method based on the Jaffe reaction (11).
Histological analysis of hepatic and renal injury
For histological preparations, liver or kidney tissues were fixed in 10% formalin solution overnight. After automated dehydration through a graded alcohol series, transverse liver or kidney slices were embedded in paraffin, sectioned at 4 μm, and stained with hematoxylin-eosin (H&E). To quantify the degree of hepatic necrosis, H&E stains were digitally photographed and the percent of necrotic area was quantified with NIH IMAGE (Image-J, 1.37v) software by a person (SWC) who was blinded to the treatment each animal had received. Twenty random sections were investigated per slide to determine the percentage of necrotic area. Liver H&E sections were also graded for IR injury by a pathologist (VDD) blinded to the samples using the system devised by Suzuki et al. (12). In this classification, 3 liver injury indices are graded: sinusoidal congestion (0-4), hepatocyte necrosis (0-4), and ballooning degeneration (0-4) are graded for a total score of 0-12. No necrosis, congestion, or centrilobular ballooning is given a score of 0 whereas severe congestion/ballooning and >60% lobular necrosis is given a value of 4. Renal H&E sections were evaluated for the severity (score: 0-3) of renal cortical vacuolization, peritubular/proximal tubule leukocyte infiltration, proximal tubule simplification and proximal tubule hypereosinophilia by an experienced pathologist (VDD) who was blinded to the treatment each animal had received.
Assessment of liver and kidney inflammation
Liver and kidney inflammation after hepatic ischemia was determined with detection of neutrophil infiltration by immunohistochemistry 24 hrs after hepatic IR as described previously (13) and by measuring mRNA encoding markers of inflammation, including keratinocyte derived cytokine (KC), intercellular adhesion molecule-1 (ICAM-1), monocyte chemoattractive protein-1 (MCP-1) and macrophage inflammatory protein-2 (MIP-2) 5 hrs after liver IR (Table 1). Semi-quantitative real-time RT-PCR were performed as described (5). Detailed methods are described on line as supplemental digital contents.
Table 1.
RT-PCR primers used in this study. GAPDH, glyceraldehyde 3-phosphate dehydrogenase; ICAM-1, intercellular adhesion molecule-1; KC, keratinocyte derived chemokine, MIP-2, macrophage inflammatory protein 2, MCP-1, monocyte chemoattractant protein 1.
| Genes | Species | GenBank Sequences | Amplicon size (bp) | Primer sequences (Sense/Antisense) | Annealing °C/cycle No. |
|---|---|---|---|---|---|
| GAPDH | Mouse | M32599 | 450 | 5′-ACCACAGTCCATGCCATCAC-3′ | 65/15 |
| 5′-CACCACCCTGTTGCTGTAGCC-3′ | |||||
| ICAM-1 | Mouse | X52264 | 382 | 5′-TGTTTCCTGCCTCTGAAGC-3′ | 60/21 |
| 5′-CTTCGTTTGTGATCCTCCG-3′ | |||||
| KC | Mouse | J04596 | 205 | 5′-CAATGAGCTGCGCTGTCAGTG-3′ | 60/26 |
| 5′-CTTGGGGACACCTTTTAGCATC-3′ | |||||
| MCP-1 | Mouse | NM_011333 | 313 | 5′-ACCTGCTGCTACTCATTCAC3-′ | 60/22 |
| 5′-TTGAGGTGGTTGTGGAAAAG3-′ | |||||
| MIP-2 | Mouse | X53798 | 284 | 5′-CCAAGGGTTGACTTCAAGAAC-3′ | 60/25 |
| 5′-AGCGAGGCACATCAGGTACG-3′ |
Vascular permeability of liver and kidney tissues
Changes in liver and kidney vascular permeability were assessed by quantitating extravasation of Evans blue dye (EBD) into the tissue as described by Awad et al. (14) with some modifications. Briefly, 2% EBD (Sigma Biosciences, St. Louis, MO) was administered intravenously at a dose of 20 mg/kg 24 hrs after liver injury. One hr later, mice were killed and perfused through the heart with PBS and EDTA with 10 mL cold saline with heparin (100 U/mL). Liver (areas subjected to IR) and kidneys were then removed, allowed to dry overnight at 60 °C, and the dry weights were determined. EBD was extracted in formamide (20 mL/g dry tissue; Sigma Biosciences), homogenized, and incubated at 60 °C overnight. Homogenized samples were centrifuged at 12,000 g for 30 min and the supernatants were measured at 620 and 740 nm in a spectrophotometer. The extravasated EBD concentration was calculated against a standard curve and the data expressed as micrograms of EBD per gram of dry tissue weight.
Enzyme Linked ImmunoSorbent Assay for plasma TNF-α and IL-6
Five and 24 hrs after liver reperfusion, the plasma TNF-α and IL-6 levels were measured with mouse specific ELISA kits according to the manufacturer's instructions (eBiosciences, San Diego, CA).
Detection of liver and kidney apoptosis
We utilized 3 independent assays to assess the degree of liver and kidney apoptosis after IR: with in situ Terminal Deoxynucleotidyl Transferase Biotin-dUTP Nick End-Labeling (TUNEL) assay, detection of DNA laddering and immunoblotting for fragmented caspase 3. For DNA laddering, liver and kidney tissues were removed 24 hrs after liver IR, apoptotic DNA fragments were extracted according to the methods of Herrmann et al. (15) and was electrophoresed at 70 V in a 2.0% agarose gel in Tris-acetate-EDTA buffer. This method of DNA extraction selectively isolates apoptotic, fragmented DNA and leaves behind the intact chromatin. The gel was stained with ethidium bromide and photographed under UV illumination. DNA ladder markers (100 bp) were added to a lane of each gel as a reference for the analysis of internucleosomal DNA fragmentation. For the TUNEL assay, fixed liver and kidney sections obtained at 24 hrs after hepatic IR were deparaffinized in xylene and rehydrated through graded ethanols to water. In situ TUNEL staining was used for detecting DNA fragmentation in apoptosis using a commercially available in situ cell death detection kit (Roche, Nutley, NJ) according to the manufacturer's instructions. Caspase 3 immunoblotting was performed as described previously (16).
F-actin staining of liver and kidney sections
As breakdown of F-actin occurs early after IR, we visualized the F-actin cytoskeleton by staining with phalloidin as an early index of liver as well as renal injury (17). Twenty-four hrs after hepatic IR, liver and kidney tissues were embedded in Tissue-Tek oxytetracycline compound (Fisher Scientific, Pittsburgh, PA) and cut into 5 μm sections. To reduce background staining, the sections were incubated in 1% FBS dissolved in PBS for 10 min at room temperature. The sections were then stained with Alexafluor 594 (Red)-labeled phalloidin (Invitrogen, Carlsbad, CA) for 30 min at 37 °C in a humidified chamber in the dark. Sections were then washed twice in PBS and mounted with Vectashield (Vector Laboratories, Burlingame, CA). F-actin images were visualized with an Olympus IX81 epifluorescence microscope (Tokyo, Japan) and captured and stored using SlideBook 4.2 software (Intelligent Imaging Innovations Inc., Denver, CO) on a personal computer.
Protein determination
Protein contents were determined with a bicinchoninic acid protein assay kit (Pierce Chemical Co., Rockford, IL), using bovine serum albumin as a standard.
Statistical analysis
All data are reported as mean ± standard error. The overall significance of the results was examined using one-way analysis of variance and the significant differences between the groups were considered at a P<0.05 with the appropriate Tukey's post hoc test made for multiple comparisons. The ordinal values of the liver and kidney injury scores were analyzed by the Mann-Whitney nonparametric test. Twenty-four hrs survival rates between vehicle hepatic IR and sphinganine 1-phosphate hepatic IR groups were compared with Chi-square test.
Results
Plasma sphinganine 1-phosphate levels and not S1P levels decrease significantly after liver IR in mice
We originally postulated that depletion of S1P occurs after liver IR which may explain increased renal endothelial cell damage after liver IR. We utilized HPLC to measure plasma levels of S1P in mice after liver IR or sham-operation (Figure 2). Plasma levels of endogenous C18 S1P did not change 24 hrs after liver IR (6.3±1.1 pmol/μl plasma) compared to the levels obtained from sham-operated mice (6.7±0.5 pmol/μl plasma). However, we were surprised to discover that the plasma levels of sphinganine 1-phosphate, a related sphingolipid metabolite with unclear physiological function, decreased significantly after 24 hrs liver IR (1.1±0.3 pmol/μl plasma, N=9) compared to the levels obtained from sham-operated mice (3.9±0.4 pmol/μl plasma, N=9).
Figure 2.
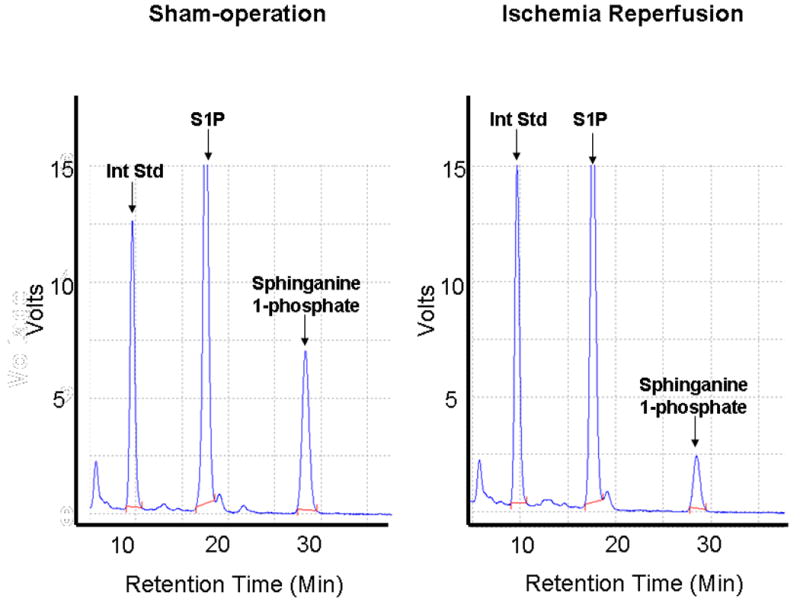
Representative HPLC analyses of mouse plasma HPLC to detect S1P and sphinganine 1-phosphate after liver IR. Mice were subjected to either sham-operation or to liver ischemia and reperfusion. By introducing a known quantity of C17-S1P as an internal standard (Int Std), the amount of endogenous C18 S1P as well as C18 sphinganine 1-phosphate present in the original sample can be quantified.
Sphinganine 1-phosphate treatment provides dose-dependent protection against hepatic and renal injury after liver IR
The plasma level of ALT and creatinine (Cr) in the vehicle-treated sham-operated mice was 72±9 U/L (N=6) and 0.43±0.03 mg/dL (N=6), respectively. The plasma level of ALT and Cr in the sphinganine 1-phosphate-treated sham-operated mice was 80±6 U/L (N=6) and 0.46±0.05 mg/dL (N=6), respectively. In the vehicle-IR group, the plasma level of ALT significantly increased at 5 hrs and 24 hrs (Figure 3A) after 60 min. liver ischemia and reperfusion. The mice subjected to liver IR after vehicle treatment also developed AKI with rises in plasma Cr 24 hrs after reperfusion (Figure 3A). Sphinganine 1-phosphate treatment produced biphasic dose dependent protection against liver as well as renal injury 24 hrs after liver IR (Figure 3A). At lower does (0.01, 0.05, 0.1, mg/kg i.v. prior to reperfusion and 0.02, 0.1, 0.2 mg/kg s.c. 2 hrs after reperfusion), sphinganine 1-phosphate produced dose-dependent protection against liver and kidney injury after liver with the peak protection with the dose of 0.1 mg/kg i.v. before reperfusion and 0.2 mg/kg s.c. 2 hrs after reperfusion (Figure 3B). At this dose of sphinganine 1-phosphate, the increases in ALT were significantly suppressed by sphinganine 1-phosphate treatment (0.1 mg/kg i.v. prior to reperfusion and 0.2 mg/kg s.c. 2 hrs after reperfusion) at 5 hrs and 24 hrs after reperfusion (Figure 3B). The increases in Cr were significantly suppressed by sphinganine 1-phosphate treatment (0.1 mg/kg i.v. prior to reperfusion and 0.2 mg/kg s.c. 2 hrs after reperfusion) at 24 hrs after reperfusion (Figure 3B). At higher doses, however, (1 mg/kg i.v. prior to reperfusion and 2 mg/kg s.c. 2 hrs after reperfusion), sphinganine 1-phosphate failed to provide protection against liver and kidney injury after liver IR (Figure 3B). The survival rates for vehicle- (70.6%, N=17) or sphinganine 1-phosphate-treated (82.4%, N=17) mice were not statistically different at 24 hrs after liver IR (Chi-square test).
Figure 3.
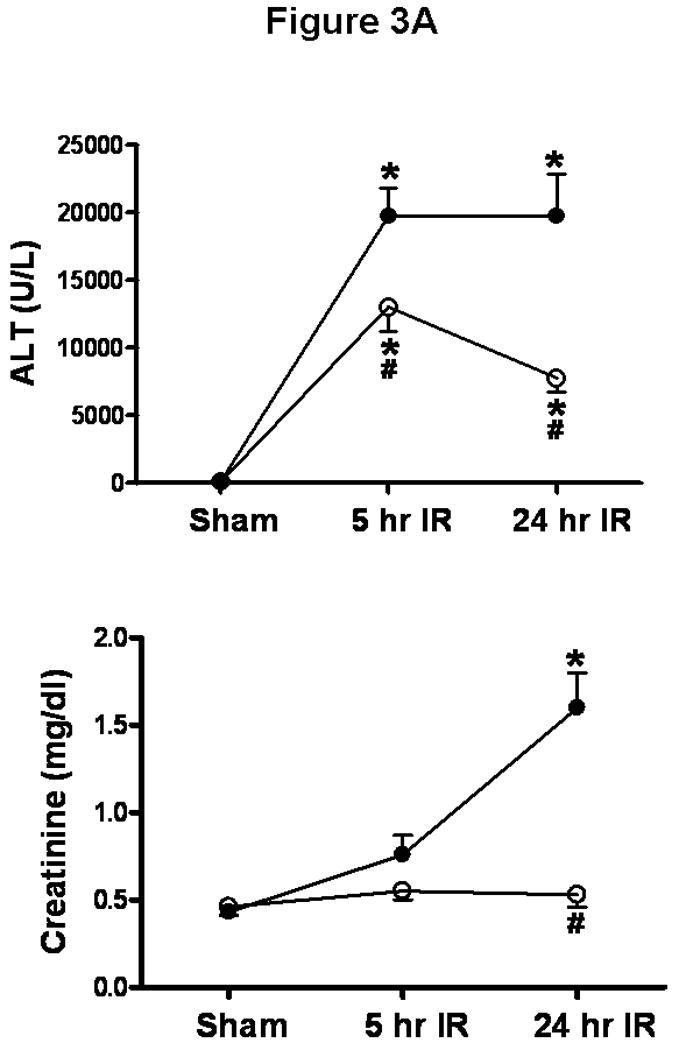
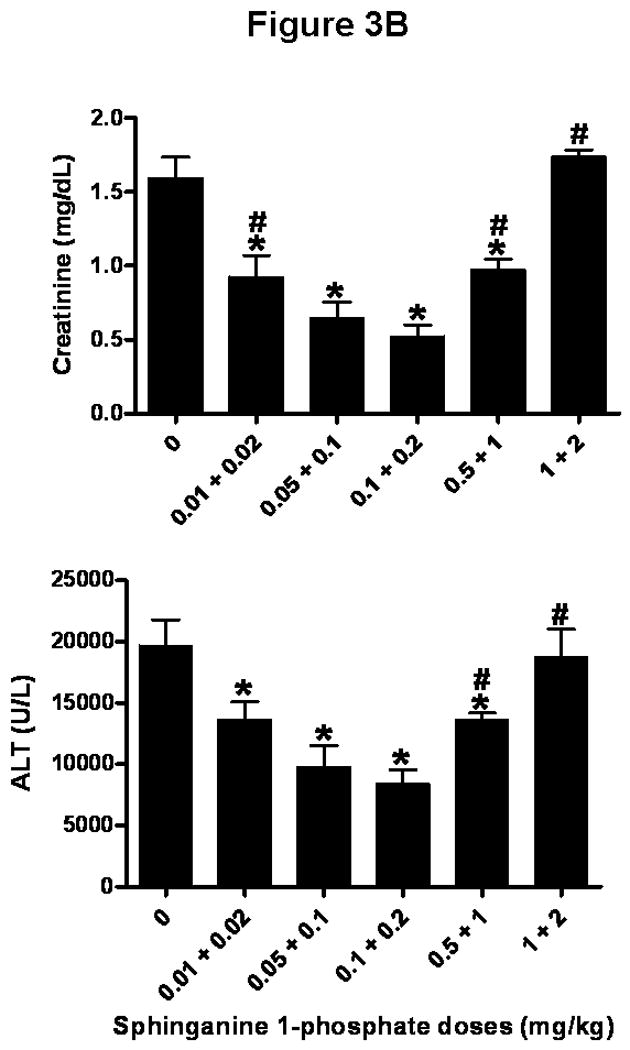
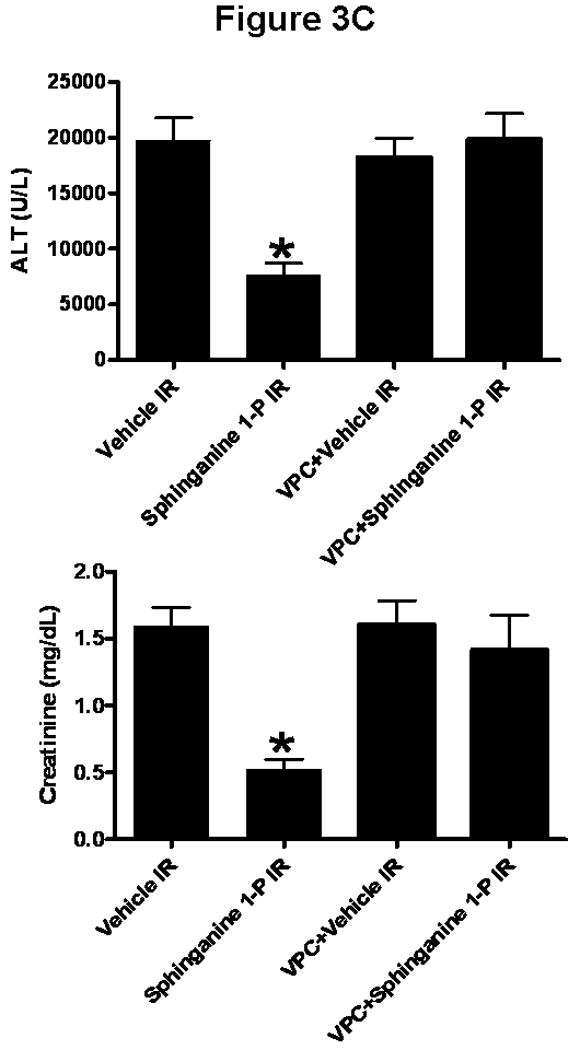
A). Plasma ALT (top, U/L) and creatinine (bottom, mg/dL) levels in mice injected with vehicle or with sphinganine 1-phosphate (Sphinganine 1-P) and subjected to sham-operation (Sham, N=6 each) or 60 min. of liver ischemia and 5 hrs (N=9 for vehicle IR and N=10 for sphinganine 1-phosphate IR) or 24 hrs of reperfusion (IR, N=9 for vehicle IR and N=17 for sphinganine 1-phosphate IR). * p<0.05 vs. appropriate sham-operated mice. # p<0.05 vs. mice subjected to liver IR after vehicle treatment. B). Dose-dependent protective effects of sphinganine 1-phosphate against hepatic (top, ALT) and renal (bottom, creatinine) injury in C57BL/6 mice subjected to vehicle (0) or sphinganine 1-phosphate treatment (during and after liver IR) and subjected to 60 min. of liver ischemia and 24 hrs of reperfusion. Five dose of sphinganine 1-phosphate was given to mice (N=6-17): 0.01 mg/kg i.v. immediately prior to reperfusion and 0.02 mg/kg s.c. 2 hrs after reperfusion (0.01+0.02), 0.05 mg/kg i.v. immediately prior to reperfusion and 0.1 mg/kg s.c. 2 hrs after reperfusion (0.05+0.1), 0.1 mg/kg i.v. immediately prior to reperfusion and 0.2 mg/kg s.c. 2 hrs after reperfusion (0.1+0.2), 0.5 mg/kg i.v. immediately prior to reperfusion and 1 mg/kg s.c. 2 hrs after reperfusion (0.5+1) or 1 mg/kg i.v. immediately prior to reperfusion and 2 mg/kg s.c. 2 hrs after reperfusion (1+2). Vehicle was also given i.v. immediately prior to reperfusion and s.c. 2 hrs after reperfusion. *P<0.05 vs. vehicle treated IR group (0). #P<0.05 vs. maximum protection provided by sphinganine 1-phosphate injection (0.1 mg/kg i.v. before reperfusion and 0.2 mg/kg s.c. 2 hrs after reperfusion). C). In a separate cohort of mice, VPC23019 (VPC, a specific S1P1/S1P3 receptor antagonist) was administered to test the effect of S1P receptor inhibition on hepatic IR injury. VPC23019 (0.1 mg/kg) was given intraperitoneally (i.p.) 10 min. before vehicle (N=5) or sphinganine 1-phosphate injection (N=5) in mice subjected to liver IR. *P<0.05 vs. vehicle IR group. Data are presented as mean ± SEM.
Sphinganine 1-phosphate provides protection against hepatic and renal injury after liver IR via S1P 1/3 receptor activation
We tested whether blockade of S1P1/3 receptors with VPC23019 (50 fold more selective for S1P1 receptor vs. S1P3 receptor subtype with no activity at S1P2 receptors, (9)) would prevent sphinganine 1-phosphate-medted hepatic and renal protection after liver IR. VPC23019 (0.1 mg/kg i.p. 10 min. prior to vehicle or sphinganine 1-phosphate injection and 0.1 mg/kg i.p. 10 min prior to reperfusion) completely inhibited sphinganine 1-phosphate induced hepatic and renal protection (24 hrs after liver IR (Figure 3C). VPC23019 treatment in sham-operated animals (vehicle- or sphinganine 1-phopshate-treated) had no effect on renal or hepatic function (data not shown).
We also tested whether exogenous S1P protected against liver IR induced hepatic and renal dysfunction. S1P (0.1 mg/kg i.v. prior to reperfusion and 0.2 mg/kg s.c. 2 hrs after reperfusion) also produced significant (but to a lesser degree than Sg1P) hepatic (ALT=9178±1822, N=9) and renal protection (Cr=0.72±0.13, N=9) 24 hrs after liver IR.
Sphinganine 1-phosphate treatment reduces hepatic necrosis after IR
Representative histological slides (magnification, 40×) from liver tissues from vehicle-treated or sphinganine 1-phosphate-treated mice subjected to 60 min ischemia and 24 hrs reperfusion or to sham-operation are shown in Figure 4. Sixty min of partial hepatic IR in vehicle-treated mice produced large necrotic areas of livers after reperfusion (Figure 4). Correlating with significantly improved function, reduced necrosis was observed in mice treated with sphinganine 1-phosphate and subjected to hepatic IR (Figure 4). The average percent necrotic areas for vehicle-treated mice were 92±2% (N=6) and sphinganine 1-phosphate-treatment reduced this percent necrosis to 44±8% (N=7, P<0.05). We failed to detect necrosis in liver sections from sham-operated mice. Livers were also analyzed for the degree of hepatocellular damage using the Suzuki's criteria (18). The ischemic lobes in the control group showed severe hepatocyte vacuolization (Figure 4), necrosis and sinusoidal congestion (Suzuki score=8.6±0.3, N=5). Mice treated with sphinganine 1-phosphate revealed significantly less necrosis/sinusoidal congestion and better preservation of lobular architecture (Suzuki score=5.2±0.8, N=5, P<0.01).
Figure 4.
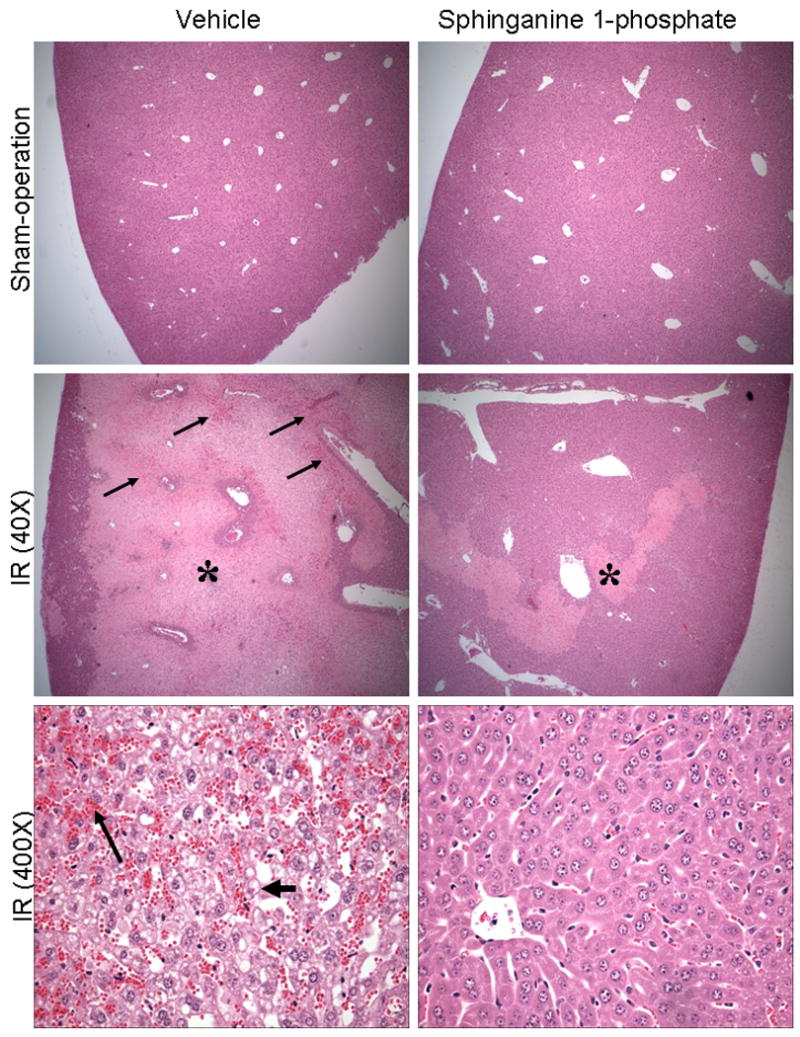
Representative photomicrographs of hematoxylin and eosin staining of the liver sections. C57BL/6 mice were subjected to sham-operation (40×) or to liver ischemia reperfusion (40× or 400×) after vehicle- or sphinganine 1-phosphate treatment (0.1 mg/kg i.v. immediately prior to reperfusion and 0.2 mg/kg s.c. 2 hrs after reperfusion). At low magnification (40×), necrotic hepatic tissue appears as light pink (*) with inflammation/vascular congestion near the portal triad (arrows). High magnification images (bottom panels, 400×) of liver demonstrate severe vacuolization (short, thick arrow) and congestion (long, thin arrow) of vehicle-treated mice subjected to liver IR and powerful protection with sphinganine 1-phosphate treatment. Photographs are representative of 6 independent experiments.
Sphinganine 1-phosphate treatment reduces renal cortical vacuolization, proximal tubular simplification, and hypereosinophilia after liver IR
Representative H&E slides from kidneys from vehicle-treated and sphinganine 1-phosphate-treated mice subjected to 60 min ischemia and 24 hrs reperfusion are shown in Figure 5A (magnification, 400×). When we examined the kidneys from the mice injected with vehicle and subjected to liver IR, we observed multifocal acute tubular injury including S3 segment proximal tubule necrosis, cortical tubular simplification, cytoplasmic vacuolization and dilated lumina as well as focal granular bile/heme casts (Figure 5A). Correlating with significantly improved renal function, mice treated with sphinganine 1-phosphate showed less renal tubular hypereosinophilia and cortical vacuolization (Figure 5A). The summary of renal injury scores for percent renal tubular hypereosinophilia, percent peritubular leukocyte margination and percent cortical vacuolization are shown in Figure 5B.
Figure 5.
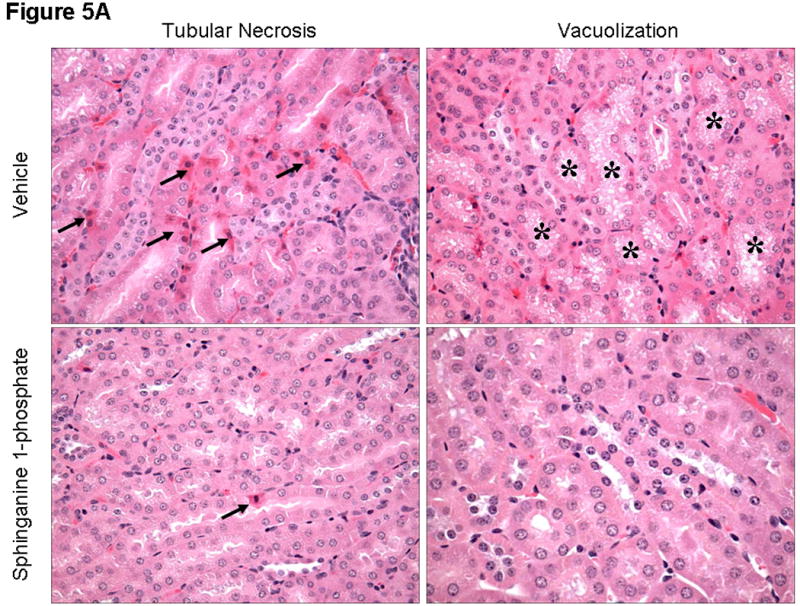
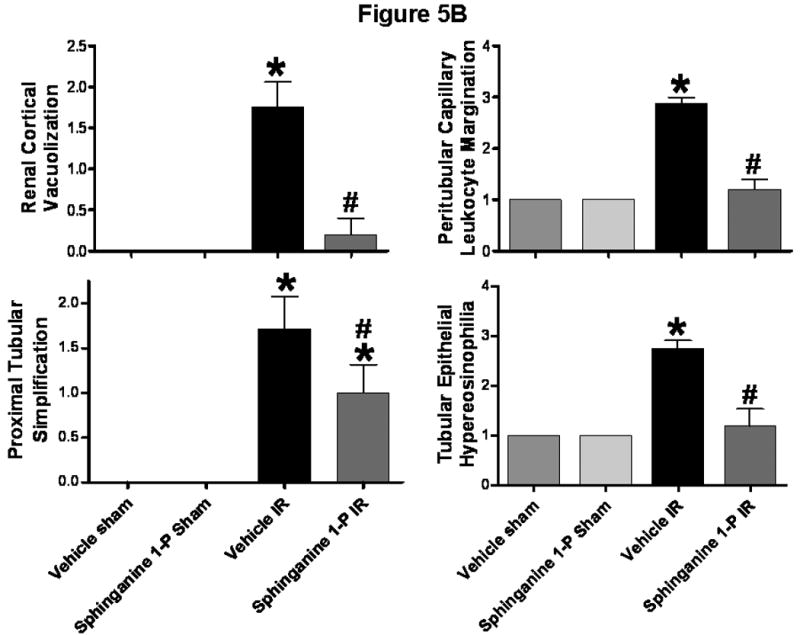
A). Representative photomicrographs of 6 experiments (hematoxylin and eosin staining, magnification 400×) demonstrating hypereosinophillia (arrows) and vacuolization (*) in kidneys from C57BL/6 mice 24 hrs after being subjected to liver ischemia reperfusion after vehicle- or sphinganine 1-phosphate treatment (0.1 mg/kg i.v. immediately prior to reperfusion and 0.2 mg/kg s.c. 2 hrs after reperfusion). B). Summary of renal injury scores (scale 0-3) for renal cortical vacuolization, peritubular leukocyte margination, proximal tubule simplification and renal tubular hypereosinophilia for kidneys from mice subjected to liver IR after vehicle- or sphinganine 1-phosphate treatment. Data are presented as means ± SEM. *P<0.05 vs. Vehicle sham group. #P<0.05 vs. Vehicle IR group.
Sphinganine 1-phosphate treatment reduces hepatic and renal neutrophil infiltration 24 hrs after liver IR
In sham-operated mice, we were unable to detect any neutrophils in the liver or kidney with immunohistochemistry. Sixty min of hepatic ischemia after vehicle treatment resulted in significant recruitment of neutrophils into the liver (On Line Supplemental Digital Content Figure 1A). Neutrophil infiltration coincided with areas of liver necrosis. The number of neutrophils present in the necrotic areas visualized was greater in the animals subjected to liver IR after vehicle injection (39.5±11.8 neutrophils/field, 200× magnification, N=6) compared to sphinganine 1-phosphate injected mice (21.8±7.1 neutrophils/field, 200× magnification, N=6, P<0.05).
Sixty min. of hepatic ischemia also resulted in recruitment of neutrophils into the kidney (On Line Supplemental Digital Content Figure 1B). Neutrophil infiltration 24 hrs after hepatic ischemia was significantly less in sphinganine 1-phosphate-treated mice compared to the vehicle-treated mice subjected to liver IR. Twenty four hrs after liver IR, we detected 14.9±3.1 neutrophils/field in the kidney (200× magnification, N=5) in vehicle-treated mice subjected to liver IR. Sphinganine 1-phosphate-treated mice had significantly reduced neutrophil infiltration in the kidney 24 hrs after liver IR (0.8±0.3 neutrophils/field, 200× magnification, N=5, P<0.05).
Sphinganine 1-phosphate treatment decreases hepatic and renal vascular permeability after liver IR
We measured liver and kidney vascular permeability after liver IR with EBD injection. EBD binds to plasma proteins and its appearance in extravascular tissues reflects an increase in vascular permeability. We show that liver IR caused significant increases in vascular permeability of the liver and kidney – liver and kidney harvested from a mouse subjected to liver IR are enlarged and show blue dye extravation compared to the liver and kidney harvested from a sham-operated mouse. Analysis of EBD extravasations in vehicle- and sphinganine 1-phosphate-treated mice subjected to sham-operation and liver IR is shown in Figure 6. Liver IR increased the EBD content in the liver for both groups, however, the increase in EBD content was significantly higher for the vehicle-treated mice compared to the sphinganine 1-phosphate-treated mice 24 hrs after liver IR. Liver IR also increased the EBD content in the kidney for both groups, however, the increase in EBD content was significantly higher for the vehicle-treated mice compared to the sphinganine 1-phosphate-treated mice 24 hrs after liver IR (Figure 6).
Figure 6.
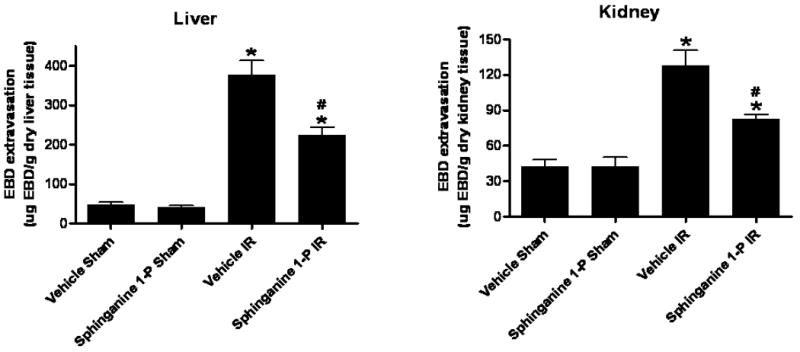
Quantification of EBD extravasations as indices of vascular permeability of liver and kidney tissues in C57BL/6 mice 24 hrs after being subjected to sham-operation (sham) or to liver ischemia reperfusion (IR) after vehicle- or sphinganine 1-phosphate (Sphinganine 1-P, 0.1 mg/kg i.v. immediately prior to reperfusion and 0.2 mg/kg s.c. 2 hrs after reperfusion) treatment. Data are presented as means ± SEM. *P<0.05 vs. Vehicle sham group. #P<0.05 vs. Vehicle IR group.
Sphinganine 1-phosphate treatment reduces plasma TNF-α and IL-6 after liver IR
In sham-operated animals, the plasma TNF-α level was not detectable and plasma IL-6 levels were very low (Figure 7). In contrast, the plasma TNF-α and IL-6 levels increased markedly 24 hrs after liver IR (Figure 7). However, this increase at both 5 and 24 hrs was attenuated by sphinganine 1-phosphate treatment after liver IR.
Figure 7.
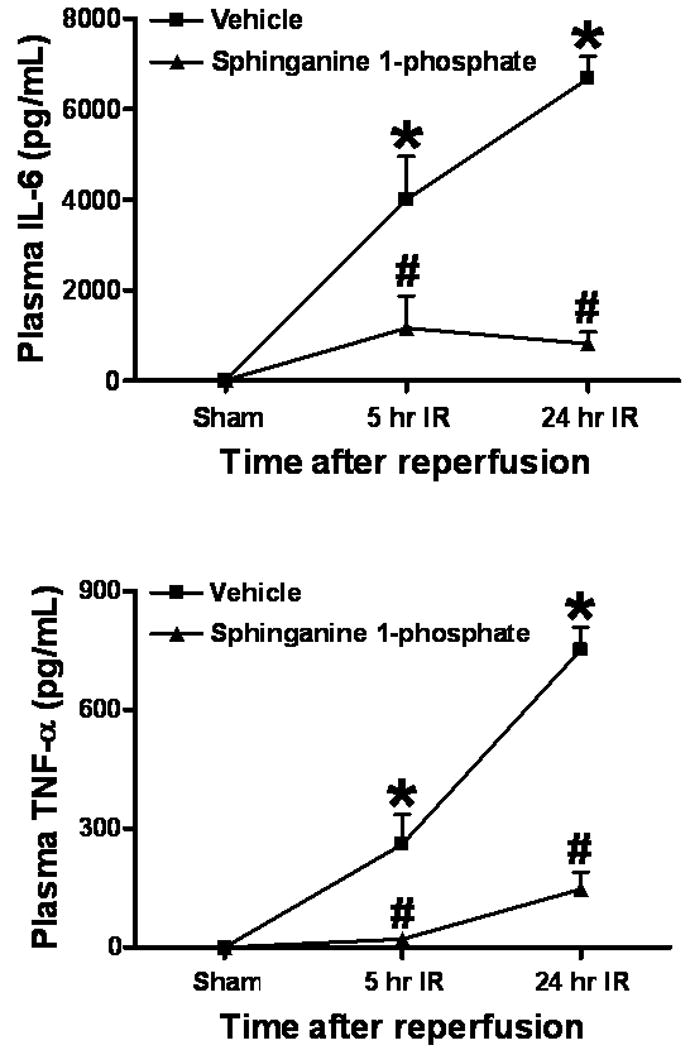
Plasma TNF-α and IL-6 levels at 5 or 24 hrs after reperfusion in C57BL/6 mice subjected to sham-operation (sham) or to liver IR after vehicle- or sphinganine 1-phosphate treatment (0.1 mg/kg i.v. immediately prior to reperfusion and 0.2 mg/kg s.c. 2 hrs after reperfusion). Data are presented as mean ± SEM. *P<0.05 vs. Vehicle sham group. #P<0.05 vs. Vehicle IR group.
Sphinganine 1-phosphate treatment reduces pro-inflammatory mRNAs in the liver and ICAM-1 and MIP-2 mRNAs in the kidney after liver IR
We measured the expression of pro-inflammatory cytokine mRNAs in the liver and kidney 5 hrs after liver IR with semi-quantitative RT-PCR. Hepatic IR was associated with significantly increased pro-inflammatory mRNA expression (ICAM-1, KC, MCP-1 and MIP-2) in the liver as well as in the kidney from vehicle-treated mice compared to the sham-operated mice (Figure 8). However, sphinganine 1-phosphate-treated mice showed significantly reduced increases in all of the pro-inflammatory mRNAs examined in the liver and ICAM-1 and MIP-2 in the kidney compared to the vehicle-treated mice after liver IR (Figure 8). There were no significant differences in KC and MCP-1 mRNAs in the kidney after liver IR between vehicle- and sphinganine 1-phosphate-treated mice.
Figure 8.
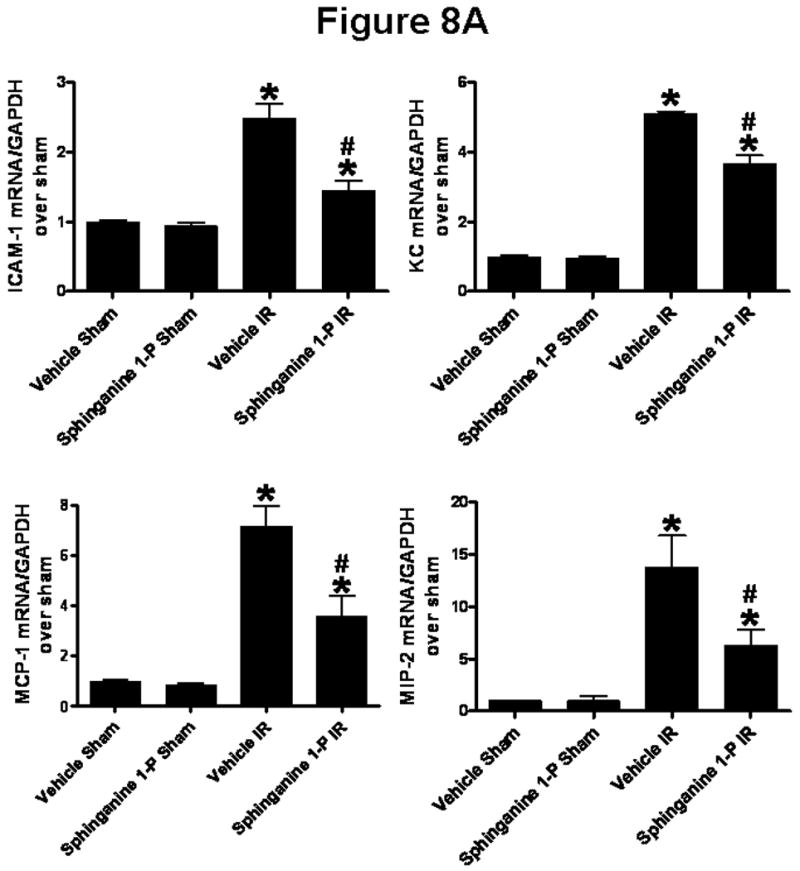
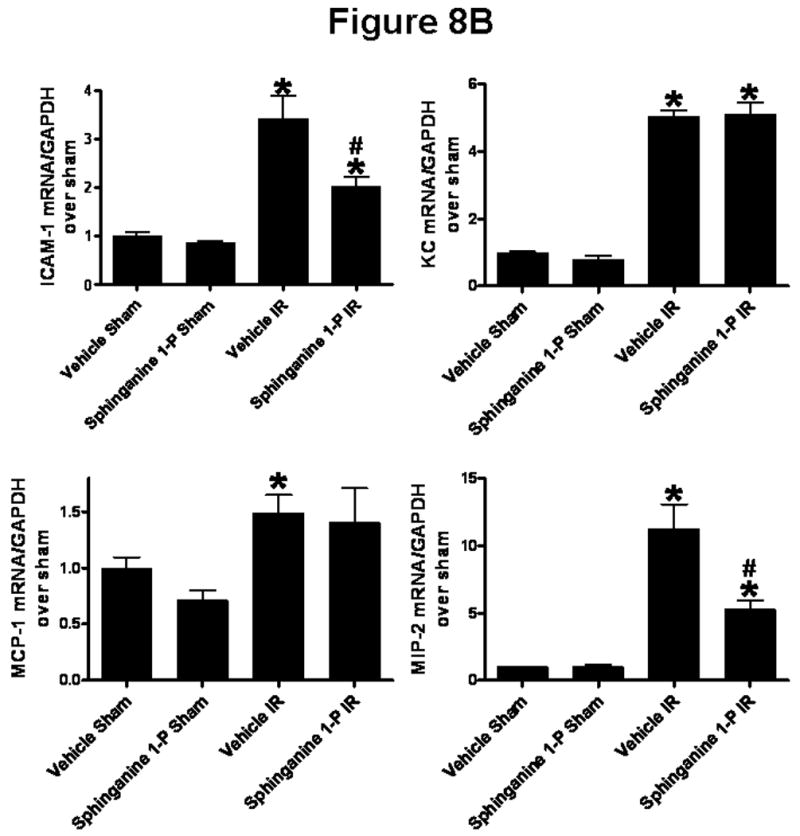
Densitometric quantification of relative mRNA band intensities normalized to GAPDH from RT-PCR reactions from liver (A) and kidney (B) tissues. Data are presented as means ± SEM. *P<0.05 vs. Vehicle sham group. #P<0.05 vs. Vehicle IR group.
Sphinganine 1-phosphate treatment reduces hepatic and renal apoptosis after liver IR
We utilized 3 separate indices to detect apoptosis: TUNEL staining, DNA laddering and caspase 3 fragmentation. Sphinganine 1-phosphate treatment significantly reduced the apoptosis of the liver and kidney compared to the vehicle-treated mice with reduced TUNEL staining (On Line Supplemental Digital Content Figure 2), DNA laddering (On Line Supplemental Digital Content Figure 3) and caspase 3 fragmentation (Figure 9). The TUNEL staining showed that endothelial cell apoptosis was predominant in the kidney.
Figure 9.
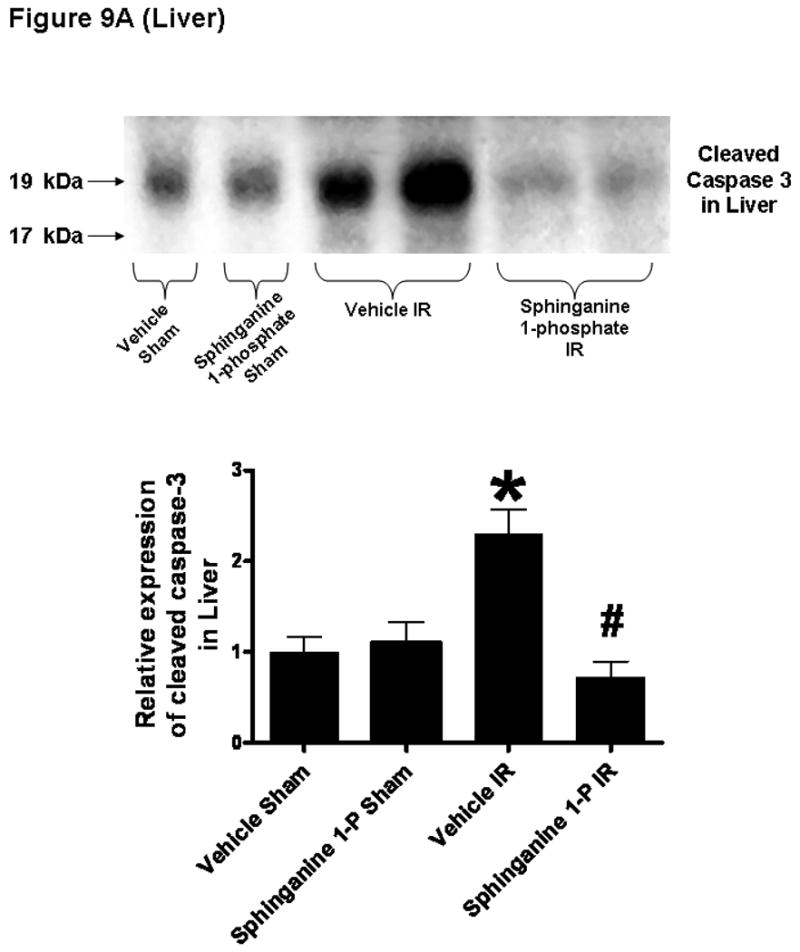
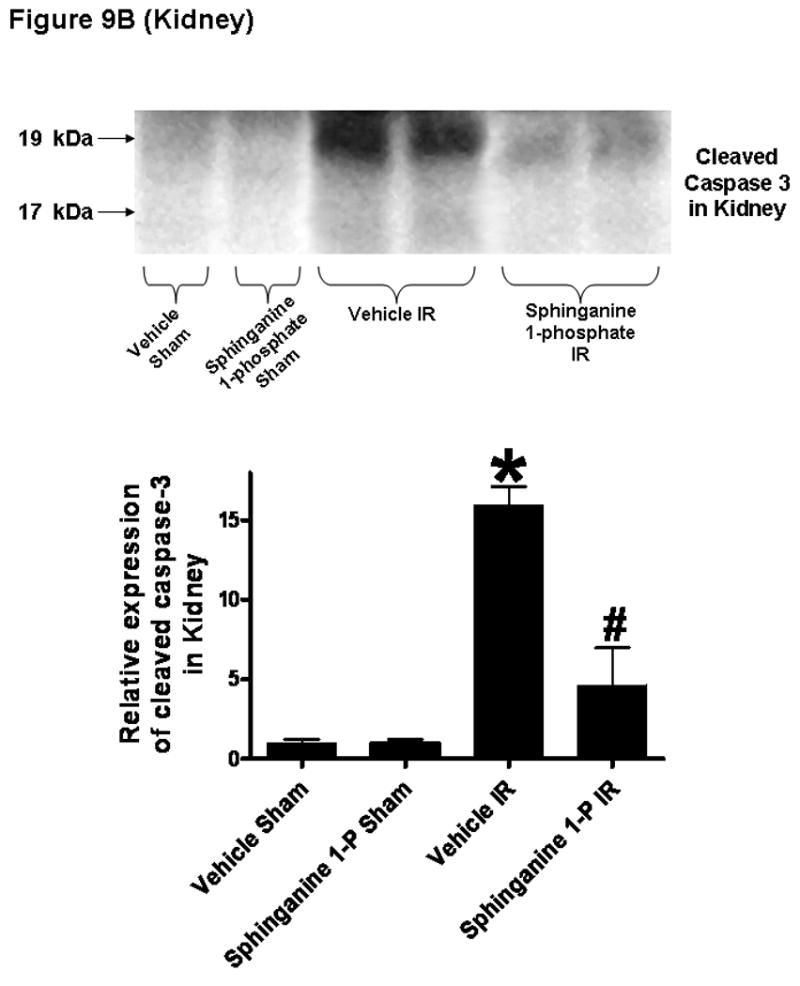
Top: Representative caspase 3 fragmentation in liver (A) and kidney (B) tissues. C57BL/6 mice were subjected to sham-operation (sham) or to liver IR after vehicle- or sphinganine 1-phosphate treatment (0.1 mg/kg i.v. immediately prior to reperfusion and 0.2 mg/kg s.c. 2 hrs after reperfusion). The liver and kidney tissues were obtained 24 hrs after reperfusion. Photographs are representative of 4 independent experiments. Bottom: Densitometric quantifications of cleaved caspase 3 (pro-caspase 3) mice subjected to sham-operation or liver IR (N=4 for each group). *P<0.05 vs. Vehicle sham group. #P<0.05 vs. Vehicle IR group.
Sphinganine 1-phosphate treatment reduces the degradation of hepatic and renal F-actin after liver IR
Liver staining in sham-operated mice shows localization of F-actin at the hepatocyte basolateral membranes and the bile canalicular membranes (Figure 10A). As expected, 60 min of liver ischemia and 24 hrs of reperfusion resulted in severe disruption of liver parenchymal F-actin compared to the sham-operated mice (Figure 10A, representative of 6 experiments) in vehicle-treated mice as the staining of basolateral hepatocyte membranes as well as bile canalicular membranes is strongly decreased and disorganized. However, sphinganine 1-phosphate-treated mice subjected to liver IR show significantly better preserved F-actin structure. Liver IR also resulted in a severe loss of F-actin in renal proximal tubules in 24 hr. In Figure 13A, 24 hrs post-hepatic IR induced disruptions of the F-actin cytoskeleton in renal proximal tubular epithelial cells are also shown. Mice subjected to sham surgery showed intense staining in tubular epithelial and in the basal plasma membrane. In contrast, kidneys from vehicle-treated mice subjected to liver IR showed loss of F-actin staining in the tubular epithelial cells. However, the sphinganine 1-phosphate-treated mice show significantly better preserved F-actin structure after liver IR as the staining is quite similar to that of sham-operated mice. Mean flurorescent F-actin intensity showed reduced hepatocyte and renal proximal tubule F-actin degradation in sphinganine 1-phosphate-treated mice after liver IR (Figure 10B). We also show that the mice treated with sphinganine 1-phosphate demonstrate improved preservation of bile canalicular membrane F-actin number as well as fluorescent intensity (Figure 10B).
Figure 10.
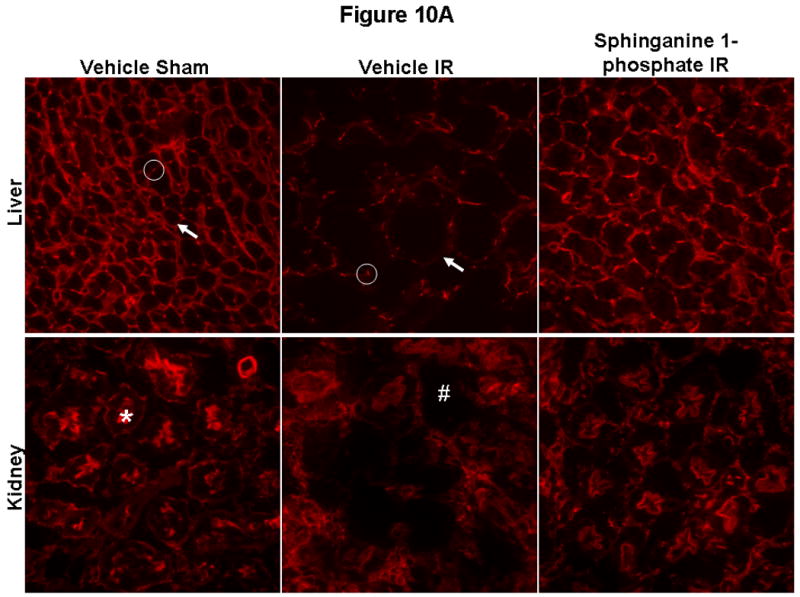
(A) Representative fluorescent photomicrographs of phalloidin staining of the liver and kidney tissues (magnification 400×). C57BL/6 mice were subjected to sham-operation (sham) or to liver IR after vehicle- or sphinganine 1-phosphate treatment (Sphinganine 1-P, 0.1 mg/kg i.v. immediately prior to reperfusion and 0.2 mg/kg s.c. 2 hrs after reperfusion). The liver and kidney sections were obtained 24 hrs after reperfusion. In the liver, F-actin is localized in basolateral membranes (arrow) and bile canalicular membranes (circle). Transverse sections of bile canaliculi are seen as typical dots. Liver ischemia reperfusion causes severe disruptions of F-actin in both basolateral membranes (arrow) and bile canalicular membranes (circle). In the kidney, F-actin stains of proximal tubular epithelial cells are prominent in the brush border from sham-operated mice (*) which is severely degraded in the kidneys of mice subjected to liver IR (#). Photographs are representative of 6 independent experiments. (B) Quantification of mean fluorescent hepatocyte F-actin intensity (N=5), number of intact bile canalicular membranes (N=5), mean fluorescent intensities of bile canalicular membranes (N=5) and renal proximal tubule (N=5) F-actin intensity as measures of F-actin preservation in liver and kidney sections. *P<0.05 vs. Vehicle sham group. #P<0.05 vs. Vehicle IR group.
Discussion
The major finding of this study is that liver IR results in a significant depletion of plasma sphinganine 1-phosphate concentration without any change in plasma S1P concentration in mice. Moreover, exogenous sphinganine 1-phosphate treatment protected against hepatic and renal injury after liver IR. Exogenous sphinganine 1-phosphate treated mice subjected to liver IR show 1) reduced hepatic and renal necrosis as well as apoptosis, 2) decreased neutrophil infiltration into the liver and the kidney, 3) better preserved endothelial cell integrity of the liver and the kidney, 4) reduced expression of pro-inflammatory mRNAs in the liver and the kidney, 5) less increases in plasma TNF-α and IL-6 levels and 6) better preserved F-actin cytoskeleton structure after liver IR. Therefore, these results show that sphinganine 1-phosphate has protective effects against liver as well as kidney injury caused by hepatic IR.
Sphingolipids including sphingosine and sphinganine (dihydrosphingosine) are ubiquitous but essential structural as well as functional components of the plasma membrane. In addition, sphingolipid metabolites have important biological roles in various physiological as well as pathophysiological events (8) (Figure 11). Sphingosine kinase (SK) is a conserved lipid kinase with two mammalian isoforms (SK1 and SK2), which catalyzes the ATP-dependent phosphorylation of sphingosine and sphinganine to form S1P and sphinganine 1-phosphate, respectively (19, 20). SK1 is found in the cytosol of eukaryotic cells and translocates to the plasma membrane upon activation. SK2 is localized in the nucleus. S1P has been extensively studied and has emerged as an important mediator of a variety of biological processes, including cell growth and survival and inflammation (6). Furthermore, S1P produces powerful anti-apoptotic and pro-survival signaling in endothelial cells (21). Therefore, we originally postulated that perhaps depletion of an endogenous molecule well known to protect against endothelial cell dysfunction (such as S1P) may explain increased renal endothelial cell damage with subsequent development of AKI after liver IR. Therefore, we utilized HPLC to measure plasma levels of S1P in mice after liver IR or sham-operation. Plasma levels of S1P did not change after liver IR. However, we were surprised to discover that the plasma levels of a related sphingolipid metabolite, sphinganine 1-phosphate decreased significantly after liver IR. In contrast to the well characterized biological role of S1P (22), sphinganine 1-phosphate has not been widely studied and little is known about its function.
Figure 11.
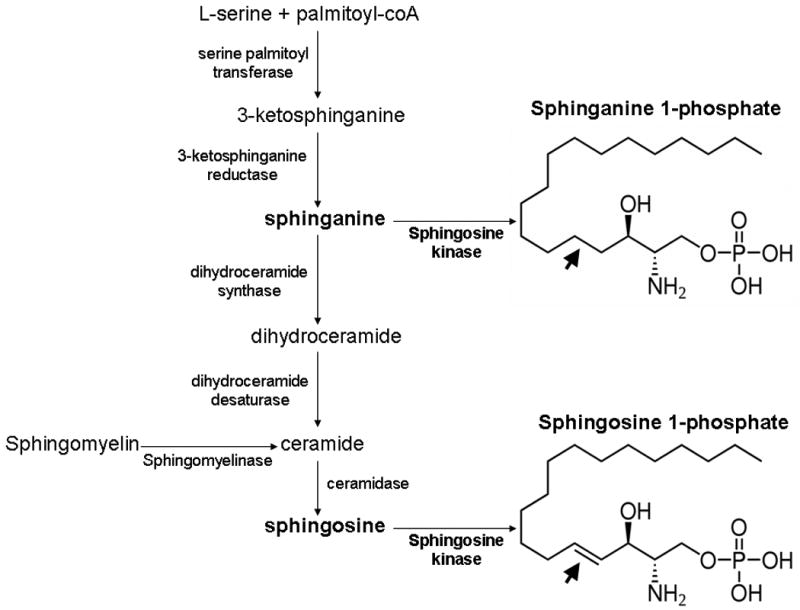
The de novo biosynthetic pathways for the synthesis of sphinganine 1-phosphate and sphingosine 1-phosphate. Note that sphingosine is formed after turnover of ceramide and after sphinganine metabolism. Sphinganine can either be phosphorylated to form sphinganine 1-phosphate or converted to dihydroceramide. The structural differences between sphinganine-1-phosphate and sphingosine-1-phosphate are also shown. The double bond in sphingosine 1-phosphate is lacking in sphinganine 1-phosphate (arrows).
The previous studies involving sphinganine pathways almost entirely deal with fumonisin B1 (a major mycotoxin produced by several species of Fusarium molds) toxicity. Sphinganine metabolism products including sphinganine 1-phosphate is known to accumulate after fumonisin B1 exposure as fumonisin B1 is a potent inhibitor of ceramide synthase (23). Although sphinganine 1-phosphate is structurally similar to S1P, sphinganine 1-phosphate differs from S1P by being cell impermeable (24) and lacks the trans double bond at the 4 position (25). We propose that sphinganine 1-phosphate is biologically active, is depleted after massive liver IR injury (most likely due to severe depletion of ATP, a necessary cofactor of the SK enzyme) and may have important cytoprotective functions to defend against endothelial cell dysfunction after liver IR. Liver IR results in depletion of systemic as well as hepatic ATP levels which may decrease the activities and/or efficiencies of SK. However, it is unclear as to why selective depletion of plasma sphinganine 1-phosphate and not S1P occurs after liver IR as both sphinganine 1-phosphate and S1P synthesis depend on the same enzyme, SK. Perhaps the localization of SK enzyme may explain this selective depletion of sphinganine 1-phosphate after liver IR. SK1 exists in cytosol as well as plasma membrane and translocation occurs after activation. SK2 is a nuclear enzyme. Perhaps, membrane bound SK1 is responsible for sphinganine 1-phosphate formation whereas cytosolic SK1 and nuclear SK2 predominantly catalyze S1P formation. Preferential synthesis of sphinganine 1-phosphate over S1P has been demonstrated with SK1 overexpression (26). Berdyshev et al. have demonstrated that SK1 overexpression, but not SK2 overexpression, in several primary cells and cultured cell lines resulted in a predominant upregulation of sphinganine 1-phosphate synthesis relative to S1P (26).
The detailed mechanisms of sphinganine 1-phosphate-mediated anti-necrotic and anti-inflammatory effects remain to be elucidated. Although S1P→S1P receptor signaling has been extensively studied, sphinganine 1-phosphate-mediated cell signaling has not been studied in detail. Since the structures of sphinganine 1-phosphate and S1P are similar, we postulated and provide evidence that that sphinganine 1-phosphate acting on the cell surface S1P receptors mediates hepatic and renal protection after liver IR. Five S1P receptors (EDG1/S1P1, EDG5/S1P2, EDG3/S1P3, EDG6/S1P4, and EDG8/S1P5) have been characterized with each coupling to heterotrimeric G-proteins with subsequent activation of downstream signaling molecules including ERK MAPK, phospholipase C/D and AKT (8). Some of the well known properties of S1P receptor activations include immunity modulation, cell migration, and angiogenesis. For example, S1P1 receptor mediates cortical actin reassembly via Rac activation and leads to endothelial cell barrier enhancement, whereas S1P3 receptor activation in pulmonary epithelial cells leads to disruption of tight junctions, possibly by activating Rho, resulting in increased lung vascular permeability (27). Protective effects of S1P receptor signaling to protect against liver and kidney injury have been demonstrated previously in vivo. For example, FTY720 (2-amino-2-[2-(4-octylphenyl)ethyl]propane-1,3-diol) protected against liver IR in rats presumably via activation of S1P receptor modulation (28). S1P receptor modulation also has been shown to beneficially modulate renal function after IR (8). Several S1P receptor agonists, including S1P, FTY-720 and SEW-2871 (5-[4-Phenyl-5-(trifluoromethyl)thiophen-2-yl]-3-[3-(trifluoromethyl)phenyl]-1,2,4-oxadiazole, a selective ligand for S1P1 receptor), protected against renal IR injury in vivo via reducing renal proximal tubule influx of T-lymphocytes with subsequent reduction in necrosis and inflammation (14, 29, 30).
Sphinganine 1-phosphate is known to bind to some S1P receptor subtypes including S1P1 as well as S1P4 subtypes with varying affinity (25, 31). We provide evidence that sphinganine 1-phosphate-mediated liver and kidney protection after liver IR is S1P receptor-mediated as VPC23019 completely abolished sphinganine 1-phpsphate-mediated hepatic and renal protection after liver IR. VPC23019 behaves as a competitive antagonist at both the S1P1 and S1P3 receptors, although it is ∼50-fold more selective for the S1P1 vs. S1P3 receptor but is completely inactive at the S1P2 receptor (9). More detailed studies examining the specific S1P receptor subtype targeting by sphinganine 1-phosphate are needed.
Although we saw global apoptotic changes in the liver after IR, the pattern of apoptosis in the kidney after liver IR was unique (and different compared to the pattern observed after renal IR) in that endothelial cell apoptosis predominated (On Line Supplemental Digital Content Figure 2B and Ref (5)). Our experimental results directly support the role of endothelial protection with sphinganine 1-phosphate in protecting against renal and hepatic injury after liver IR. We saw dramatic increases in TUNEL positive kidney peri-tubular capillary endothelial cells (On Line Supplemental Digital Content Figure 2B) after liver IR (with almost complete sparing of renal proximal tubule apoptosis) and sphinganine 1-phosphate treatment produced drastic reduction in the apoptosis of these peri-capillary endothelial cells. In addition, significantly impairment of liver and kidney vascular integrity were observed after liver IR as these organs appear enlarged with significantly high EBD extravasation (Figure 6). Reduction in renal endothelial apoptosis would lead to better preserved vascular permeability, reduced neutrophil infiltration with subsequently reduced proximal tubule cell death. All of these changes were observed in the kidneys of sphinganine 1-phosphate treated mice subjected to liver IR.
We tested a wide range of sphinganine-1-phosphate doses in our study and found that sphinganine 1-phosphate produces biphasic effects in the liver and kidney after liver IR: protection at lower does and loss of protection at higher doses. The reason for the biphasic effects of sphinganine 1-phosphate in producing organ protection is not clear. Perhaps, with higher doses, the enzymatic reactions may favor the production of toxic precursors in the sphingolipid metabolic pathways including sphinganine, sphingosine and ceramide (32).
The cell type(s) as well as in vitro cellular mechanism(s) of sphinganine 1-phopshate-mediated liver and kidney protection remains to be elucidated. It is possible that sphinganine 1-phosphate targets endothelial cells to modulate the response to inflammatory or hypoxic stress in the kidney since we observed significant renal endothelial cell protection. Furthermore, sphinganine 1-phosphate may reduce leukocyte (macrophages, lymphocytes and/or neutrophils)-mediated pro-inflammatory responses. Characterizing the cellular mechanism(s) underlying the protective effects of sphinganine-1-phosphate remains to be investigated in future in vitro studies.
In conclusion, we demonstrate for the first time that sphinganine 1-phosphate, a relatively unknown sphingolipid, is severely depleted after liver IR injury in mice. This is also the first study to demonstrate the protective effects of exogenous sphinganine 1-phosphate against both hepatic and renal dysfunction induced with hepatic IR injury presumably via S1P receptor type 1. Our study demonstrates that sphinganine 1-phosphate attenuates both hepatic and renal injury after liver IR by reducing necrosis, inflammation and apoptosis of both organs. Sphinganine 1-phosphate treatment led to better preserved F-actin cytoskeleton, improved vascular integrity and reduced neutrophil infiltration of the liver as well as the kidney after liver IR. Therefore, sphinganine 1-phosphate may be considered as a promising pharmacological strategy for diagnosing as well as protecting both liver and kidney function after hepatic IR.
Supplementary Material
#1. Detailed methods including surgery and anesthesia protocols, immunohistochemistry and RNA isolation are available as on line supplemtal digital content.
#2. Supplemental Digital Content Figure 1. Representative photomicrographs of immunohistochemistry for neutrophils (arrows indicating brown granules) in liver (200×, A) and kidney (400×, B) sections. C57BL/6 mice were subjected to sham-operation or to liver ischemia reperfusion after vehicle- or sphinganine 1-phosphate treatment (0.1 mg/kg i.v. immediately prior to reperfusion and 0.2 mg/kg s.c. 2 hrs after reperfusion) and the liver and kidney sections were obtained 24 hrs after reperfusion. Photographs are representative of 6 independent experiments.
#3. Supplemental Digital Content Figure 2. Representative fluorescent photomicrographs of liver and kidney sections illustrate apoptotic nuclei (TUNEL fluorescent stain, magnification 100×). C57BL/6 mice were subjected to sham-operation (sham) or to liver IR after vehicle- or sphinganine 1-phosphate treatment (0.1 mg/kg i.v. immediately prior to reperfusion and 0.2 mg/kg s.c. 2 hrs after reperfusion). The liver (A) and kidney (B) sections were obtained 24 hrs after reperfusion. Photographs are representative of 6 independent experiments. Inserts show higher magnification of image showing TUNEL positive cells. In the kidney, endothelial cells and not proximal tubule cells underwent apoptosis.
#4. Supplemental Digital Content Figure 3. Representative gel images demonstrating DNA laddering as an index of DNA fragmentations in the liver and kidney tissues. C57BL/6 mice were subjected to sham-operation (sham) or to liver IR after vehicle- or sphinganine 1-phosphate treatment (0.1 mg/kg i.v. immediately prior to reperfusion and 0.2 mg/kg s.c. 2 hrs after reperfusion). The liver and kidney tissues were obtained 24 hrs after reperfusion. Photographs are representative of 5 independent experiments.
Acknowledgments
This work was supported by National Institute of Health Grant RO1 DK-58547 and RO1 GM-067081.
Footnotes
Disclosure: None of the authors had financial interests or ties to commercial companies.
This work was selected and presented as one of the finalists for the New Investigator Award Competition at the 32nd Annual Conference on Shock, June 6-9, 2009, San Antonio, TX.
References
- 1.Kupiec-Weglinski JW, Busuttil RW. Ischemia and reperfusion injury in liver transplantation. Transplant Proc. 2005;37:1653–1656. doi: 10.1016/j.transproceed.2005.03.134. [DOI] [PubMed] [Google Scholar]
- 2.Kortgen A, Paxian M, Werth M, Recknagel P, Rauchfu F, Lupp A, Krenn CG, Muller D, Claus RA, Reinhart K, Settmacher U, Bauer M. Prospective assessment of hepatic function and mechanisms of dysfunction in the critically ill. Shock. 2009 doi: 10.1097/SHK.0b013e31819d8204. [DOI] [PubMed] [Google Scholar]
- 3.Arumugam TV, Okun E, Tang SC, Thundyil J, Taylor SM, Woodruff TM. Toll-like receptors in ischemia-reperfusion injury. Shock. 2009;32:4–16. doi: 10.1097/SHK.0b013e318193e333. [DOI] [PubMed] [Google Scholar]
- 4.Davis CL, Gonwa TA, Wilkinson AH. Pathophysiology of renal disease associated with liver disorders: implications for liver transplantation. Part I. Liver Transpl. 2002;8:91–109. doi: 10.1053/jlts.2002.31516. [DOI] [PubMed] [Google Scholar]
- 5.Lee HT, Park SW, Kim M, D'Agati VD. Acute kidney injury after hepatic ischemia and reperfusion injury in mice. Lab Invest. 2009;89:196–208. doi: 10.1038/labinvest.2008.124. [DOI] [PMC free article] [PubMed] [Google Scholar]
- 6.Hait NC, Oskeritzian CA, Paugh SW, Milstien S, Spiegel S. Sphingosine kinases, sphingosine 1-phosphate, apoptosis and diseases. Biochim Biophys Acta. 2006;1758:2016–2026. doi: 10.1016/j.bbamem.2006.08.007. [DOI] [PubMed] [Google Scholar]
- 7.Maceyka M, Milstien S, Spiegel S. Sphingosine kinases, sphingosine-1-phosphate and sphingolipidomics. Prostaglandins Other Lipid Mediat. 2005;77:15–22. doi: 10.1016/j.prostaglandins.2004.09.010. [DOI] [PubMed] [Google Scholar]
- 8.Jo SK, Bajwa A, Awad AS, Lynch KR, Okusa MD. Sphingosine-1-phosphate receptors: biology and therapeutic potential in kidney disease. Kidney Int. 2008;73:1220–1230. doi: 10.1038/ki.2008.34. [DOI] [PMC free article] [PubMed] [Google Scholar]
- 9.Davis MD, Clemens JJ, Macdonald TL, Lynch KR. Sphingosine 1-phosphate analogs as receptor antagonists. J Biol Chem. 2005;280:9833–9841. doi: 10.1074/jbc.M412356200. [DOI] [PubMed] [Google Scholar]
- 10.Min JK, Yoo HS, Lee EY, Lee WJ, Lee YM. Simultaneous quantitative analysis of sphingoid base 1-phosphates in biological samples by o-phthalaldehyde precolumn derivatization after dephosphorylation with alkaline phosphatase. Anal Biochem. 2002;303:167–175. doi: 10.1006/abio.2002.5579. [DOI] [PubMed] [Google Scholar]
- 11.SLOT C. Plasma creatinine determination. A new and specific Jaffe reaction method. Scand J Clin Lab Invest. 1965;17:381–387. doi: 10.3109/00365516509077065. [DOI] [PubMed] [Google Scholar]
- 12.Suzuki S, Toledo-Pereyra LH, Rodriguez FJ, Cejalvo D. Neutrophil infiltration as an important factor in liver ischemia and reperfusion injury. Modulating effects of FK506 and cyclosporine. Transplantation. 1993;55:1265–1272. doi: 10.1097/00007890-199306000-00011. [DOI] [PubMed] [Google Scholar]
- 13.Kim J, Kim M, Song JH, Lee HT. Endogenous A1 adenosine receptors protect against hepatic ischemia reperfusion injury in mice. Liver Transpl. 2008;14:845–854. doi: 10.1002/lt.21432. [DOI] [PubMed] [Google Scholar]
- 14.Awad AS, Ye H, Huang L, Li L, Foss FW, Jr, Macdonald TL, Lynch KR, Okusa MD. Selective sphingosine 1-phosphate 1 receptor activation reduces ischemia-reperfusion injury in mouse kidney. Am J Physiol Renal Physiol. 2006;290:F1516–F1524. doi: 10.1152/ajprenal.00311.2005. [DOI] [PubMed] [Google Scholar]
- 15.Herrmann M, Lorenz HM, Voll R, Grunke M, Woith W, Kalden JR. A rapid and simple method for the isolation of apoptotic DNA fragments. Nucleic Acids Res. 1994;22:5506–5507. doi: 10.1093/nar/22.24.5506. [DOI] [PMC free article] [PubMed] [Google Scholar]
- 16.Lee HT, Xu H, Siegel CD, Krichevsky IE. Local Anesthetics Induce Human Renal Cell Apoptosis. Am J Nephrol. 2003;23:129–139. doi: 10.1159/000069304. [DOI] [PubMed] [Google Scholar]
- 17.Molitoris BA. Putting the actin cytoskeleton into perspective: pathophysiology of ischemic alterations. Am J Physiol. 1997;272:F430–F433. doi: 10.1152/ajprenal.1997.272.4.F430. [DOI] [PubMed] [Google Scholar]
- 18.Suzuki S, Toledo-Pereyra LH, Rodriguez FJ, Cejalvo D. Neutrophil infiltration as an important factor in liver ischemia and reperfusion injury. Modulating effects of FK506 and cyclosporine. Transplantation. 1993;55:1265–1272. doi: 10.1097/00007890-199306000-00011. [DOI] [PubMed] [Google Scholar]
- 19.Le Stunff H, Milstien S, Spiegel S. Generation and metabolism of bioactive sphingosine-1-phosphate. J Cell Biochem. 2004;92:882–899. doi: 10.1002/jcb.20097. [DOI] [PubMed] [Google Scholar]
- 20.Liu H, Chakravarty D, Maceyka M, Milstien S, Spiegel S. Sphingosine kinases: a novel family of lipid kinases. Prog Nucleic Acid Res Mol Biol. 2002;71:493–511. doi: 10.1016/s0079-6603(02)71049-0. [DOI] [PubMed] [Google Scholar]
- 21.Venkataraman K, Thangada S, Michaud J, Oo ML, Ai Y, Lee YM, Wu M, Parikh NS, Khan F, Proia RL, Hla T. Extracellular export of sphingosine kinase-1a contributes to the vascular S1P gradient. Biochem J. 2006;397:461–471. doi: 10.1042/BJ20060251. [DOI] [PMC free article] [PubMed] [Google Scholar]
- 22.Merrill AH, Jr, Schmelz EM, Dillehay DL, Spiegel S, Shayman JA, Schroeder JJ, Riley RT, Voss KA, Wang E. Sphingolipids--the enigmatic lipid class: biochemistry, physiology, and pathophysiology. Toxicol Appl Pharmacol. 1997;142:208–225. doi: 10.1006/taap.1996.8029. [DOI] [PubMed] [Google Scholar]
- 23.Kim DH, Lee YS, Lee YM, Oh S, Yun YP, Yoo HS. Elevation of sphingoid base 1-phosphate as a potential contributor to hepatotoxicity in fumonisin B1-exposed mice. Arch Pharm Res. 2007;30:962–969. doi: 10.1007/BF02993964. [DOI] [PubMed] [Google Scholar]
- 24.Gonzalez-Diez M, Rodriguez C, Badimon L, Martinez-Gonzalez J. Prostacyclin induction by high-density lipoprotein (HDL) in vascular smooth muscle cells depends on sphingosine 1-phosphate receptors: effect of simvastatin. Thromb Haemost. 2008;100:119–126. doi: 10.1160/TH07-11-0675. [DOI] [PubMed] [Google Scholar]
- 25.Fossetta J, Deno G, Gonsiorek W, Fan X, Lavey B, Das P, Lunn C, Zavodny PJ, Lundell D, Hipkin RW. Pharmacological characterization of human S1P4 using a novel radioligand, [4,5-3H]-dihydrosphingosine-1-phosphate. Br J Pharmacol. 2004;142:851–860. doi: 10.1038/sj.bjp.0705856. [DOI] [PMC free article] [PubMed] [Google Scholar]
- 26.Berdyshev EV, Gorshkova IA, Usatyuk P, Zhao Y, Saatian B, Hubbard W, Natarajan V. De novo biosynthesis of dihydrosphingosine-1-phosphate by sphingosine kinase 1 in mammalian cells. Cell Signal. 2006;18:1779–1792. doi: 10.1016/j.cellsig.2006.01.018. [DOI] [PubMed] [Google Scholar]
- 27.Shikata Y, Birukov KG, Garcia JG. S1P induces FA remodeling in human pulmonary endothelial cells: role of Rac, GIT1, FAK, and paxillin. J Appl Physiol. 2003;94:1193–1203. doi: 10.1152/japplphysiol.00690.2002. [DOI] [PubMed] [Google Scholar]
- 28.Anselmo D, Amersi FF, Shen XD, Gao F, Katori M, Ke B, Lassman C, Coito AJ, Brinkmann V, Busuttil RW, Kupiec-Weglinski JW, Farmer DG. FTY720: a novel approach to the treatment of hepatic ischemia-reperfusion injury. Transplant Proc. 2002;34:1467–1468. doi: 10.1016/s0041-1345(02)02933-0. [DOI] [PubMed] [Google Scholar]
- 29.Lai LW, Yong KC, Igarashi S, Lien YH. A sphingosine-1-phosphate type 1 receptor agonist inhibits the early T-cell transient following renal ischemia-reperfusion injury. Kidney Int. 2007 doi: 10.1038/sj.ki.5002203. [DOI] [PubMed] [Google Scholar]
- 30.Lien YH, Yong KC, Cho C, Igarashi S, Lai LW. S1P(1)-selective agonist, SEW2871, ameliorates ischemic acute renal failure. Kidney Int. 2006;69:1601–1608. doi: 10.1038/sj.ki.5000360. [DOI] [PubMed] [Google Scholar]
- 31.Van Brocklyn JR, Lee MJ, Menzeleev R, Olivera A, Edsall L, Cuvillier O, Thomas DM, Coopman PJ, Thangada S, Liu CH, Hla T, Spiegel S. Dual actions of sphingosine-1-phosphate: extracellular through the Gi-coupled receptor Edg-1 and intracellular to regulate proliferation and survival. J Cell Biol. 1998;142:229–240. doi: 10.1083/jcb.142.1.229. [DOI] [PMC free article] [PubMed] [Google Scholar]
- 32.Iwata M, Herrington J, Zager RA. Sphingosine: a mediator of acute renal tubular injury and subsequent cytoresistance. Proc Natl Acad Sci U S A. 1995;92:8970–8974. doi: 10.1073/pnas.92.19.8970. [DOI] [PMC free article] [PubMed] [Google Scholar]
Associated Data
This section collects any data citations, data availability statements, or supplementary materials included in this article.
Supplementary Materials
#1. Detailed methods including surgery and anesthesia protocols, immunohistochemistry and RNA isolation are available as on line supplemtal digital content.
#2. Supplemental Digital Content Figure 1. Representative photomicrographs of immunohistochemistry for neutrophils (arrows indicating brown granules) in liver (200×, A) and kidney (400×, B) sections. C57BL/6 mice were subjected to sham-operation or to liver ischemia reperfusion after vehicle- or sphinganine 1-phosphate treatment (0.1 mg/kg i.v. immediately prior to reperfusion and 0.2 mg/kg s.c. 2 hrs after reperfusion) and the liver and kidney sections were obtained 24 hrs after reperfusion. Photographs are representative of 6 independent experiments.
#3. Supplemental Digital Content Figure 2. Representative fluorescent photomicrographs of liver and kidney sections illustrate apoptotic nuclei (TUNEL fluorescent stain, magnification 100×). C57BL/6 mice were subjected to sham-operation (sham) or to liver IR after vehicle- or sphinganine 1-phosphate treatment (0.1 mg/kg i.v. immediately prior to reperfusion and 0.2 mg/kg s.c. 2 hrs after reperfusion). The liver (A) and kidney (B) sections were obtained 24 hrs after reperfusion. Photographs are representative of 6 independent experiments. Inserts show higher magnification of image showing TUNEL positive cells. In the kidney, endothelial cells and not proximal tubule cells underwent apoptosis.
#4. Supplemental Digital Content Figure 3. Representative gel images demonstrating DNA laddering as an index of DNA fragmentations in the liver and kidney tissues. C57BL/6 mice were subjected to sham-operation (sham) or to liver IR after vehicle- or sphinganine 1-phosphate treatment (0.1 mg/kg i.v. immediately prior to reperfusion and 0.2 mg/kg s.c. 2 hrs after reperfusion). The liver and kidney tissues were obtained 24 hrs after reperfusion. Photographs are representative of 5 independent experiments.


