

Abstract
Impulsivity, inattention and poor behavioral inhibition are common deficits in PBD (Pediatric Bipolar Disorder) and ADHD (Attention Deficit Hyperactivity Disorder). This study aimed to identify similarities and differences in the neural substrate of response inhibition deficits that are associated with these disorders. A functional magnetic resonance imaging (fMRI) study was conducted on 15 un-medicated PBD patients (Type I, manic/mixed), 11 un-medicated ADHD patients, and 15 healthy controls (HC) (mean age = 13.5 years; S.D. = 3.5). A Response Inhibition Task examined the ability to inhibit a motor response to a target when a stop cue appeared shortly after. The PBD and ADHD group did not differ on behavioral performance, although both groups were less accurate than the HC group. fMRI findings showed that for trials requiring response inhibition, the ADHD group, relative to the PBD and HC groups, demonstrated reduced activation in both ventrolateral (VLPFC) and dorsolateral (DLPFC) prefrontal cortex, and increased bilateral caudate activation compared to HC. The PBD group, relative to HC, showed decreased activation in left VLPFC, at the junction of inferior and middle frontal gyri, and in right anterior cingulate cortex (ACC). Prefrontal dysfunction was observed in both the ADHD and PBD groups relative to HC, although it was more extensive and accompanied by sub-cortical over activity in ADHD.
Keywords: Functional magnetic resonance imaging (fMRI), Bipolar, Attention, Child, Development
1. Introduction
Pediatric Bipolar Disorder (PBD) and Attention Deficit Hyperactivity Disorder (ADHD) have distinct as well as overlapping clinical symptoms. PBD is characterized by emotional dysregulation, elated mood, irritability, increased energy and disinhibition (Geller et al., 1998; Pavuluri et al., 2007; Pavuluri and Passarotti, 2008). ADHD is characterized by motor hyperactivity, inattention, impulsivity and poor behavioral control (American Psychiatric Association, 1994; Barkley, 1997).
Neuropsychological studies often report similar neurocognitive deficits in patients with ADHD and PBD. Patients with PBD have deficits in cognitive flexibility, sustained attention and verbal working memory, independent of illness status (Dickstein et al., 2005; Pavuluri et al., 2006). Similarly, ADHD patients exhibit deficits in executive functions, attention, vigilance, working memory, planning and response inhibition (Doyle et al., 2005; Rubia et al., 2001; Seidman et al., 2004). Moreover, recent studies also suggest that adolescents with ADHD may present more severe neurocognitive impairment than those with PBD, with or without comorbid ADHD diagnosis (Rucklidge, 2006; Galanter and Leibenluft, 2008). Given overlapping clinical symptoms, neurocognitive impairment, and the high levels of comorbid ADHD in patients with PBD (Geller et al., 1998; Biederman et al., 2000) there is a need for improved understanding of the similar and distinct neural substrates of these two developmental disorders.
Studies of adolescents (Casey et al., 1997; Rubia et al., 1999) with ADHD indicate dorsolateral prefrontal cortex (DLPFC), ventrolateral prefrontal cortex (VLPFC) and dorsal striatum as regions of dysfunction in this disorder. For instance, recent fMRI studies with adolescents that examined selective attention using the Flanker Task (Vaidya et al., 1998), and response inhibition using a Go-nogo Task (Casey et al., 1997; Durston et al., 2003, 2006; Tamm et al., 2004) or a Stop-Signal Task (Plitzka et al., 2006; Rubia et al., 1999) found decreased activation in prefrontal regions such as the VLPFC, and anterior cingulate cortex (ACC), and in mesial prefrontal cortex and caudate (Rubia et al., 1999). In addition to dysfunction of ventral fronto-striatal circuits, Durston et al. (2003) also found increased recruitment of posterior temporal and parietal regions in children with ADHD as compared to age matched healthy controls (HC) during a Go-nogo task, which has been considered a compensatory phenomenon for prefrontal cortex (PFC) underactivity (Durston et al., 2003; Vaidya et al., 2005). Findings of functional fronto-striatal abnormalities are also in line with studies showing reduced tissue volumes in DLPFC and caudate in pediatric populations with ADHD (Castellanos et al., 1994, 1996, 2002; Filipek et al., 1997; Seidman et al., 2006).
With regard to PBD, a recent study using the Stop-Signal Task (Leibenluft et al., 2007) found that during failed Stop trials children with PBD, regardless of comorbid ADHD or medication, showed decreased activation in right VLPFC and bilateral striatum when compared to HC. Similarly, decreased VLPFC activation in children with PBD compared to HC was found by Pavuluri et al. (2008) during an emotional Stroop Task. In another study that employed a color-naming Stroop Task (Blumberg et al., 2003a), patients with PBD exhibited increased activation in putamen and thalamus compared to HC. Moreover, a growing number of studies are reporting dysfunction in rostral ACC, a region important for emotion regulation, in Pediatric Bipolar Disorder (Pavuluri et al., 2006; Malhi et al., 2005; see also Fountoulakis et al., 2008 for a review).
To delineate disorder-specific disturbances in functional brain systems that might account for behavioral control deficits (e.g., impulsivity, motor disinhibition) associated with both disorders, we contrasted brain activation in pediatric patients with PBD and with ADHD to that of HC using a Response Inhibition Task.
The main goal of the present study was to examine the neural underpinnings of motor inhibition as compared to motor response in patients with ADHD and PBD, rather than addressing the more specific case of response inhibition in the context of a pre-potent tendency to respond, like in a typical Stop-Signal Task (Logan et al., 1984), because we think it is important to first elucidate the basic circuits for motor inhibition versus execution in these patients. Therefore the present experimental task examined the ability to execute a motor response to a target, or inhibit a motor response that is already on the way, when a stop cue appears shortly after the target. Our primary fMRI comparison was therefore between blocks of trials requiring predominantly inhibition of a motor response already on the way, and blocks of trials that required predominantly a motor response.
We hypothesized that both the PBD and ADHD group would show impairment in response inhibition compared to healthy controls. Moreover, we predicted that compared to healthy controls the PFC and the fronto-striatal stream would be more affected in ADHD (Casey et al., 1997; Bush et al., 1999; Rubia et al., 1999), whereas the PBD group would exhibit more localized dysfunction in regulatory regions such as the VLPFC and pregenual ACC (Pavuluri and Passarotti, 2008; Pavuluri et al., 2008).
2. Methods
2.1. Subjects
All participants were recruited from the Child Psychiatry Clinics at the University of Illinois at Chicago (UIC) and from the neighboring community. All groupswere matched on age, sex, SES, race, handedness and IQ as estimatedwith the Wechsler Abbreviated Scale of Intelligence (WASI, 1999). Subject groups included 15 un-medicated patients with 133 PBD (Type I, manic: n = 5, and mixed: n = 5; Type II, hypomanic: n = 5) (8 F, 7 M; mean age: 13.2 ± 2.65; YMRS > 12), 11 un-medicated patients with ADHD (Type Combined) (5 F, 6 M; mean age: 13.09 ± 2.7), and 15 HC (8 F, 7 M; mean age: 14.13 ± 3.16). For children younger than age 15, an assentwas obtained, and for children older than age 15, an informed consent was obtained, together with consent of at least one parent or legal guardian. The study was approved by the Institutional Review Board at UIC. The subject and a parent or legal guardian were interviewed using the Washington University Schedule for Affective Disorders and Schizophrenia (z) (Geller et al., 1998) to determine the DSM-IV (DSM-IV, 1994) Axis I clinical diagnoses in the PBD and ADHD groups, and the absence of these and other psychiatric diagnoses in the HC group. A Parent ADHD Rating Scale IV-Revised (DuPaul et al., 1998) was also administered. Clinicians who were blind to Diagnosis rated all subjects on the Young Mania Rating Scale (YMRS; Young et al., 1978) and the Child Depression Rating Scale-Revised (CDRS-R; Poznanski et al., 1984).
Inclusion criteria for PBD and ADHD subjectswere: 10 to 18 years of age, a diagnosis of either bipolar disorder Type I with mania or hypomania or a diagnosis of ADHD, and consent to be scanned in a medication-free state for the study. Patients were studied if they were medication free, or when medication was withdrawn because the current regime was ineffective and awash-out prior to new medication was warranted. Overall 8 (58%) of the PBD patients [n = 6 (38%) on mood stabilizers; n = 4 (29%) on second generation antipsychotics (SGAs); n = 1 (9%) on stimulants; for n = 4 (24%) medication information n/a] and 6 (53%) of the ADHD patients [n = 5 (48%) on stimulants; n = 1 (12%) on SGAs; for n = 5 (40%) medication information n/a] had received medication in the past. Close clinical supervision and monitoring was provided during drug free periods, according to the approved IRB protocol. None of the patients were on Fluoxetine or Aripiprazole that warrant a longer washout period. Medication was reduced gradually over a three week period, so that patients were drug free for at least seven days prior to testing.
Axis I diagnoses of bipolar disorder Type I with mania or hypomania, and diagnosis of ADHD were based on DSM-IV criteria. ADHD comorbidity in patients with PBD was ruled out based on DSM-IV criteria. Other comorbid conditions in patients with PBD as assessed by the WASH-U-KSADS were: Generalized Anxiety Disorder: n = 2; Learning Disability: n = 1; Social Phobia: n = 1. Individuals with ADHD diagnosis did not exhibit any of these comorbid conditions. Exclusion criteria for all subjects were: a history of head trauma with loss of consciousness for more than 10 min, neurological symptoms, speech or hearing difficulties, an IQ score of less than 70, a history of substance abuse, a history of mental illness other than PBD for the bipolar group and other than ADHD for the ADHD group, or a history of mental illness for HC participants, and any contraindications to MRI scans (i.e., metal implants, retractors, braces, pregnancy, and claustrophobia).
2.2. fMRI session and Response Inhibition Task
For the present block-design fMRI study subjects performed a Response Inhibition Task that examined the ability to inhibit the execution of a motor response to a target when a stop cue is presented shortly after the target. While we are currently conducting event-related studies, this was an initial pilot study for which we adopted a block design to benefit from the greater statistical power and signal stability that a block design offers relative to an event-related design, especially with clinical populations who have more variable neural activation. Moreover, by summating neural activation over a time period including several consecutive trials, the block design enabled us to look at sustained activation in prefrontal cortex, that could be both preparatory and in response to specific stimuli, to a greater extent that is readily possible with an event-related design. Prior to the fMRI scanning session all our subjects underwent training and were familiarized with the MRI scanning protocols using a mock scanner at the Center for Cognitive Medicine, UIC. The task lasted 5 min and 57 s, and consisted of six experimental blocks, three of which were Go blocks (G) and three of which were Stop blocks (S), and 6 resting blocks (F) of 10 s fixation each. In Go blocks (G) 70% of the trials required a motor response, and 30% of the trials required to inhibit a motor response. Conversely, in Stop blocks (S) 70% of the trials required to inhibit a motor response and 30% required a motor response. Given that in Stop blocks most trials required response inhibition there was not a prepotency of go responses in these blocks. We constructed our trial blocks in this way because we wanted to examine behavioral control and active processes of response inhibition versus response execution per se, rather than inhibition processes in the context of pre-potent motor responses. Moreover we presented a 70/30 proportion of Go and Stop trials in the Go blocks and of Stop and Go trials in the Stop blocks so that subjects would not habituate to fixed trial presentation within a certain block. Each experimental block had 30 trials and lasted 49.5 s. The experimental and fixation blocks were pseudo-randomly interspersed as follows: G (F) S (F) G (F) S (F) G (F) S (F). Within each block, Go and Stop trials were pseudo-randomly presented.
Our task was similar to the one used by Brandeis et al. (1998), although we adopted different stop cue time parameters, and a different percentage of Stop and Go trials within a block. At the beginning of each trial a fixation cross appeared for 850 ms, and was followed on Go trials by a green airplane presented for 800 ms with equal probability either to the left or right side of an LCD screen. Subjects pressed a button on a response box with the right hand if the green plane appeared on the right side of the screen, and another button with the left hand if the plane appeared on the left (Fig. 1). On Stop trials, a Stop cue (a man holding a Stop sign in his hands) replaced the airplane with equal probability, either 250, 350 or 450 ms after the airplane appeared (Fig. 1), and subjects had to inhibit their motor responses as soon as they saw the stop cue. By introducing varying Stop signal delays we ensured that subjects paid attention on each trial and would not habituate to fixed trial conditions.
Fig. 1.
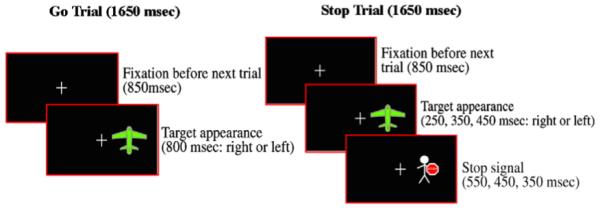
Illustration of Go and Stop trials for the Response Inhibition Task.
2.3. MRI protocol
The scanning session involved both gradient-echo-planar functional imaging and structural acquisitions which were performed with a 3.0 Tesla whole body scanner (Signa, General Electric Medical System, Milwaukee, WI). Functional images were acquired using echo-planar imaging, which is sensitive to regional alterations in blood flow via blood oxygenation level dependent (BOLD) contrast effects. We acquired twenty-five axial slices with the following functional scan parameters: TE = 25 ms; flip angle = 90°; field of view=20 × 20 cm2; acquisition matrix=64 × 64; TR = 2.5 s; slice thickness=5 mm with 1 mm gap. Contiguous anatomical images (three-dimensional spoiled gradient recalled [SPGR], 1.5 mm thick slices) were also acquired in the axial plane and later used to co-register and normalize the functional data.
2.4. Image processing and data analysis
FIASCO software (Functional Imaging Analysis Software-Computational Olio) (Eddy et al., 1996) was used to perform 3D motion estimation and correction, and to remove slow signal drift from functional images. We excluded individual volumes when head displacement from the median head position in the time series was greater than 1.5 mm, or head rotation from the median head position was greater than 0.5°. There were no significant group differences in the number of volumes retained after discarding those with motion artifact. Voxel-wise effect size (r) maps were calculated for each subject by contrasting activation for Stop and Go blocks to specifically examine group differences in the profiles of brain activation for response inhibition (Stop trials) versus response execution (Go trials). A Fisher z transform was applied to normalize the effect size maps (zr) (Rosenthal, 1991). Then we used an automated procedure in AFNI (Analysis of Functional Neuroimages) (Cox, 1996) to warp subjects’ zr-maps (effect size) and SPGR anatomical images into Talairach space (Talairach and Tournoux, 1988), and re-sample the original functional maps (3.125 × 3.125 × 6 mm grid) to an isotropic 3×3×3 mm grid.
A whole brain, voxel-wise omnibus ANOVA was carried out in AFNI on the within-subjects factor of ‘Stop versus Go’, (which directly contrasted activation for Stop versus Go blocks) and the between-subjects factor of Group (PBD, ADHD, HC). A significant Group effect was followed by step-down pair-wise comparisons in AFNI to clarify group differences in activation for the Stop versus Go conditions. Significant clusters of activation were identified using a contiguity threshold (minimum volume threshold = 270 mm3; minimum clustering radius: 3.1 mm) in order to maintain an experiment-wise Type 1 error rate of P<0.025 (corrected), based on AFNI’s AlphaSim Monte Carlo simulations that we restricted to in-brain voxels. A significant Group by Trial type interaction was further explored with planned t-tests within the ANOVA. To correct Type I error rates for multiple group comparisons (n = 3) we adopted a voxel-wise probability threshold for significance of P<0.016 (i.e., P = 0.05/3), and then identified clusters of voxels with significant group difference using a contiguity threshold (minimum volume threshold = 297 mm3; minimum clustering radius: 3.1 mm) that ensured an experiment-wise Type 1 error rate of P<0.02 (corrected), based on AFNI’s AlphaSim Monte Carlo simulations (Ward, 2000) that were restricted to in-brain voxels.
3. Results
3.1. Demographic and clinical data
Table 1 provides demographic and clinical data for study participants. Repeated measures ANOVAs revealed that the three study groups did not differ significantly for Age, [F(2,38) = 0.56, P<0.57], Estimated IQ [F(2,38) = 2.81, P<0.07], or SES [F(2,38) = 0.61, P<0.55]. Chi-square tests on Handedness, Sex, and Racial composition data did not reveal any significant group differences. As expected there were significant Group differences on the YMRS [F(2,38) = 47.84, P<0.000001] and the CDRS-R [F(2,38) = 82.47, P<0.000001] scores, as well as on the ADHD Rating Scale IV-R scores [F(2,38) = 32.44, P<0.000001] (Table 1). The PBD group had higher ratings of manic symptoms on the YMRS and CDRS-R than the other two groups, while the ADHD and PBD scores for the ADHD Rating Scale IV-R were similar and significantly higher than the HC group score (Table 1).
Table 1.
Demographic and clinical characteristics for PBD, ADHD and HC
| PBD (N=15) |
ADHD (N=11) |
HC (N=15) |
||
|---|---|---|---|---|
| Variable | Mean (S.D.) | Mean (S.D.) | Mean (S.D.) | (F), P |
| Age in years | 13.20 (2.65) | 13.09 (2.70) | 14.13 (3.16) | (0.56), P<0.57 |
| Estimated IQa | 100.10 (9.20) | 101.20 (11.60) | 107.60 (7.20) | (2.81), P<0.07 |
| SES | 2.00 (0.89) | 2.20 (1.30) | 1.85 (1.10) | (0.61), P<0.55 |
| YMRS | 18.60 (9.20) | 4.54 (4.90) | 1.80 (2.70) | (47.84), P<0.000001 PBD>ADHD (50.29), P<0.00001 PBD>HC (85.45), P<0.00001 ADHD=HC (1.99), P<0.17 |
| CDRS-R | 59.50 (15.10) | 21.90 (3.70) | 19.40 (2.80) | (82.47), P<0.000001 PBD>ADHD (104.40), P<0.00001 PBD>HC (134.74), P<0.00001 ADHD=HC (.21), P<0.64 |
| ADHD Rating Scale IV-R |
25.50 (13.72) | 25 (12.07) | 1.73 (2.50) | (32.44), P<0.000001 PBD=ADHD (.04), P<0.90 PBD>HC (52.01), P<0.00001 ADHDNHC (42.29), P<0.000003 |
| Variable | N (%) | N (%) | N (%) | df, χ2 (probability) |
|---|---|---|---|---|
| Sex | ||||
| Male | 7 (47%) | 6 (55%) | 7 (47%) | ADHD versus PBD:.012, df=1, P<0.05 |
| Female | 8 (53%) | 5 (45%) | 8 (53%) | ADHD versus HC: 0.12, df=1, P<0.05 PBD versus HC: 0.12, df=1, P<0.05 |
| Handedness | ||||
| Right | 14 (93%) | 10 (90%) | 15 (100%) | ADHD versus PBD:.05, df=1 P<0.05 |
| Left | 1 (7%) | 1 (10%) | 0 (0%) | ADHD versus HC: 0.1.42, df=1 P<0.05 PBD versus HC: 1.03, df=1, P<0.05 |
| Race composition | ||||
| Caucasian | 7 (47%) | 2 (18%) | 7 (47%) | ADHD versus PBD:.04, df=1 P<0.05 |
| Other | 8 (53%) | 9 (82%) | 8 (53%) | ADHD versus HC: 0.74, df=1 P<0.05 PBD versus HC: 0.54, df=1, P<0.05 |
Estimated with Wechsler Abbreviated Scale of Intelligence (WASI; Matrix Reasoning and Vocabulary Subtests); YMRS = Young Mania Rating Scale; CDRS-R = Child Depression Rating Scale-Revised; SES: Socioeconomic status; PBD = Pediatric Bipolar Disorder; ADHD = Attention Deficit Hyperactivity Disorder; HC = healthy controls.
3.2. Behavioral results
Behavioral results are illustrated in Table 2. A repeated measures ANOVA was carried out on Response Accuracy, with Group (PBD, ADHD, and HC) as the between-subjects factor, and Trial type as the within-subjects factor. In order to parallel fMRI data comparisons the main group comparison here was between Stop and Go trials, from Stop and Go trial blocks respectively. As a secondary analysis, we carried out an ANOVA on RT data, with group as a between-subjects factor and Trial type as a within-subjects factor. We compared Go trials from Go blocks, and incorrect Stop trials from Stop blocks (note that correct Stop trials had no key press), to explore whether RT may vary significantly depending on correct or incorrect motor responses. Full behavioral data from one bipolar patient were not available because of technical difficulties.
Table 2.
Response time and accuracy for Stop and Go trials in patients with Pediatric Bipolar Disorder (PBD), Attention Deficit Hyperactivity Disorder (ADHD), and in healthy controls (HC)
| PBD |
ADHD |
HC |
|
|---|---|---|---|
| Response Time (in ms) | Median (S.D.) | Median (S.D.) | Median (S.D.) |
| Go trials | 553 (91) | 556 (94) | 572 (98) |
| Incorrect Stop trials | 588 (112) | 553 (109) | 599 (112) |
| Accuracy (% correct) | % (S.D.) | % (S.D.) | % (S.D.) |
|---|---|---|---|
| Go trials | 85% (11%) | 84% 12%) | 91% (7%) |
| Stop trials | 74% (15%) | 78% (9%) | 82% (15%) |
3.2.1. Accuracy for Go and Stop trials
We observed a significant Group effect [F(2,37) = 3.34, P<0.04] in that both the PBD group (80%) [F(1,37) = 5.90, P<0.02] and the ADHD group (81%) [F(1,37) = 3.55, P<0.055, representing a trend for poorer performance] exhibited a lower accuracy than the HC group (87%), but did not differ from each other (F<1). Moreover, across groups performance was more accurate on Go trials (87%) than on Stop trials (78%) [F(1,37) = 9.78, P<0.003]. The interaction of Group by Trial type was not significant [F(1,37) = 0.28, P<0.75]. No other significant results were found.
3.2.2. RT for Go trials and incorrect Stop trials
A significant effect of Trial type [F(1,37) = 15.64, P<0.0003] indicated that RT was faster for correct Go trials (547 ms) than for incorrect Stop trials (580 ms). There was no significant interaction of Group by Trial type [F(2,37) = 0.39, P<0.68]. No other significant results were found.
3.3. fMRI results
A significant Group by Trial type interaction effect [F(2,38) = 4.18, P<0.025] was further explored with planned comparisons within the ANOVA, for which we corrected for multiple comparisons and applied cluster thresholding procedures that ensured an experiment-wise Type 1 error rate of P<0.02 (corrected) (see Methods). Within-group and between-group finndings are reported in Tables 3 and 4, respectively.
Table 3.
Talairach coordinates and t values for peak activation in significant P<0.025 with contiguity threshold) representing greater activation in each group for the Stop versus Go condition and vice-versa
| Stop-Go condition: within group comparisons. | |||||
|---|---|---|---|---|---|
| Talairach coordinates for peak values |
Areas | BA | Volume (mm3) |
t value for peak values |
|
| PBD: Stop>Go | 11, 22, 31 | R dorsal ACC | 32 | 351 | 4.74 |
| 51, 22, 23 | R middle FG | 46 | 432 | 2.69 | |
| −33, 21, 4 | L inferior FG | 45 | 324 | 4.10 | |
| 50, −70, 2 | R inferior TG | 37 | 5400 | 4.75 | |
| PBD: Go>Stop | 5, −7, 50 | R medial FG | 6 | 2916 | 3.49 |
| −7, −16, 50 | L medial FG | 6 | 621 | 3.53 | |
| −16, −1, 26 | L posterior CG | 24 | 810 | 3.61 | |
| −24, −15, 12 | L putamen | 675 | 3.09 | ||
| −34, −73, 47 | L superior parietal lobule | 7 | 12366 | 3.33 | |
| ADHD: Stop>Go | 47, −70, −4 | R middle OG | 37 | 1161 | 3.34 |
| 2, 41, 17 | R pregenual ACC | 32 | 594 | 3.18 | |
| −34, −76, −16 | L declive | 729 | 2.99 | ||
| ADHD: Go>Stop | 8, −4, 50 | R midcingulate | 24 | 2457 | 3.60 |
| 5, 35, 41 | R superior FG | 8 | 324 | 2.75 | |
| 41, 23, 2 | R inferior FG | 47 | 648 | 3.50 | |
| −52, 14, 23 | L inferior FG | 45 | 432 | 3.55 | |
| −10, −67, 56 | L superior parietal lobule | 7 | 378 | 3.12 | |
| HC: Stop>Go | 11, 59, 38 | R superior FG | 9 | 4401 | 2.98 |
| −52, 23, 11 | L inferior FG | 45 | 486 | 4.78 | |
| −43, 41, 29 | L middle FG | 46 | 324 | 3.64 | |
| 50, −46, 11 | R superior TG | 22 | 432 | 3.12 | |
| −61, −46, 20 | L superior TG | 22 | 675 | 3.02 | |
| HC: Go>Stop | −31, −4, 56 | L middle FG | 6 | 351 | 2.94 |
| 26, −34, 41 | R posterior CG | 31 | 945 | 3.61 | |
| 2, −40, 11 | R posterior inferior CG | 29 | 270 | 3.04 | |
| −13, −25, 11 | L thalamus/pulvinar | 513 | 2.82 | ||
| 23, −43, 11 | R caudate | 405 | 3.06 | ||
| 21, −0, 9 | R putamen | 2268 | 4.17 | ||
| −22, −0, 10 | L putamen | 891 | 4.21 | ||
| 29, −46, 53 | R inferior parietal lobule | 7 | 270 | 3.96 | |
Abbreviations: ACC: anterior cingulate cortex; CG: cingulated gyrus; FG: frontal gyrus ;TG: temporal gyrus; OG: occipital gyrus; HC: healthy control group; PBD: Pediatric cit Hyperactivity Disorder group; Bipolar Disorder group; ADHD: Attention-DefiBA: Brodmann’s area; L: Left; R: Right.
Table 4.
Talairach coordinates and t values for peak activation in significiant cluster (P<0.025 with contiguity threshold) representing greater activation in one group versus the other for the Stop versus Go condition and vice-versa
| Stop-Go condition: between group comparisons. | |||||
|---|---|---|---|---|---|
| Talairach coordinates for peak values |
Areas | BA | Volume (mm3) |
t value for peak values |
|
| PBD>ADHD | 44, 23, 2 | R inferior FG | 47 | 648 | 3.11 |
| −31, 23, 5 | L inferior FG | 45 | 270 | 3.44 | |
| 44, 20, 23 | R middle FG | 46 | 459 | 3.26 | |
| −43, 18, 21 | L middle FG | 46 | 432 | 2.90 | |
| 20, 38, 47 | R superior FG | 8 | 324 | 2.90 | |
| 56, −25, −7 | R middle TG | 21 | 324 | 2.34 | |
| −24, −67, 17 | L posterior CG | 31 | 378 | 3.12 | |
| ADHD>PBD | −10, −94, 17 | L middle OG | 18 | 648 | 3.22 |
| −25, −43, 71 | L post-central gyrus | 5 | 324 | 3.40 | |
| PBD>HC | 2, −40, 8 | R inferior posterior CG |
29 | 378 | 3.18 |
| 23, −34, 41 | R superior posterior CG |
31 | 297 | 3.57 | |
| −37, −31, 17 | L superior TG | 41 | 486 | 3.09 | |
| −49, −40, 26 | L inferior parietal lobule |
40 | 405 | 4.30 | |
| HC>PBD | 8, 44, 20 | R medial FG | 9 | 297 | 3.02 |
| −31, 59, 5 | L middle FG | 10 | 432 | 2.81 | |
| −44, 44, 9 | L inferior/middle FG | 46/47/10 | 351 | 3.90 | |
| 8, 38, 19 | R pregenual ACC | 32 | 297 | 3.02 | |
| ADHD>HC | 27, −40, 12 | R caudate tail | 324 | 3.18 | |
| −10, 8, 23 | L caudate | 378 | 2.83 | ||
| −4, −55, −1 | L anterior cerebellar vermis |
297 | 3.56 | ||
| HC>ADHD | 44, 20, 32 | R middle FG | 9 | 675 | 3.58 |
| 8, 50, 23 | R medial FG | 9 | 297 | 3.35 | |
| 17, 35, 50 | R superior FG | 8 | 756 | 3.25 | |
| −19, 56, 8 | L superior FG | 10 | 675 | 3.24 | |
| 47, 32, −10 | R inferior FG | 47 | 594 | 3.39 | |
| −53, 21,10 | L inferior FG | 45 | 540 | 3.66 | |
| −67, 5, 2 | L superior TG | 22 | 1674 | 3.17 | |
Abbreviations are the same as for Table 3.
3.3.1. Within-group differences for the Stop-Go condition (Table 3)
3.3.1.1. PBD group
The PBD group showed greater activation for the Stop than the Go condition in right middle frontal gyrus (DLPFC), left inferior frontal gyrus (VLPFC), right inferior temporal gyrus, and right dorsal ACC, and less activation for the Stop than the Go condition in bilateral medial frontal gyrus, left posterior cingulate gyrus, putamen, and superior parietal lobule.
3.3.1.2. ADHD group
The ADHD group showed greater activation for the Stop than the Go condition in right middle occipital gyrus and in right pregenual ACC, and less activation for the Stop than the Go condition in right midcingulate cortex, bilateral VLPFC, right superior frontal gyrus, and left superior parietal lobule.
3.3.1.3. HC group
The HC group exhibited greater activation for the Stop than the Go condition in right superior frontal gyrus, left VLPFC, and bilateral superior temporal gyrus, and less activation for the Stop than the Go condition in left middle frontal gyrus, left thalamus, right striatum, left putamen, right posterior cingulate gyrus, and right inferior parietal lobule.
3.3.2. Group differences for the Stop-Go condition (Table 4)
3.3.2.1. PBD versus HC
Compared to HC, the PBD group showed less activation in right medial and left middle frontal gyrus, left inferior/middle frontal gyrus (at the junction of BA 46/10) and in right pregenual ACC for the Stop versus Go condition (Fig. 2B), and greater activation in left superior temporal gyrus and inferior parietal lobule and right posterior cingulate cortex.
Fig. 2.
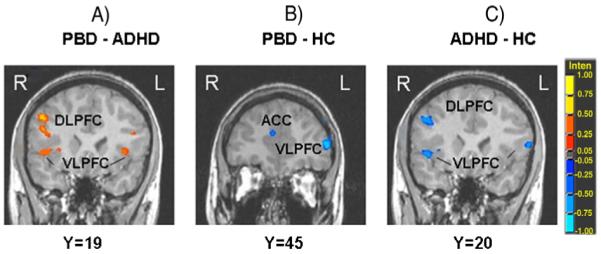
Between-group differences in significant clusters of brain activation for the Stop versus Go condition. A) PBD versus ADHD; B) PBD versus HC; C) ADHD versus HC. Red indicates greater activation in the first group compared to the second group. Blue indicates greater activation in the second group compared to the first group. Legend: PBD = Pediatric Bipolar Disorder group; ADHD = Attention Deficit Hyperactivity Disorder group; HC = healthy controls. VLPFC = ventrolateral prefrontal cortex; DLPFC = dorsolateral prefrontal cortex; ACC = anterior cingulate cortex. (For interpretation of the references to color in this figure legend, the reader is referred to the web version of this article.)
3.3.2.2. ADHD versus HC
The ADHD group showed less activation than HC in several prefrontal regions (right DLPFC, bilateral superior frontal gyrus, and bilateral VLPFC) (Fig. 2C), as well as in left superior temporal gyrus. The ADHD group showed greater activation than HC in bilateral caudate and left cerebellum (anterior vermis).
3.3.2.3. PBD versus ADHD
For the Stop versus Go condition, theADHD patients exhibited less activation than the PBD patients in prefrontal cortical regions including bilateral inferior frontal gyrus/VLPFC, bilateral middle frontal gyrus/DLPFC, and right superior frontal gyrus, in right middle temporal cortex, and in left posterior cingulate gyrus (Fig. 2A). The ADHD group exhibited greater activation than the PBD group only in occipital cortex and left post-central gyrus.
3.4. Correlation analyses
Pearson correlation analyses (2-tailed) were carried out to examine possible correlations, in each group, between symptom scores or accuracy on Stop trials, and brain activation in selected left and right ROIs (i.e., DLPFC, VLPFC, pregenual ACC, posterior cingulate cortex, caudate). Specific ROIs were selected based on the whole-brain ANOVA findings. To correct for multiple group comparisons we adopted a probability threshold for significance of P<0.02. No significant correlations were found for symptom scores. With regard to correlations with accuracy on stop trials, for the HC group there was a significant positive correlation between accuracy rates and right caudate activation (r = 0.58, P<0.02). No other significant results were found.
4. Discussion
This is one of the first fMRI studies to directly compare the neural substrates of motor response inhibition in pediatric patients with PBD and pediatric patients with ADHD. Moreover, one of the merits of this fMRI study is that it examines un-medicated patients, so that potential effects of medication could not confound interpretation of group differences. Our central findings indicate that while during the Response Inhibition Task both the PBD and ADHD groups, relative to HC, exhibited similar problems with behavioral inhibition and showed impairment in PFC functioning, the ADHD group presented nevertheless the most severe neural dysfunction. In fact, whereas both the HC and PBD groups engaged DLPFC and VLPFC for response inhibition, as was found in healthy subjects in previous studies (Casey et al., 1997; Rubia et al., 1999) the ADHD group did not engage these PFC regions on response inhibition trials. In fact, the ADHD group showed less activation than both the HC and PBD group in VLPFC and DLPFC. Moreover, compared to the HC group, while the ADHD group exhibited increased bilateral caudate and left cerebellar activation, the PBD group showed decreased activation in a left ventrolateral prefrontal region at the junction of BA 46/47/10, and in right pregenual ACC. Thus, the present findings provide evidence that despite similar problems in behavioral control, the severity and nature of the underlying pathophysiology is distinct in these two disorders.
4.1. Fronto-striatal dysfunction in ADHD patients compared to HC
During response inhibition trials, the ADHD group, relative to HC, showed reduced activation in prefrontal (DLPFC and VLPFC) and temporal regions, coupled with increased activation in striatal and cerebellar regions (anterior vermis). The DLPFC, with its direct connections to the basal ganglia (Alexander et al., 1986), is part of a distributed neural network supporting the selection and suppression of motor responses (Garavan et al., 2002). Also the VLPFC plays a crucial role in response inhibition and interference suppression (Konishi et al., 1999; Rubia et al., 2001; Menon et al., 2001). The finding of reduced VLPFC and DLPFC engagement in the ADHD group in the current study is in line with these established functional roles of fronto-striatal systems, and also parallels neuropsychological evidence of ADHD deficits in attention and response inhibition (Barkley et al., 1997; Seidman et al., 2004), fMRI studies probing response inhibition and interference control in ADHD (Casey et al., 1997; Rubia et al., 1999; Tamm et al., 2004), and volumetric studies in developmental ADHD populations (Castellanos et al., 1994; Castellanos et al., 1996, 2002; Filipek et al., 1997) that have implicated fronto-striatal dysfunction as a core biological feature of ADHD.
Different from previous fMRI studies that found reduced caudate activation in ADHD children as compared to HC (Durston et al., 2003; Rubia et al., 1999; Vaidya et al., 2005; Silk et al., 2005) the present study found increased caudate activation in the ADHD group compared to HC. While this discrepancy in results warrants further investigations, one possible explanation is that the differing results are due to the use of different paradigms, and consequently different strategies to perform the behavioral tasks. For example, compared to the studies cited above, this block-design study presented a higher proportion of stop trials in the stop blocks that may have required a sustained preparatory state of response inhibition. This may have been more challenging for the ADHD group who might have engaged the caudate in a more effortful way than the HC group. Similarly, it is possible that the increased cerebellar activation found in ADHD subjects may reflect effort for motor control during the Response Inhibition Task, possibly to compensate for reduced prefrontal control (Rubia et al., 2009).
4.2. Differential brain function in PBD patients compared to ADHD patients
The present findings indicate greater prefrontal dysfunction in the ADHD than the PBD group. Prefrontal alterations in the PBD group compared to the HC group were limited to VLPFC and pregenual ACC. On the contrary, the ADHD patients demonstrated reduced activation in VLPFC, DLPFC and temporal lobe regions not only compared to HC, but also compared to the PBD group. Finally, while striatal activation was greater in ADHD patients relative to HC, it did not differ significantly between the PBD and ADHD groups.
Findings from neuropsychological studies with ADHD (Rubia et al., 2001; Doyle et al., 2005) and PBD patients (Dickstein et al., 2005; Pavuluri et al., 2006) suggests similar patterns of neuropsychological deficits in the two patient groups. Thus, it is not surprising that in the present study both patient groups had comparable behavioral deficits in response inhibition, while still having distinct clinical diagnosis based on the DSM-IV. We can nevertheless start to dissociate the neural systems underlying response inhibition deficits in these two disorders. The present findings suggest that behavioral control deficits in ADHD may be associated both with dorsal fronto-striatal dysfunction, that affects cognitive (i.e., inattention) and motor circuitries (i.e., hyperactivity), and with VLPFC dysfunction, that regulates response inhibition functions (Casey et al., 1997; Bush et al., 1999; Rubia et al., 1999). Conversely, response inhibition deficits in PBD seem associated with a more localized dysfunction in VLPFC and ventral ACC (Blumberg et al., 2003b; Frangou et al., 2005; Pavuluri et al., 2007). These differences in brain activation occurred in the absence of significant behavioral differences between the PBD and ADHD groups. While both groups presented poorer response accuracy than the HC group on Go and Stop trials, they still had an overall performance accuracy above 75%, which suggests that they were overall able to understand and carry out the Response Inhibition Task within acceptable levels of accuracy. If the groups differed substantially in their accuracy or the patient group accuracies were at chance level, it would be difficult to interpret group differences in brain activation, since they could just illustrate a non-specific difference in neural activation due to one group being able to inhibit responses and another group failing, or not paying attention during the task. But given that all groups had good accuracy levels, group differences in brain activation for Stop versus Go trials can be explored as indicative of the specific neural dysfunction that characterizes response inhibition in ADHD and PBD, as compared to each other and to HC. Lastly, from a developmental neuropathology perspective, it is significant that our PFC findings with PBD and ADHD patients are similar to those found in adult studies (Blumberg et al., 2003a,b; Seidman et al., 2004; Frangou et al., 2005), indicating that in spite of the long developmental pathway and increasing specialization of the PFC with age (Rubia et al., 2000; Luna et al., 2001; Luna and Sweeney, 2004), prefrontal pathophysiology in VLPFC and DLPFC, as we describe them here, are already apparent in children and adolescents with these two illnesses.
4.3. PFC and ACC dysfunction in PBD
The PBD group, relative to HC, exhibited reduced activation in left VLPFC, at the junction of the left middle and inferior frontal gyrus, and in right pregenual ACC, and increased activation in posterior cingulate and temporo-parietal regions that are less specific to response inhibition but are related to ancillary attention and visuo-spatial processes. The VLPFC is involved in response inhibition and selective attention processes (Konishi et al., 1999; Rubia et al., 2001; Menon et al., 2001). Our results are in line with the growing body of research evidence underscoring the role of VLPFC dysfunction in PBD (Blumberg et al; 2003a; Frangou et al., 2005; Pavuluri et al., 2007, 2008). In fact, both human (Rolls, 1996; Aron et al., 2003) and animal (Mishkin, 1964) lesion studies indicate that damage to VLPFC causes cognitive and behavioral problems that have some similarities to those seen in bipolar disorder. Moreover, recent brain imaging studies using the Stop-Signal Task (Leibenluft et al., 2007) and an emotional Stroop Task (Pavuluri et al., 2008) found decreased VLPFC activation in subjects with PBD compared to HC, and Blumberg et al. (2003b) found that patients with bipolar disorder exhibited decreased activation in the left VLPFC (including parts of BA 10 and 47) during a Stroop Task, regardless of whether they were in an elevated, depressed or euthymic mood state. Furthermore, studies with healthy adults suggested that the junction of VLPFC (BA 45, 47, inferior frontal gyrus) and dorsolateral prefrontal cortex (DLPFC) (BA 9, 46, middle frontal gyrus) may play a crucial role at the interface of cognitive and affective processing (Petrides and Pandya, 2002) and may be impaired in patients with PBD (Pavuluri and Passarotti, 2008; Rich et al., 2006).
It is also noteworthy that in our study, the PBD group also showed decreased activation in right pregenual ACC which is involved in response control in the presence of cognitive interference (Vogt et al., 1992; Bush et al., 2000) and is connected both to the VLPFC (Kemmotzu et al., 2005) and to the limbic system (Bush et al., 2000; Mesulam et al., 2001). There is growing evidence that the pregenual ACC is dysfunctional in patients with bipolar disorder (Fountoulakis et al., 2008). Therefore it seems that the PBD group, compared to HC, exhibits impairment in the modulation of response inhibition by ventral frontal cortical regions, including VLPFC and ACC, with possible compensation or disinhibition of posterior brain regions including posterior cingulate and superior temporal gyrus.
Lastly, different from the Leibenluft et al. (2007) motor inhibition study, the present study did not find differences in striatal activation between the PBD and the HC group. This difference may be due to the fact that Leibenluft et al. (2007) reported group differences for trials with failed response inhibition, while we examined response inhibition components regardless of correct or incorrect performance. Also, the present block-design study had a higher proportion of Stop trials (70%) compared to other event-related studies that examined response inhibition in PBD (e.g., Strakowski et al., 2005; Leibenluft et al., 2007). This may have led the PBD patients and HC subjects in our study to maintain a preparatory response-withholding state that may have uniformly engaged the striatum in both groups.
Moreover, although the current study shed some light on important differences in PBD and ADHD pathophysiology, it also points to the need for future investigations involving larger samples, greater age-ranges, and especially using event-related fMRI designs together with more specific response inhibition paradigms, such as the Stop-Signal Task (e.g., Logan et al., 1984). In fact, the present response inhibition study adopted a block design, and according to this design it examined response inhibition versus execution by comparing blocks of predominantly stop trials with blocks of predominantly Go trials. But by doing so it could not distinguish between neural activation for correct and incorrect Stop responses. It also did not directly explore response inhibition in the context of a pre-potent tendency to respond (Logan et al., 1984), or in the context of sustained attention (Rubia et al., 2009). On the contrary, with an ER-fMRI design it is possible to usefully separate trial-wise inhibitory components in response inhibition trials that are performed correctly and incorrectly, and to have a higher proportion of go versus stop trials within a block, to create a pre-potent tendency to respond. Therefore, building from the current findings it is important that future ER-fMRI studies further explore response inhibition in the context of the typical Stop-Signal Task, and in the context of sustained attention, in children and adolescents with PBD and ADHD, since these functions are affected by impulsivity and inattention in these patients.
Finally, while the present study has the important advantage of testing patients while medication free, it is important to note that more than half of the patients in the PBD and ADHD groups had a history of medication, and therefore we cannot exclude that previous long term exposure to certain medications may have affected brain development or contributed to some of the neural dysfunction observed in the patient groups. Therefore future studies may need to directly compare patients with ADHD and Bipolar Disorder across the age-span, and further examine differential treatment effects on brain development and alterations in functional brain systems in these disorders.
5. Conclusions
While behavioral deficits in response inhibition and attention are common to both PBD and ADHD, the present study revealed a more generalized profile of prefrontal dysfunction in ADHD patients compared to PBD patients during a Response Inhibition Task. While in ADHD response inhibition deficits may be driven by a more extensive dysfunction of PFC and motor control systems, in PBD they may be driven by more localized dysfunction of regulatory VLPFC and ACC regions.
Acknowledgements
This work is supported by NIH K23 RR18638-01, the Dana Foundation and NARSAD to Dr Pavuluri.
Footnotes
Disclosure: Dr Passarotti has no financial relationships to disclose. Dr. Pavuluri’s work unrelated to this manuscript is supported by NARSAD, NICHD, Colbeth Foundation, GlaxoSmithKline— Neuro-Health, Abbott Pharmaceuticals and Janssen Research Foundation. Dr. Sweeney, also unrelated to this work, has received support from NIH, GlaxoSmithKline, AstraZeneca, Janssen and Eli Lilly.
References
- Alexander GE, DeLong MR, Strick PL. Parallel organization of functionally segregated circuits linking basal ganglia and cortex. Annual Review of Neuroscience. 1986;9:357–381. doi: 10.1146/annurev.ne.09.030186.002041. [DOI] [PubMed] [Google Scholar]
- American Psychiatric Association . Diagnostic and Statistical Manual of Mental Disorders IV. 4th ed. American Psychiatric Association; Washington, DC: 1994. DSM-IV. [Google Scholar]
- Aron AR, Fletcher PC, Bullmore ET, Sahakian BJ, Robbins TW. Stop-signal inhibition disrupted by damage to right inferior frontal gyrus in humans. Nature Neuroscience. 2003;6:115–116. doi: 10.1038/nn1003. [DOI] [PubMed] [Google Scholar]
- Barkley RA. Behavioral inhibition, sustained attention, and executive functions: constructing a unifying theory of ADHD. Psychological Bulletin. 1997;121(1):65–94. doi: 10.1037/0033-2909.121.1.65. [DOI] [PubMed] [Google Scholar]
- Biederman J, Mick E, Faraone SV, Spencer T, Wilens TE, Wozniak J. Pediatric mania: a developmental subtype of bipolar disorder? Biological Psychiatry. 2000;48:458–466. doi: 10.1016/s0006-3223(00)00911-2. [DOI] [PubMed] [Google Scholar]
- Blumberg HP, Martin A, Kaufman J, Leung HC, Skudlarski P, Lacadie C, et al. Frontostriatal abnormalities in adolescents with bipolar disorder: preliminary observations from functional MRI. American Journal of Psychiatry. 2003a;160(7):1345–1347. doi: 10.1176/appi.ajp.160.7.1345. [DOI] [PubMed] [Google Scholar]
- Blumberg HP, Leung HC, Skudlarski P, Lacadie C, et al. A functional magnetic resonance imaging study of bipolar disorder: state and trait-related dysfunction in ventral prefrontal cortices. Archives of General Psychiatry. 2003b;60:599–607. doi: 10.1001/archpsyc.60.6.601. [DOI] [PubMed] [Google Scholar]
- Brandeis D, Van Leeuwen TH, Rubia K, Vitacco D, Steger J, Pascual-Marqui RD, Steinhausen HC. Neuroelectric mapping reveals precursor of stop failures in children with attention deficits. Behavioral and Brain research. 1998;94(1):111–125. doi: 10.1016/s0166-4328(97)00174-5. [DOI] [PubMed] [Google Scholar]
- Bush G, Frazier JA, Rauch SL, et al. Anterior cingulate cortex dysfunction in attention-deficit/hyperactivity disorder revealed by fMRI and the counting Stroop. Biological Psychiatry. 1999;45:1542–1552. doi: 10.1016/s0006-3223(99)00083-9. [DOI] [PubMed] [Google Scholar]
- Bush G, Luu P, Posner MI. Cognitive and emotional influences in anterior cingulate cortex. Trends in Cognitive Science. 2000;4(6):215–222. doi: 10.1016/s1364-6613(00)01483-2. [DOI] [PubMed] [Google Scholar]
- Casey BJ, Castellanos FX, Giedd JN, Marsh WL, Hamburger SD, Schubert AB, Vauss YC, Vaituzis AC, Dickstein DP, Sarfatti SE, Rapoport JL. Implication of right frontostriatal circuitry in response inhibition and attention-deficit/hyperactivity disorder. Journal of the American Academy of Child and Adolescent Psychiatry. 1997;36:374–383. doi: 10.1097/00004583-199703000-00016. [DOI] [PubMed] [Google Scholar]
- Castellanos FX, Giedd JN, Eckburg P, Marsh WL, Vaituzis AC, Kaysen D, Hamburger SD, Rapoport JL. Quantitative morphology of the caudate nucleus in attention deficit hyperactivity disorder. American Journal of Psychiatry. 1994;151(12):1791–1796. doi: 10.1176/ajp.151.12.1791. [DOI] [PubMed] [Google Scholar]
- Castellanos FX, Giedd JN, Marsh WL, Hamburger SD, Vaituzis AC, Dickstein DP, Sarfatti SE, Vauss YC, Snell JW, Lange N, Kaysen D, Krain AL, Ritchie GF, Rajapakse JC, Rapoport JL. Quantitative brain magnetic resonance imaging in attention-deficit hyperactivity disorder. Archives of General Psychiatry. 1996;53(7):607–616. doi: 10.1001/archpsyc.1996.01830070053009. [DOI] [PubMed] [Google Scholar]
- Castellanos FX, Lee PP, Sharp W, Jeffries NO, Greenstein DK, Clasen LS, Blumenthal JD, James RS, Ebens CL, Walter JM, Zijdenbos A, Evans AC, Giedd JN, Rapoport JL. Developmental trajectories of brain volume abnormalities in children and adolescents with attention-deficit/hyperactivity disorder. Journal of the American Medical Association. 2002;288(14):1740–1748. doi: 10.1001/jama.288.14.1740. [DOI] [PubMed] [Google Scholar]
- Cox RW, AFNI Software for analysis and visualization of functional magnetic resonance neuroimages. Computational Biomedical Research. 1996;29:162–173. doi: 10.1006/cbmr.1996.0014. [DOI] [PubMed] [Google Scholar]
- Dickstein DP, Garvey M, Pradella AG, Greenstein DK, Sharp WS, et al. Neurologic examination abnormalities in children with bipolar disorder or attention deficit/hyperactivity disorder. Biological Psychiatry. 2005;58:517–524. doi: 10.1016/j.biopsych.2004.12.010. [DOI] [PubMed] [Google Scholar]
- Doyle AE, Willcutt EG, Seidman LJ, Biederman J, Chouinard VA, Silva J, Faraone S. Attention-deficit/hyperactivity disorder endophenotypes. Biological Psychiatry. 2005;57:1324–1335. doi: 10.1016/j.biopsych.2005.03.015. [DOI] [PubMed] [Google Scholar]
- DuPaul GJ, Power TJ, Anastopulous AD, Reid R. ADHD Rating Scale. IV. Guilford Press; New York: 1998. [Google Scholar]
- Durston S, Tottenham NT, Thomas KM, Davidson MC, Eigsti IM, Yang Y, Ulug AM, Casey BJ. Differential patterns of striatal activation in young children with and without ADHD. Biological Psychiatry. 2003;53(10):871–878. doi: 10.1016/s0006-3223(02)01904-2. [DOI] [PubMed] [Google Scholar]
- Durston S, Mulder M, Casey BJ, Ziermans T, van Engeland H. Activation in ventral prefrontal cortex is sensitive to genetic vulnerability for attention deficit hyperactivity disorder. Biological Psychiatry. 2006;60:1062–1070. doi: 10.1016/j.biopsych.2005.12.020. [DOI] [PubMed] [Google Scholar]
- Eddy WF, Fitzgerald M, Genovese CR, Mockus A, Noll DC. In: Prat A, editor. Functional image analysis software - computational olio; Proceedings in Computational Statistics; Physica-Verlag, Heidelberg. 1996.pp. 39–49. [Google Scholar]
- Filipek PA, Semrud-Clikeman M, Steingard RJ, Renshaw PF, Kennedy DN, Biederman J. Volumetric MRI analysis comparing subjects having attention-deficit hyperactivity disorder with normal controls. Neurology. 1997;48(3):589–601. doi: 10.1212/wnl.48.3.589. [DOI] [PubMed] [Google Scholar]
- Fountoulakis KN, Giannakopoulos P, Kövari E, Bouras C. Assessing the role of cingulated cortex in bipolar disorder: neuropathological, structural and functional imaging data. Brain Research Reviews. 2008;59:9–21. doi: 10.1016/j.brainresrev.2008.04.005. [DOI] [PubMed] [Google Scholar]
- Frangou S, Haldane M, Roddy D, Kumari V. Evidence for deficit in tasks of ventral, but not dorsal, prefrontal executive function as an endophenotypic marker for bipolar disorder. Biological Psychiatry. 2005;58(10):838–839. doi: 10.1016/j.biopsych.2005.05.020. [DOI] [PubMed] [Google Scholar]
- Galanter CA, Leibenluft E. Frontiers between attention deficit hyperactivity disorder and bipolar disorder. Child and Adolescent Psychiatric Clinics of North America. 2008;17:325–346. doi: 10.1016/j.chc.2007.11.001. [DOI] [PubMed] [Google Scholar]
- Garavan H, Ross TJ, Murphy K, Roche RA, Stein EA. Dissociable executive functions in the dynamic control of behavior: inhibition, error detection, and correction. Neuroimage. 2002;17:1820–1829. doi: 10.1006/nimg.2002.1326. [DOI] [PubMed] [Google Scholar]
- Geller B, Warner K, Williams M, Zimerman B. Prepubertal and young adolescent bipolarity versus ADHD: assessment and validity using the WASH-U-KSADS, CBCL, and TRF. Journal of Affect Disorder. 1998;51(2):93–100. doi: 10.1016/s0165-0327(98)00176-1. [DOI] [PubMed] [Google Scholar]
- Kemmotzu N, Villalobos ME, Gaffrey MS, Courchesne E, Muller RA. Activity and functional connectivity of inferior frontal cortex associated with response conflict. Cognitive Brain Research. 2005:335–342. doi: 10.1016/j.cogbrainres.2005.02.015. [DOI] [PubMed] [Google Scholar]
- Konishi S, Nakajima K, Uchida I, Kikyo H, Kameyama M, Miyashita Y. Common inhibitory mechanism in human inferior prefrontal cortex revealed by event-related functional MRI. Brain. 1999;122:981–991. doi: 10.1093/brain/122.5.981. [DOI] [PubMed] [Google Scholar]
- Leibenluft E, Rich BA, Vinton DT, Nelson EE, Fromm SJ, Berghorst LH, et al. Neural circuitry engaged during unsuccessful motor inhibition in pediatric bipolar disorder. American Journal of Psychiatry. 2007;164(1):52–60. doi: 10.1176/ajp.2007.164.1.A52. [DOI] [PubMed] [Google Scholar]
- Logan GD, Cowan WB, Davis KA. On the ability of inhibit simple and choice reaction time responses: a model and a method. Journal of Experimental Psychology: Human Perception and Performance. 1984;10:276–291. doi: 10.1037//0096-1523.10.2.276. [DOI] [PubMed] [Google Scholar]
- Luna B, Sweeney JA. The emergence of collaborative brain function: FMRI studies of the development of response inhibition. Annals of the New York Academy of Sciences. 2004;1021:296–309. doi: 10.1196/annals.1308.035. [DOI] [PubMed] [Google Scholar]
- Luna B, Thulborn KR, Munoz DP, Merriam EP, Garver KE, Minshew NJ, Keshavan MS, Genovese CR, Eddy WF, Sweeney JA. Maturation of widely distributed brain function subserves cognitive development. Neuroimage. 2001;13(5):786–793. doi: 10.1006/nimg.2000.0743. [DOI] [PubMed] [Google Scholar]
- Malhi GS, Lagopoulos J, Sachdev PS, Ivanovski B, Shnier R. An emotional Stroop functional MRI study of euthymic bipolar disorder. Bipolar Disorder. 2005;7(Supplement 5):58–69. doi: 10.1111/j.1399-5618.2005.00255.x. [DOI] [PubMed] [Google Scholar]
- Menon V, Adleman NE, White CD, Glover GH, Reiss AL. Error-related brain activation during a go/no-go response inhibition task. Human Brain Mapping. 2001;12:131–143. doi: 10.1002/1097-0193(200103)12:3<131::AID-HBM1010>3.0.CO;2-C. [DOI] [PMC free article] [PubMed] [Google Scholar]
- Mesulam MM, Nobre AC, Kim YH, Parrish TB, Gitelman DR. Heterogeneity of cingulate contributions to spatial attention. Neuroimage. 2001;13(6 Pt 1):1065–1072. doi: 10.1006/nimg.2001.0768. [DOI] [PubMed] [Google Scholar]
- Mishkin M. Perseveration of central sets after frontal lesions in man. In: Warren JM, Akert K, editors. The frontal Granular Cortex and Behavior. McGraw-Hill; New York: 1964. pp. 219–294. [Google Scholar]
- Pavuluri MN, Passarotti AM. Neural bases of emotional processing in pediatric bipolar disorder. Expert Review of Neurotherapeutics. 2008;8(9):1381–1387. doi: 10.1586/14737175.8.9.1381. [DOI] [PubMed] [Google Scholar]
- Pavuluri MN, Shenkel LS, Aryal S, Harral E, Hill K, Herbener ES, Sweeney JA. Neurocognitive function in unmedicated manic and medicated euthymic pediatric bipolar patients. American Journal of Psychiatry. 2006;163(2):286–293. doi: 10.1176/appi.ajp.163.2.286. [DOI] [PubMed] [Google Scholar]
- Pavuluri MN, O’Connor MM, Harral EM, Sweeney JA. Affective neural circuitry during facial emotion processing in pediatric bipolar disorder. Biological Psychiatry. 2007;62(2):158–167. doi: 10.1016/j.biopsych.2006.07.011. [DOI] [PubMed] [Google Scholar]
- Pavuluri MN, O’Connor MM, Harral EM, Sweeney JA. An fMRI study of the interface between affective and cognitive neural circuitry in pediatric bipolar disorder. Psychiatry Research. 2008;162(3):244–245. doi: 10.1016/j.pscychresns.2007.10.003. [DOI] [PMC free article] [PubMed] [Google Scholar]
- Plitzka SR, Glahn DC, Semrud-Clikeman M, Franklin C, Perez R, Xiong J, Liotti M. Neuroimaging of inhibitory control areas in children with attention deficit hyperactivity disorder who were treatment naïve or in long-term treatment. American Journal of Psychiatry. 2006;163(6):1052–1060. doi: 10.1176/ajp.2006.163.6.1052. [DOI] [PubMed] [Google Scholar]
- Poznanski E, Grossman J, Buchsbaum Y, Banegas M, Freeman L, Gibbons R. Preliminary studies of the reliability and validity of the children’s depression rating scale. Journal of the American Academy of Child and Adolescent Psychiatry. 1984;23(2):191–197. doi: 10.1097/00004583-198403000-00011. [DOI] [PubMed] [Google Scholar]
- Psychological Corporation . Wechsler Abbreviated Scale of Intelligence (WASI) Harcourt Brace & Company; San Antonio, TX: 1999. [Google Scholar]
- Rolls ET. The orbitofrontal cortex. Philosophical Transactions of the Royal Society of London. B. 1996;351:1433–1444. doi: 10.1098/rstb.1996.0128. [DOI] [PubMed] [Google Scholar]
- Rosenthal R. Meta-analytic Procedures for Social Research. Sage; Newbury Park, CA: 1991. [Google Scholar]
- Rubia K, Overmeyer S, Taylor E, Brammer M, Williams SC, Simmons A, Bullmore ET. American Journal of Psychiatry. Vol. 156. 1999. Hypofrontality in attention deficit hyperactivity disorder during higher-order motor control: a study with functional MRI; pp. 891–896. [DOI] [PubMed] [Google Scholar]
- Rubia K, Overmeyer S, Taylor E, et al. Functional frontalisation with age: mapping neurodevelopmental trajectories with fMRI. Neurosci Biobehav Rev. 2000;24:13–19. doi: 10.1016/s0149-7634(99)00055-x. [DOI] [PubMed] [Google Scholar]
- Rubia K, Taylor E, Smith H, Oksannen H, Overmeyer S, Newman S. Neuropsychological analyses of impulsiveness in childhood hyperactivity. British Journal of Psychiatry. 2001;179:138–143. doi: 10.1192/bjp.179.2.138. [DOI] [PubMed] [Google Scholar]
- Rubia Katya, Smith Anna B., Halari Rozmin, Matsukura Fumie, Mohammad Majeed, Taylor Eric, Brammer Michael J. Disorder-specific dissociation of orbito-frontal dysfunction in boys with pure conduct disorder during reward and ventrolateral prefrontal dysfunction in boys with pure ADHD during sustained attention. American Journal of Psychiatry. 2009;166:83–94. doi: 10.1176/appi.ajp.2008.08020212. [DOI] [PubMed] [Google Scholar]
- Rucklidge JJ. Impact of ADHD on the neurocognitive functioning of adolescents with bipolar disorder. Biological Psychiatry. 2006;60:921–928. doi: 10.1016/j.biopsych.2006.03.067. [DOI] [PubMed] [Google Scholar]
- Seidman LJ, Valera EM, Bush G. Brain function and structure in adults with attention-deficit/hyperactivity disorder. Psychiatry Clinics of North America. 2004;27(2):323–347. doi: 10.1016/j.psc.2004.01.002. [DOI] [PubMed] [Google Scholar]
- Seidman LJ, Valera EM, Macris N, Monuteux MC, Boriel DL, Kelkar K, et al. Dorsolateral prefrontal and anterior cingulated cortex volumetric abnormalities in adults with attention-deficit/hyperactivity disorder identified by magnetic resonance imaging. Biological Psychiatry. 2006;60:1071–1080. doi: 10.1016/j.biopsych.2006.04.031. [DOI] [PubMed] [Google Scholar]
- Silk A, Vance N, Rinehart G, Egan M, O’Boyle JL, Bradshaw, Cunnington R. Decreased fronto-parietal activation in Attention Deficit Hyperactivity Disorder, combined type (ADHD-CT): an fMRI study. British Journal of Psychiatry. 2005;187(3):282–283. doi: 10.1192/bjp.187.3.282. [DOI] [PubMed] [Google Scholar]
- Strakowski SM, Adler CM, Holland SK, Mills NP, DelBello MP, Eliassen JC. Abnormal fMRI brain activation in euthymic bipolar disorder patients during a counting Stroop interference task. American Journal of Psychiatry. 2005;162(9):1697–1705. doi: 10.1176/appi.ajp.162.9.1697. [DOI] [PubMed] [Google Scholar]
- Talairach J, Tournoux P. Co-Planar Stereotactic Atlas of the Human Brain. Thieme Medical Publishers; Stuttgart New York: 1988. [Google Scholar]
- Tamm L, Menon V, Ringel J, Reiss AL. Event-related fMRI evidence of frontotemporal involvement in aberrant response inhibition and task switching in attention-deficit/hyperactivity disorder. Journal of the American Academy of Child and Adolescent Psychiatry. 2004;43:1430–1440. doi: 10.1097/01.chi.0000140452.51205.8d. [DOI] [PubMed] [Google Scholar]
- Vaidya CJ, Austin G, Kirkorian G, et al. Selective effects of methylphenidate in attention deficit hyperactivity disorder: a functional magnetic resonance study. Proceedings of The National Academy of Science U S A. 1998;95:14494–14499. doi: 10.1073/pnas.95.24.14494. [DOI] [PMC free article] [PubMed] [Google Scholar]
- Vogt BA, Finch DM, Olson CR. Functional heterogeneity in cingulate cortex: the anterior executive and posterior evaluative regions. Cerebral Cortex. 1992;2(6):435–443. doi: 10.1093/cercor/2.6.435-a. [DOI] [PubMed] [Google Scholar]
- Young RC, Biggs JT, Ziegler VE, Meyer DA. A rating scale for mania: reliability, validity and sensitivity. British Journal of Psychiatry. 1978;133:429–435. doi: 10.1192/bjp.133.5.429. [DOI] [PubMed] [Google Scholar]