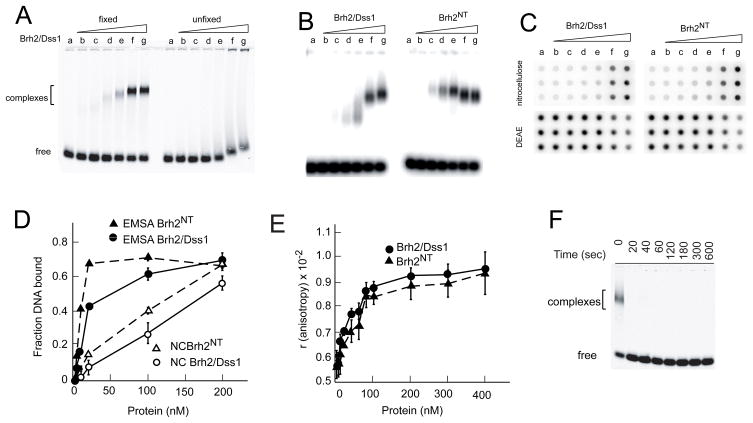
FIGURE 1.
DNA binding assays. A. Binding reactions containing IRD800 ss60mer and Brh2/Dss1 at the concentrations indicated were incubated for 40 min. Samples were either fixed with glutaraldehyde before electrophoresis or else were run without fixation. Lane a-no protein; b-2 nM; c-4 nM; d-10 nM; e-20 nM; f-100 nM; g-200 nM. B. 32Pss100mer was incubated with Brh2/Dss1 or Brh2NT at the concentrations indicated in A and samples fixed with glutaraldehyde. C. Reaction mixes with 32P-ss60mer incubated with Brh2/Dss1 or Brh2NT at the concentrations indicated in A were passed onto a manifold through a double layer sandwich of nitrocellulose and DEAE-cellulose membrane. D. Quantification of the results in B and C. E. Binding reactions containing 5′-fluorescein-labeled 49mer and Brh2/Dss1 at the indicated concentrations were incubated for 20 min, then anisotropy was determined. F. Sample mixes containing 100 nM Brh2/Dss1 but no DNA were set up. Glutaraldehyde was then added to samples and incubated for the indicated times before initiating the binding reaction by addition of IRD800 ss60mer. After further incubation for 20 min, samples were analyzed by gel electrophoresis.

