Abstract
The aryl hydrocarbon receptor (AHR) mediates the toxic effects of environmental contaminants, such as 2,3,7,8-tetrachlorodibenzo-p-dioxin (TCDD). Frogs are very insensitive to TCDD toxicity, and AHRs from Xenopus laevis (African clawed frog) bind TCDD with >20-fold lower affinity than mouse AHRb-1. Frog AHRs may nonetheless be highly responsive to structurally distinct compounds, especially putative endogenous ligands. We sought to determine the responsiveness of an X. laevis cell line, XLK-WG, to the candidate endogenous AHR ligand 6-formylindolo[3,2-b]carbazole (FICZ), a tryptophan photoproduct that exhibits high potency in mammalian systems. FICZ readily induced mRNAs for CYP1A6 and CYP1A7. Cells exposed to FICZ for 3 hours expressed up to 5-fold greater quantities of CYP1A6/7 mRNAs than those exposed for 24 hours, suggesting FICZ is metabolized following rapid enzyme induction. FICZ appeared more potent than TCDD. Following a 3-hr exposure, the EC50 for CYP1A6 mRNA induction by FICZ was ~6 nM, while the TCDD response was greater than 174 nM. These potencies were lower than those determined for mouse hepatoma cells (Hepa1c1c7; EC50 = ~0.06 nM each). The difference in ligand potency between cell lines was confirmed by induction of ethoxyresorufin-O-deethylase (EROD) activity. mRNA from XLK-WG cells treated with 100 nM FICZ, 100 nM TCDD, or vehicle was also analyzed on expression microarrays. FICZ altered the expression of 105 more transcripts than TCDD, and common targets were altered more dramatically by FICZ. Overall, these studies demonstrate that although FICZ is a less potent CYP1A inducer in frog cells than in mouse cells, the reduction is much less than for TCDD. Relative conservation of the FICZ response in a TCDD-insensitive species suggests its physiological importance as an AHR ligand.
Keywords: AH receptor, TCDD, FICZ, Xenopus, non-mammalian
1. INTRODUCTION
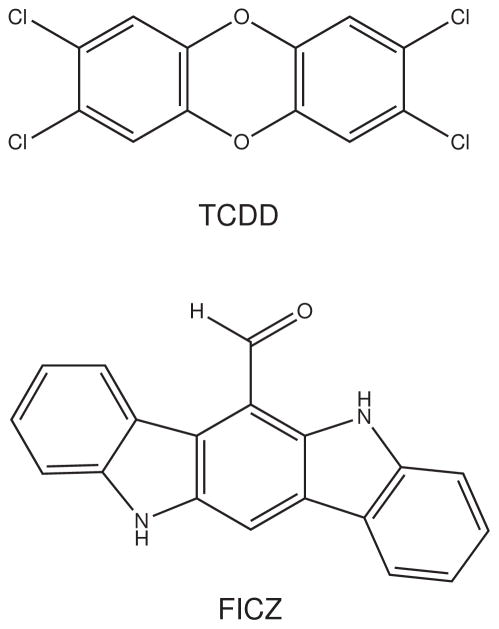
The aryl hydrocarbon receptor (AHR2) is a ligand activated transcription factor of the Per-Arnt-Sim (PAS) superfamily of proteins [1]. It mediates the biological effects of a wide range of structurally diverse ligands through alterations in target gene expression [2]. Xenobiotic ligands include planar halogenated aromatic hydrocarbons such as 2,3,7,8-tetrachlorodibenzo-p-dioxin (TCDD; Fig. 1) and many polychlorinated biphenyls as well as polynuclear aromatic hydrocarbons (PAH) like benzo(a)pyrene. The best characterized role of the AHR is to mediate the adaptive response of vertebrates to xenobiotic exposure. Upon binding a toxic ligand, the AHR induces the expression of monooxygenases (CYP1As, and CYP1Bs), glutathione s-transferases, uridine 5′-diphospho-glucuronosyltransferases, and other phase I and II detoxification enzymes [3–5]. Changes in gene expression resulting from AHR activation are also thought to underlie toxicity of dioxin-like compounds, although the identity of the genes and mechanisms by which they act are not well understood [6].
Fig. 1.
Structures of FICZ and TCDD.
In addition to its role in toxicity and detoxification of xenobiotics, the AHR may also mediate the effects of natural ligands in processes including development, environmental sensing, and the maintenance of homeostasis. Although no endogenous ligand has been unambiguously identified, 6-formylindolo[3,2-b]carbazole (FICZ; Fig. 1) has received serious consideration. A tryptophan photoproduct, FICZ forms intracellularly [7] and binds the AHR with TCDD-like affinity [8]. It is both a potent inducer and a ready substrate of CYP1A1, CYP1A2, and CYP1B1 [7], and it appears to play a role in the cytoplasmic arm of the UV response [9].
As a group, frogs are remarkably insensitive to the toxic effects of dioxin-like compounds [10]. Recent studies in the African clawed frog, Xenopus laevis, demonstrate that the AHRs bind TCDD with low affinity, at least 25-fold lower than the high-affinity mouse AHRb-1 [11], a property that likely underlies the lack of TCDD toxicity. However, the reduced affinity of these AHRs for TCDD may not directly reflect their responsiveness to all potential agonists, especially putative endogenous ligands. Indeed, if AHR function has been evolutionarily conserved in the vertebrate lineage because of an important physiological role associated with an endogenous ligand, it is reasonable to hypothesize that such a ligand could bind and activate the AHR with great potency in a wide variety of species, regardless of TCDD sensitivity. The insensitivity of X. laevis to TCDD thus makes it a unique model in which to examine FICZ responsiveness.
The goal of this study was to establish the relative potencies of TCDD and FICZ in conjunction with frog AHRs. We sought to test the hypothesis that FICZ elicits a highly potent response, despite the loss of responsiveness of frog AHRs receptors to TCDD. To this end, we examined the inducibility of CYP1A genes associated with FICZ and TCDD exposure in a X. laevis cell line, XLK-WG [12], comparing the relative potency of these compounds in this frog model and mouse Hepa1c1c7 cells, a long standing model of mammalian AHR function [13]. We also compared changes in global gene expression patterns induced by FICZ and TCDD in XLK-WG cells. This study contributes important evolutionary insight into the function of AHR in vertebrates. It is the first examination of FICZ effects in an amphibian model and along with a recent study by Jonsson et al. [14], represents the initial examination of FICZ responsiveness in non-mammalian species.
2. MATERIALS AND METHODS
2.1 Model System
Tissue culture models enabled appropriately high throughput for dose response studies using well established techniques. At the time of these studies, only two X. laevis cell lines were available from the ATCC, both of which are derived from kidney epithelium. Our preliminary studies revealed that XLK-WG cells grew much faster and were more amenable to handling than the more traditional A6 cell line [15], a long-standing model for physiological studies which we have employed previously [11]. The tissue culture approach also enabled direct comparison with responsiveness of Hepa1c1c7 cells, a mouse hepatoma cell line that expresses the high affinity AHRb-1 allele [16]. Although these two cell lines are derived from different tissue types, the AHR signaling components of both lines are now very well characterized, and the use of Hepa1c1c7 facilitates direct comparison with previously published in vitro studies contrasting frog AHRs with the mouse AHRb-1.
2.2 Cell Culture
XLK-WG and Hepa1c1c7 cells were obtained from the ATCC (Manassas, VA). XLK-WG cells were maintained at 29° C with 5% CO2 and RPMI-1640 medium (ATCC) plus 20% fetal bovine serum. Hepa1c1c7 cells were maintained at 37° C with 5% CO2 in α-MEM medium (Sigma, St. Louis, MO) with 10% fetal bovine serum. Cells were routinely cultured in 75cm2 plastic flasks (Greiner).
Due to the propensity for FICZ to form following exposure to fluorescent light in the laboratory setting [17, 18], media were stored and warmed in dark conditions, including amber and/or foil-wrapped vessels; culture hood lights remained off during all manipulations. Preliminary experiments revealed the importance of this precaution in limiting “constitutive” CYP1A expression.
FICZ (95% purity) was obtained from Biomol (Plymouth Meeting, PA). TCDD (purity 97–99%) was obtained from Ultra Scientific (Kingstown, RI).
2.3 RNA Extraction
Prior to exposure, cells were seeded in 25cm2 flasks (Greiner) and grown to near confluence. Cells were exposed to graded concentrations of TCDD or FICZ dissolved in dimethylsulfoxide (DMSO) for 3 or 24 hr. For XLK-WG cells, exposures ranged from 0.1 nM to 500 nM; for Hepa1c1c7 cells, concentrations ranged from 1 pM to 10 nM. Control cells were exposed to an equal volume of DMSO (0.25% final concentration). Total RNA from each flask was extracted using QIAshedder spin columns and RNeasy kits (Qiagen, Valencia, CA) as directed by the manufacturer.
2.4 Semi-Quantitative PCR
The presence of key components of the AHR pathway in TCDD-treated XLK-WG cells was probed by assessing the basal transcription of the following genes: CYP1A6, CYP1A7, AHR1α, AHR1β, ARNT1, ARNT2. β-actin was used as the endogenous control. Total RNA was extracted as described above and treated with DNase (Turbo DNA-free; Ambion, Austin, TX) to remove genomic DNA. Treated RNA (10 ng) was then converted into cDNA using MuLV reverse transcriptase with random hexamers and amplified using specific primers (Operon Biotechnologies, Huntsville, AL; Table S1) with the GeneAmp Gold RNA PCR Core Kit (Applied Biosystems, Foster City, CA). Cycling conditions for amplification were: 95° C/1 min; [95° C/15 min, 50° C/30 sec, 72° C/60 sec] for 43 cycles; 72° C/7 min.
Section 2.5 Quantitative PCR
Total RNA was extracted and treated with DNase as described above. Treated RNA (10 ng/PCR reaction) was converted to cDNA using random hexamers and Taqman Reverse Transcription Reagents (rMoMuLV reverse transcriptase; Applied Biosystems, Foster City, CA) before being quantified using specific primers (Operon Biotechnologies; Table S2) and Power SYBR Green PCR Master Mix (Applied Biosystems). PCR conditions were the following: 95° C/10 min; [95° C/15 sec, 60° C/1 min] for 50 cycles. Relative expression was determined using the ΔΔCt method in SDS v1.4 software (Applied Biosystems). β-actin was used as the endogenous control.
2.6 CYP1A activity assay
Induction of CYP1A activity was measured in an ethoxyresorufin-O-deethylase (EROD) assay [19]. Conditions were similar to those described in Hestermann et al. [20]. XLK-WG and Hepa1c1c7 cells were seeded in 96-well plates (Greiner, black wall/clear bottom and lid) with 250 μl medium (40,000 cells/well) and grown for 24 or 45 hours before being dosed with TCDD, FICZ, or DMSO vehicle (0.25%). For XLK-WG cells, exposures ranged from 0.1 nM to 500 nM; for Hepa1c1c7 cells, concentrations ranged from 1 pM to 10 nM. Treatment lasted 3 or 24 hours so that the total time for cell growth was 48 hours. Preliminary experiments with trypan blue staining revealed almost no cell death in any treatment group. Cells were washed with 250 μl/well 1x PBS and subsequently treated with 100 μl/well 2 μM 7-ethoxyresorufin. Reactions proceeded for 30 minutes, during which a Gemini EM multi-well fluorescence plate reader (Molecular Devices, Sunnyvale, CA) was used to detect the presence of resorufin – the product yielded by the metabolism of 7-ethoxyresorufin by CYP1A. Resorufin was detected using excitation and emission wavelengths of 530 and 586 nm, respectively. The addition of 75 μl/well fluorescamine (175 mg/ml) in acetonitrile was used to stop the reaction and allow fluorescent detection of protein using the excitation and emission wavelengths of 400 and 460 nm, respectively [19]. A standard curve used to determine resorufin and protein concentrations was constructed using known concentrations of resorufin and bovine serum albumin.
2.7 Statistical Analysis
Statistical analysis of all dose-response studies (Fig. 4–9) was completed using Prism 4.0b (GraphPad, San Diego, CA). EC50 values were determined via non-linear regression of the fractional response [21], constraining the background response to 0 and the maximal response to 1.
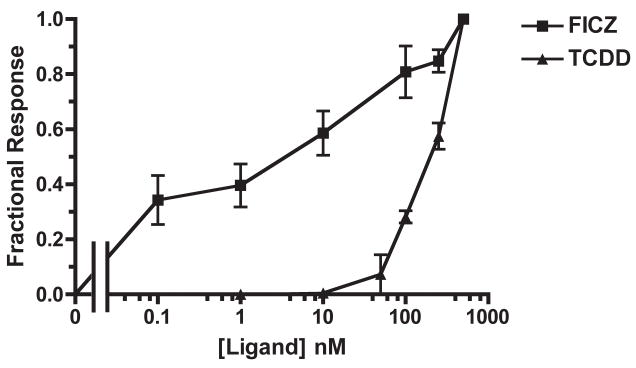
Fig. 4. Dose-dependent CYP1A6 mRNA induction by FICZ and TCDD in XLK-WG.
Cells were treated with varying amounts of FICZ or TCDD for 3 hours before RNA extraction and subsequent quantification of induced genes by real-time PCR. n=3 each; error bars = SE
Fig. 9. Dose-dependent induction of CYP1A activity by FICZ and TCDD in Hepa1c1c7: 24 hour treatment.
Cells were exposed to FICZ (A) or TCDD (B) at the indicated concentrations for 24 hours before CYP1A activity was measured. Plotted according to EROD activity (left) and percentage of maximal response (right). n=3 each. Error bars = SE.
2.8 Expression Microarray
XLK-WG cells were exposed to either 100 nM TCDD, FICZ, or DMSO vehicle for 3 hours before total RNA was extracted and treated with DNase (as described above). Probes were labeled by the University of Wisconsin Biotechnology Center’s Gene Expression Microarray Facility in Madison, Wisconsin using the MessageAmp II-Biotin Enhanced kit (Ambion). Samples were hybridized to Xenopus laevis GeneChips (Affymetrix, Santa Clara, CA), which were scanned using Affymetrix GC3000 7G scanning equipment. Gene expression was determined using the PM/MM method in dChip (Build: Sept 10, 2007). Statistical analysis was completed via one-way ANOVA with Tukey multiple comparison at experimentwise level p=0.01 using Statistical Analysis Software (SAS, Cary, North Carolina) [22]. Microarray data have been deposited in the Gene Expression Omnibus database (Accession number GSE16670).
3. RESULTS AND DISCUSSION
3.1 AHR Pathway Expression in XLK-WG cells
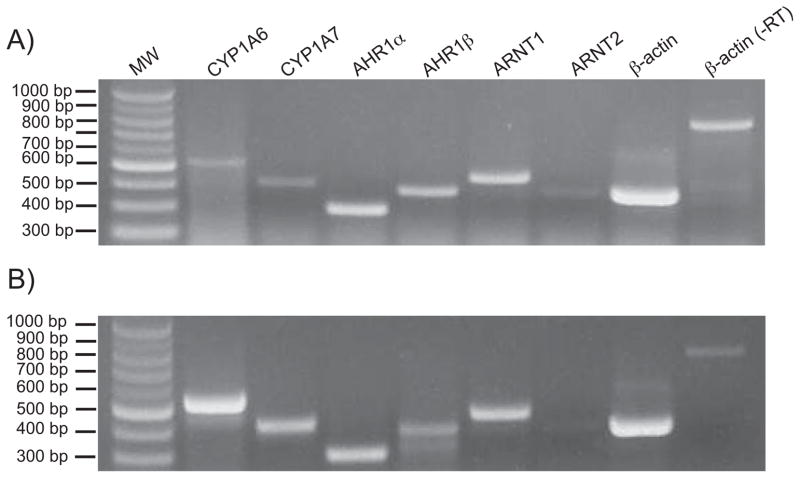
The Xenopus laevis AHR pathway contains two AHR paralogs (AHR1α and AHR1β; [11]), two ARNTs (ARNT1 and ARNT2 [23, 24]), and two CYP1As (CYP1A6 and CYP1A7 [25]). To confirm the expression of these key pathway components in the previously uncharacterized cell line, XLK-WG, cells grown to near confluence were treated with 100 nM TCDD or DMSO vehicle and total RNA was harvested after 24 hours. Subsequent semi-quantitative RT-PCR demonstrated that XLK-WG cells express transcripts encoding the critical components of the AHR signaling pathway (Fig. 2A). The up regulation of CYP1A6 and CYP1A7 mRNAs in cells exposed to TCDD indicates that the XLK-WG AHR pathway is active, and it represents an appropriate model for testing AHR ligand responsiveness in frogs (Fig. 2B).
Fig. 2. Expression of AHR pathway components and responsiveness to TCDD in X. laevis XLK-WG cells.
Cells were grown to near confluence and exposed to either (A) DMSO vehicle or (B) 100 nM TCDD for 24 hours before total RNA was extracted for use in RT-PCR analysis of the indicated transcripts. Reactions in the right-most lane lacked reverse transcriptase (-RT).
Although previous research has shown X. laevis embryos express both ARNT1 and ARNT2 [24], we detected low or minimal expression of the latter gene in this kidney epithelial cell line. This is in contrast to mammals, which express ARNT2 in kidney [26, 27], as well as some fish, which express ARNT2 ubiquitously [28]. However, studies in zebrafish embryos [29] and Hepa-1 cells [30] suggest that ARNT/ARNT1 (not ARNT2) is the physiological partner of the AHR in the TCDD response, and in our studies, ARNT1 is clearly adequate for TCDD-induced CYP1A expression in XLK-WG cells.
3.2 Transient Response of XLK-WG CYP1As to FICZ
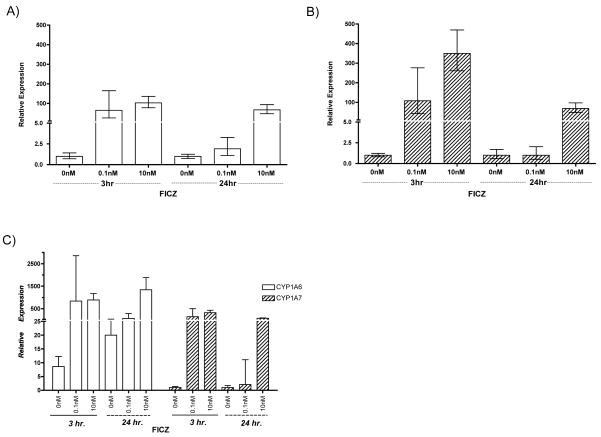
To probe XLK-WG responsiveness to FICZ, cells were exposed to FICZ or DMSO vehicle for 3 or 24 hours, and the relative induction of CYP1A6 and CYP1A7 mRNAs was assessed using quantitative real-time PCR (qRT-PCR). CYP1A6 and CYP1A7 expression increased in a dose-dependent manner after both 3 and 24 hours of FICZ exposure (Fig. 3). However, the response was transient; the highest dosage of FICZ elicited a 5-fold greater induction of CYP1A7 after 3 hours than after 24 hours (Fig. 3A). A similar but less dramatic phenomenon was observed with CYP1A6 expression (Fig. 3B). Constitutive CYP1A6 expression after 3 hour exposure was approximately 8-fold greater than CYP1A7; after 24 hours, the difference was more than 20-fold (Fig. 3C). Thus, although CYP1A7 mRNA levels were induced by a larger degree than CYP1A6, there is a greater overall abundance of CYP1A6 transcript both before and after FICZ exposure.
Fig. 3. Transient induction of CYP1A6/7 by FICZ in XLK-WG.
Cells were treated with indicated concentrations of FICZ for 3 or 24 hours before RNA extraction and subsequent quantification of induced CYP1A6 (A) and CYP1A7 (B) transcripts by quantitative RT-PCR. Note that data from (A) and (B) are re-plotted together on a different scale in (C). Error bars = possible RQ values based on the standard deviation of ΔΔCt.
The transient induction of CYP1A by FICZ has been previously observed in mouse Hepa1c1c7 [31] and human HaCaT cells [32]. We hypothesize that the enzymes responsible for FICZ metabolism in X. laevis include CYP1A6 and CYP1A7. This idea is supported by Wei et al. [31], who showed that in the absence of functional CYP1A1 enzyme, a mammalian ortholog, there was sustained induction of CYP1A1 mRNA by FICZ and no reduction in FICZ concentration in the culture media. Thus, CYP1A1 apparently degrades FICZ, preventing prolonged FICZ-dependent activation of the AHR pathway. CYP1A6 and CYP1A7, which share 92% amino acid identity [25], are likely both involved. Similar to many gene paralogs in X. laevis, they likely arose after a species-specific genome duplication [33], and their functions may still exhibit substantial redundancy. Given that human CYP1A1, CYP1A2, and CYP1B1 are all capable of metabolizing FICZ in vitro [7], it seems reasonable to hypothesize that the X. laevis CYP1A paralogs also have overlapping functions in this regard. Sequences in the Xenopus tropicalis genome database (Department of Energy Joint Genome Institute v. 4.1) include homologs of CYP1B, 1C, and 1D. Orthologs of these enzymes may also contribute to FICZ metabolism in X. laevis.
3.3 Relative Potencies of FICZ and TCDD in XLK-WG
The potencies of FICZ and TCDD were assessed by exposing XLK-WG cells to a range of ligand concentrations for 3 hours and determining the relative induction of CYP1A6 using qRT-PCR. CYP1A6 was chosen for these experiments because its basal expression is higher than CYP1A7 (Fig. 3C), facilitating detection and estimation of the degree of induction. These experiments demonstrated that FICZ is more potent than TCDD. An EC50 of 5.96 ± 3.15 nM (SE) was calculated for the FICZ induction of CYP1A6, but a true EC50 value could not be reliably determined for the TCDD response because it was clearly not saturable within solubility limits (Fig. 4). Using the response at the highest concentration as a presumed maximum, we estimated the lower bound for the EC50 as 174 ± 4 nM (SE). Low potency of TCDD for CYP1A6 mRNA induction has been observed previously with X. laevis A6 cells [11].
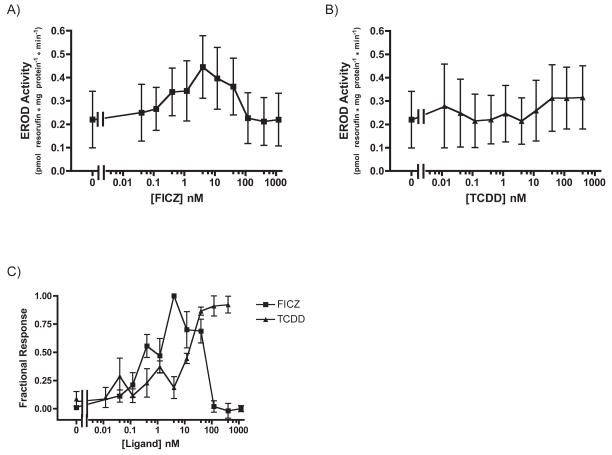
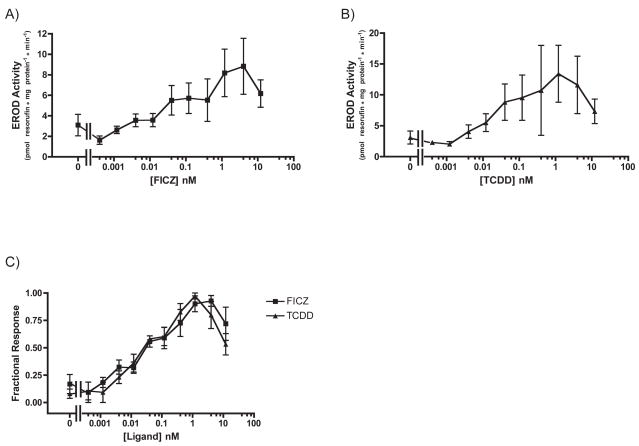
To determine whether the timing and magnitude of CYP1A mRNA induction by TCDD and FICZ exposure was reflected in CYP1A activity, we performed EROD assays using XLK-WG cells treated with TCDD and FICZ for 3 or 24 hours. Although the overall activity levels after 3 hour exposures were quite low, they suggest that FICZ is six times more potent as a CYP1A inducer than TCDD (Student’s t-test, p=0.0318, df=3). The EC50 of FICZ-induced CYP1A activity was 0.56 ± 0.15 nM (SE) while that of TCDD-induced CYP1A activity was 10.46 ± 3.17 nM (SE; Fig. 5).
Fig. 5. Dose-dependent induction of CYP1A activity by FICZ and TCDD in XLK-WG: 3-hour treatment.
Cells were exposed to FICZ or TCDD at the indicated concentrations for three hours before CYP1A activity was measured. Plotted according to EROD activity (A, B) and Fractional Response (C). n=3 each. Error bars = SE.
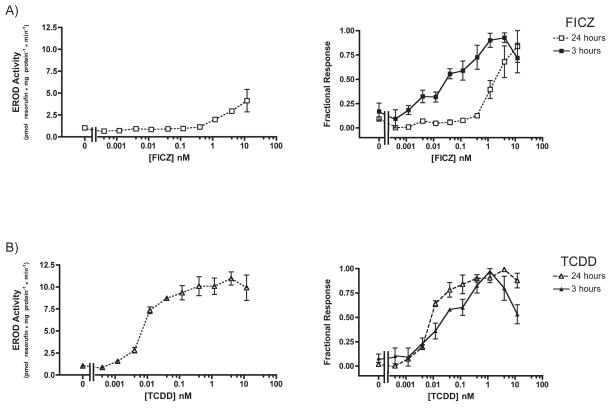
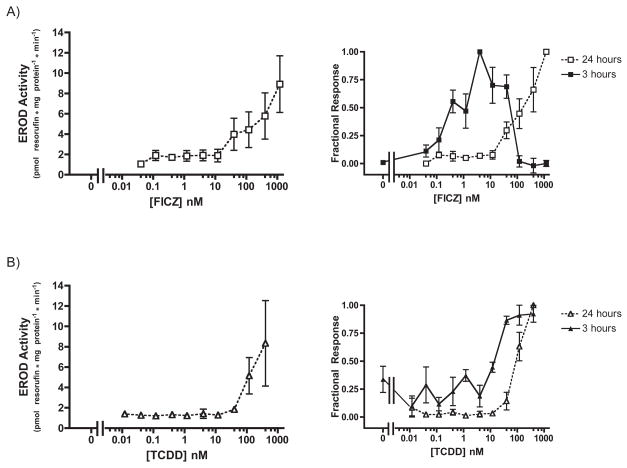
After 24 hours of exposure, both FICZ and TCDD appeared less potent. EC50 values for FICZ and TCDD CYP1A induction could not be definitively measured because the EROD response was not saturable; however, we estimated the lower bounds as 190 ± 108 nM (SE) and 95 ± 25 nM (SE) for FICZ and TCDD, respectively (Fig. 6). Although the apparent potency of these compounds was reduced with longer exposure time, the CYP1A activity increased. At the concentration of maximum response, FICZ- and TCDD-induced CYP1A activity rose by more than 20-fold. Induction of enzyme activity clearly lags the rapid mRNA induction observed for both compounds (Fig. 3, 4)
Fig. 6. Dose-dependent induction of CYP1A activity by FICZ and TCDD in XLK-WG: 24 hour treatment.
Cells were exposed to FICZ (A) or TCDD (B) at the indicated concentrations for 24 hours before CYP1A activity was measured. Plotted according to EROD activity (left) and percentage of maximal response (right). n=3 for FICZ, n=2 for TCDD. Error bars = SE.
The sharp decline in EROD activity at higher FICZ concentrations seen in this and subsequent experiments may relate to high levels of FICZ within the cells during the assay. FICZ may serve as a competitive substrate with 7-ethoxyresorufin, and one that does not yield a fluorescent product. The drop in FICZ potency after 24 hours of exposure likely resulted from its ready metabolism by the enzymes it induces [7, 14, 31]; nominal FICZ concentrations in culture media probably did not persist. This time-dependent reduction in FICZ concentration may prevent the decline in EROD activity at higher nominal concentrations than occurred following shorter exposures. TCDD, on the other hand, is poorly metabolized in most systems. The small apparent reduction in TCDD potency after the longer exposure may have occurred because of its propensity to interact with serum components, plastic, and itself, reducing the bioavailability of TCDD after 24 hours in culture compared with only 3 hours.
Variation in potency between TCDD and FICZ could be attributable to differences in either AHR binding affinity or in the intrinsic efficacy of each compound. We did not perform direct measurements of the dissociation constants. However, previous research has demonstrated that the rat AHR exhibits a greater binding affinity for FICZ than for TCDD [8]. A similar difference in the binding affinity of X. laevis AHRs for FICZ versus TCDD may underlie the disparity in potency between these two ligands. Alternatively, higher FICZ potency could result from greater efficiency of FICZ-activated AHR at eliciting a downstream response.
3.4 Relative Potencies of FICZ and TCDD in Hepa1c1c7 cells
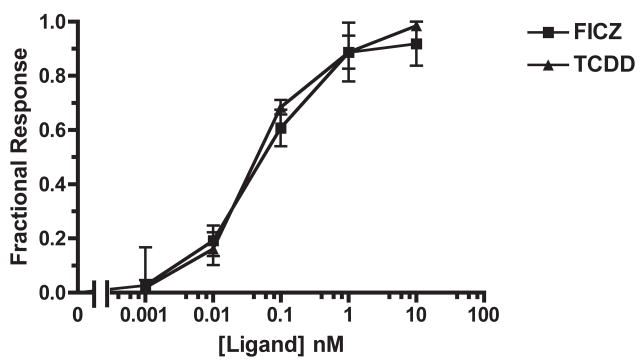
Previous characterization of heterologously expressed X. laevis AHRs compared their TCDD responsiveness to the high affinity mouse allele, AHRb-1 [11]. To directly compare the potencies of FICZ and TCDD with endogenously expressed proteins, we examined CYP1A1 mRNA induction in Hepa1c1c7 cells after 3 hours of ligand exposure. Both AHR agonists elicited similar CYP1A1 mRNA induction: the EC50 of FICZ was 0.07 ± 0.02 nM (SE) while that of TCDD was 0.05 ± 0.02 nM (SE; Fig. 7). Thus, while FICZ potency was nearly 150-fold lower in the frog cells, the difference between species was much less dramatic than for TCDD, which was at least 3,400 times less potent in frogs.
Fig. 7. Dose-dependent CYP1A1 mRNA induction by FICZ and TCDD in Hepa1c1c7.
Cells were treated with varying concentrations of FICZ or TCDD for 3 hours before RNA extraction and subsequent quantification of induced genes by real-time PCR. n= 3 each. Error bars = SE.
EROD assays were performed to examine whether the potencies of TCDD and FICZ for induction of CYP1A1 activity were similar to those for induction of mRNA. The EC50 of FICZ-induced CYP1A activity after 3 hours was 0.04 ± 0.01 nM (SE); that of TCDD-induced CYP1A activity was 0.03 ± 0.01 nM (SE; Fig. 8). These values are consistent with the EC50 calculated from the CYP1A1 mRNA response to 3 hour ligand exposure.
Fig. 8. Dose-dependent induction of CYP1A activity by FICZ and TCDD in Hepa1c1c7: 3 hour treatment.
Cells were exposed to FICZ (A) or TCDD (B) at the indicated concentrations for three hours before CYP1A activity was measured. Plotted according to EROD activity (A, B) and percentage of maximal response (C). n=3 each. Error bars = SE.
A comparison of induced CYP1A activity between Hepa1c1c7 cells and XLK-WG cells shows that the frog cells are less responsive to FICZ than the mouse cells. After a 3 hour exposure, induction of EROD activity in XLK-WG cells appeared about 14-fold less responsive to FICZ and 350-fold less responsive to TCDD than Hepa1c1c7 cells. These differences are about ten times smaller than those obtained by measuring mRNA induction.
EROD activity was much higher in Hepa1c1c7 cells than XLK-WG cells treated with FICZ or TCDD for 3 hours. The maximum activity induced by 3 hour FICZ treatment in Hepa1c1c7 cells was 8.83 ± 2.72 pmol • mg protein−1 • min−1 (SE), ~20-times greater than that observed in XLK-WG cells. Similarly, the maximum activity induced by 3 hour TCDD treatment in Hepa1c1c7 cells was 13.41 ± 4.61 pmol • mg protein−1 • min−1 (SE), ~40-fold larger than that seen in XLK-WG cells.
After 24 hours of exposure, FICZ-induced CYP1A activity in Hepa1c1c7 cells was unsaturable – likely because FICZ had been metabolized, reducing its actual concentration in the media (Fig. 9A). The EC50 of FICZ-induced activity was calculated to be at least 2.02 ± 0.58 nM (SE), ~50-fold greater than the EC50 calculated for 3 hours of FICZ exposure. On the other hand, the EC50 of TCDD-induced activity after 24 hours (0.01 ± 0.002 nM SE; Fig. 9B) was roughly equal to that observed after 3 hours of exposure. This sustained response reflects poor metabolism of TCDD by the enzymes it induces.
Notably, TCDD-induced CYP1A activity was sustained over 24 hours in Hepa1c1c7 cells but not XLK-WG cells. As mentioned previously, disposition of TCDD within the XLK-WG medium may have rendered it unavailable for AHR activation. It is not clear why this would occur in XLK-WG medium and not Hepa1c1c7 medium; however, the XLK-WG medium contained twice as much serum (20% versus 10%) and was incubated at 29° C, 8° colder than the Hepa1c1c7 medium. We hypothesize that over the longer exposure period, the greater prevalence of lipid and serum binding proteins, combined with the lower temperature, may have enabled TCDD to partition differentially in the XLK-WG medium, reducing the amount of ligand available to enter cells and induce CYP1A activity relative to the earlier time points.
Overall, it is clear that while FICZ potency in XLK-WG cells is lower than in Hepa1c1c7 cells, the difference is substantially smaller than for TCDD. EC50 values for all dose response experiments are summarized in Table S3.
3.5 XLK-WG transcriptome response to FICZ and TCDD exposure
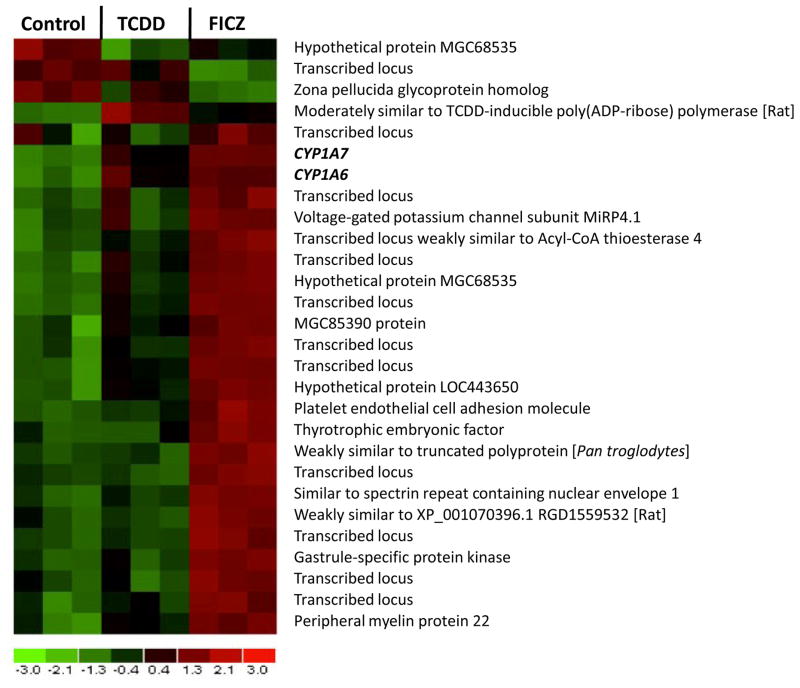
An Affymetrix microarray study was conducted to determine whether the higher potency of FICZ versus TCDD was reflected in the global gene expression profile in XLK-WG cells. After 3 hours of exposure, 100 nM FICZ induced 24 and repressed 2 genes two-fold or greater. The same concentration of TCDD induced the expression of only 3 genes and repressed 1 above the two-fold cutoff (Fig. 10; Table 1; Appendix). Considering only statistical significance (p ≤ 0.01) without the two-fold cutoff, TCDD induced 31 genes and repressed 12. Alternatively, FICZ induced 113 genes and repressed 35 (Table 1; Appendix; one-way ANOVA, p ≤ 0.01). Of the 31 TCDD-induced genes, 21 (68%) were also induced by FICZ; in addition, of the 12 TCDD-repressed genes, only 5 (42%) shared repression with FICZ. Of all genes affected by FICZ exposure, only 19% and 14% were also induced and repressed by TCDD. Thus, at the same concentration, a larger number of genes are induced and repressed by FICZ than TCDD – a reflection of FICZ’s increased potency in XLK-WG cells compared to TCDD.
Fig. 10. Expression of target genes reflects relative potency.
XLK-WG cells were exposed to 100 nM FICZ, TCDD, or DMSO vehicle for 3 hours before RNA extraction. Differentially expressed transcripts were identified by 2-way ANOVA with individual contrasts using SAS (P<0.01). Hierarchical clustering and heat map generated using dChip. Red boxes indicate relative gene induction; green boxes indicate relative repression. Raw data, metadata, and matrix file have been deposited in the NCBI Gene Expression Omnibus database with accession number GSE16670.
Table 1.
Summary of Microarray Data.
| Genes altered ≥ 2-fold | ||
|---|---|---|
| Induced | Repressed | |
| FICZ | 24 | 2 |
| TCDD | 3 | 1 |
| Genes altered (p ≤ 0.01) | ||
|---|---|---|
| Induced | Repressed | |
| FICZ | 113 | 35 |
| TCDD | 31 | 12 |
| Shared | 21 | 5 |
If ligand-specific alterations in gene expression resulted only from differences in potency, one would expect that the genes induced or repressed by the less potent ligand constitute a subset of the genes induced or repressed by the more potent ligand, reflecting different threshold levels necessary for alteration of a common set of target genes. Similarly, changes in expression of shared targets should be larger following treatment with the more potent compound. These patterns were very common within this data set, the more extensive target list and larger alterations confirming the greater potency of FICZ.
The apparent discrepancy between target gene lists also raises the possibility that FICZ and TCDD modulate the expression of different downstream targets, mediating some distinct physiological processes. To verify these discrepancies, we performed qRT-PCR on a selection of altered targets (Table 2). These experiments suggested that the microarray provided a relatively insensitive measure of transcript abundance. In several cases, most notably the CYP1As, fold-change in gene expression was dramatically underestimated. In others, small changes that were not detected on the microarray were apparent using qRT-PCR, especially following TCDD treatment. Thus, there was greater overlap of in the identities of transcripts altered by the two ligands than the microarray study indicated. However, in four of sixteen cases (Xl.14954, Xl.16370, Xl.16594, Xl.14584), expression induced by TCDD was comparable to or greater than the FICZ response, illustrating that the relationship between potency and molecular response is not uniformly simple and direct.
Table 2.
FICZ- and TCDD-induced changes in expression of selected transcripts in XLK-WG cells. Numbers indicate fold induction relative to vehicle-treated control.
| Transcript (unigene ID*) | FICZ | TCDD | ||
|---|---|---|---|---|
| Microarray | qRT-PCR | Microarray | qRT-PCR | |
| CYP1A7 (Xl.1220) | 16.1 | 412.1 | 6.7 | 320 |
| CYP1A6 (Xl.1692) | 2.1 | 455.3 | 1.7 | 427.3 |
| SYNE 1 (Xl. 14119) | 6.7 | 106 | 8.4 | |
| Xl.7783 | 5.9 | 4.3 | 2.0 | |
| MGC52735:similar to gap-jct protein alpha-7 (Xl.3337) | 5.2 | 304 | 69.1 | |
| Xl.14954 (similar to voltage-gated potassium channel subunit MiRP4.1) | 3.1 | 9.5 | 6.6 | |
| Xl.13754 (similar to C219-reactive peptide) | 3.1 | 4.6 | 2.2 | |
| Thyrotropic emvbryonic factor (TEF; Xl.16518) | 2.2 | 2.2 | 1.7 | |
| Peripheral Myelin protein 22 (Xl.11939/Xl.14729) | 2.2 | 1.0 | 1.1 | |
| MGC85390 (Xl.23887; similar to RAB 40B, RAS oncogene family) | 2.1 | 1.3 | 2.0 | |
| Xl.25142 | 2.1 | 1.8 | 0.9 | |
| Xl.14954 | 2.1 | 1.9 | 3.0 | |
| KCNE5.1: voltage-gated potassium channel subunit MiRP4.1 (Xl.16370) | 2.0 | 1.6 | 2.0 | |
| Hyaluronidase 2 (Xl.6247/Xl.16152) | 1.5 | 2.7 | 1.3 | 1.6 |
| Hypothetical protein MCG81225 (similar to Zn-finger protein 410; Xl.16594) | 1.3 | 3.5 | 1.3 | 3.2 |
| Xl.14584 (similar to gastrula-specific protein kinase) | 2.9 | 10.6 | 10.1 | |
Where multiple ID numbers are indicated, the first was from the microarray annotation and the second is the most up-to-date transcript association for that retired number.
The possibility that FICZ and TCDD elicit different downstream responses is not without precedent. A recent study of T-cell differentiation in mice showed that while TCDD induces T-reg cells, which limit the severity of autoimmune encephalomyelitis, AHR activation by FICZ stimulates differentiation of T(H)17 cells, exacerbating the autoimmune disease [34]. Furthermore, different AHR ligands have been shown to recruit different suites of co-factors to the human CYP1A1 promoter, altering AHR’s function as a transcription factor [35]. Additional genomic studies will be required to conclusively determine whether FICZ and TCDD elicit distinct transcriptional responses in XLK-WG cells.
Unfortunately, it was not possible to classify many of the altered transcripts because a large number of targets were either unknown gene products (e.g. hypothetical proteins) or derived from 3′ ESTs of short length that could not be reliably identified by translated BLAST [36]. Organization of the altered transcripts into functional networks is premature with the current chip annotation.
3.6 Conclusion and Implications: Is FICZ an endogenous activator of the frog AHR?
These data suggest that since their divergence from the common vertebrate lineage, the frog AHR paralogs have remained relatively responsive to FICZ despite becoming dramatically less sensitive to activation by TCDD. Additionally, the transient effects of FICZ suggest that it is metabolized, likely by the CYP1A enzymes it induces. Together, these results are consistent with the hypothesis that FICZ is an endogenous activator of the frog AHR, and they provide evidence that FICZ-responsiveness is conserved in tetrapods.
If FICZ is an evolutionarily conserved endogenous ligand for the AHR, it stands to reason that FICZ-dependent activation of the AHR mediates some important physiological process. A growing body of research links FICZ, AHR, and light. In HaCaT keratinocytes FICZ forms after UVB irradiation, binds the AHR, and initiates the portion of UV response pathway associated with cytoplasmic activation [37–39]. This pathway is refractory to UVB irradiation in AHR-null cells and mice [9]. AHR may also have a role in the circadian cycle. FICZ exposure can alter the circadian cycle of a suprachiasmatic nucleus (SCN)-derived cell line. The SCN is a region of the mammalian hypothalamus that controls the endogenous circadian cycle [40, 41]. Specifically, AHR activation by FICZ alters the timing and magnitude of rhythmic expression patterns of clock genes, including cryptochromes 1 and 2, critical regulatory proteins of the circadian clock with both mammalian and Drosophila orthologs [42, 43]. FICZ exposure also prevented glutamate-induced phase shift in mouse SCN neuronal rhythm. Interestingly, AHR−/− mice exhibit normal circadian rhythm, while wild type AHR mice treated with TCDD display behaviors suggestive of altered circadian rhythm [44]. This suggests that AHR affects circadian rhythm only in the presence of an activating ligand [45].
FICZ is the most potent known inducer of CYP1As in this X. laevis cell line (this study and additional unpublished results). Whether FICZ activates the AHR as part of a genuine physiological process in intact animals remains to be determined. X. laevis is found throughout a wide variety of aquatic environments in the savanna of sub-Sahara Africa. Generally, they reside in locations with slow-moving or stagnant water, such as ponds, slow streams, and swamps; however, X. laevis can occupy almost any aquatic habitat, including rivers, wells, and ditches [46]. Because these habitats can be exposed to prolonged periods of sunlight, the potential exists for light-induced formation of FICZ. This potential may be especially high in embryos and younger tadpoles, which lack the degree of pigmentation present in late tadpole stages and post-metamorphic animals. Future studies should seek to determine whether biologically relevant levels of FICZ can be produced in vivo. Doing so may shed light on whether selective pressure has maintained the responsiveness of the frog AHRs to FICZ and help elucidate functions of the vertebrate AHR that are not associated with the xenobiotic response.
Supplementary Material
Acknowledgments
We thank Diana G. Franks (Woods Hole Oceanographic Institution) for assistance with enzyme assays and Dr. Chris Gillen (Kenyon College) and Dr. Mark E. Hahn (Woods Hole Oceanographic Institution) for advice on the manuscript, and Daniel Iwamoto for technical assistance. Labeling and hybridization of microarrays was performed at the Gene Expression/Microarray Core of the University of Wisconsin Biotechnology Center under supervision of Sandra Splinter Bondurant. This work was funded by the National Institute of Environmental Health Sciences (R15 ES011130) and by an Education Grant to Kenyon College from the Howard Hughes Medical Institute.
Role of the Funding Sources
The awarding agencies of grants supporting this study (NIEHS, HHMI) had no direct role in study design; in the collection, analysis and interpretation of data; in the writing of the report; or in the decision to submit the paper for publication. The content is solely the responsibility of the authors and does not necessarily represent the official views of the funding agencies.
Footnotes
Abbreviations: AHR, aryl hydrocarbon receptor; CYP, cytochrome P450; FICZ, 6-formylindolo[3,2-b]carbazole; TCDD, 2,3,7,8 tetrachlorodibenzo-p-dioxin; DMSO, dimethylsulfoxide; qRT-PCR, quantitative reverse transcriptase-polymerase chain reaction.
Publisher's Disclaimer: This is a PDF file of an unedited manuscript that has been accepted for publication. As a service to our customers we are providing this early version of the manuscript. The manuscript will undergo copyediting, typesetting, and review of the resulting proof before it is published in its final citable form. Please note that during the production process errors may be discovered which could affect the content, and all legal disclaimers that apply to the journal pertain.
References
- 1.Gu YZ, Hogenesch JB, Bradfield CA. The PAS superfamily: sensors of environmental and developmental signals. Annual review of pharmacology and toxicology. 2000;40:519–561. doi: 10.1146/annurev.pharmtox.40.1.519. [DOI] [PubMed] [Google Scholar]
- 2.Nguyen LP, Bradfield CA. The search for endogenous activators of the aryl hydrocarbon receptor. Chem Res Toxicol. 2008;21(1):102–116. doi: 10.1021/tx7001965. [DOI] [PMC free article] [PubMed] [Google Scholar]
- 3.Nebert DW, Roe AL, Dieter MZ, Solis WA, Yang Y, Dalton TP. Role of the aromatic hydrocarbon receptor and [Ah] gene battery in the oxidative stress response, cell cycle control, and apoptosis. Biochem Pharmacol. 2000;59(1):65–85. doi: 10.1016/s0006-2952(99)00310-x. [DOI] [PubMed] [Google Scholar]
- 4.Schmidt JV, Su GHT, Reddy JK, Simon MC, Bradfield CA. Characterization of a murine Ahr null allele: Involvement of the Ah receptor in hepatic growth and development. Proceedings of the National Academy of Sciences USA. 1996;93:6731–6736. doi: 10.1073/pnas.93.13.6731. [DOI] [PMC free article] [PubMed] [Google Scholar]
- 5.Whitlock JP. Induction of cytochrome P4501A1. Annual Review of Pharmacology and Toxicology. 1999;39:103–125. doi: 10.1146/annurev.pharmtox.39.1.103. [DOI] [PubMed] [Google Scholar]
- 6.Mandal PK. Dioxin: a review of its environmental effects and its aryl hydrocarbon receptor biology. J Comp Physiol B. 2005;175(4):221–230. doi: 10.1007/s00360-005-0483-3. [DOI] [PubMed] [Google Scholar]
- 7.Wincent E, Amini N, Luecke S, Glatt H, Bergman J, Crescenzi C, Rannug A, Rannug U. The suggested physiologic aryl hydrocarbon receptor activator and cytochrome P4501 substrate 6-formylindolo[3,2-b]carbazole is present in humans. J Biol Chem. 2009;284(5):2690–2696. doi: 10.1074/jbc.M808321200. [DOI] [PubMed] [Google Scholar]
- 8.Rannug A, Rannug U, Rosenkranz HS, Winqvst L, Westerholm R, Agurell E, Grafstrom AK. Certain photooxidized derivatives of tryptophan bind with very high affinity to the Ah receptor and are likely to be endogenous signal substances. J Biol Chem. 1987;262:15422–15427. [PubMed] [Google Scholar]
- 9.Fritsche E, Schafer C, Calles C, Bernsmann T, Bernshausen T, Wurm M, Hubenthal U, Cline JE, Hajimiragha H, Schroeder P, Klotz LO, Rannug A, Furst P, Hanenberg H, Abel J, Krutmann J. Lightening up the UV response by identification of the arylhydrocarbon receptor as a cytoplasmatic target for ultraviolet B radiation. Proc Natl Acad Sci U S A. 2007;104(21):8851–8856. doi: 10.1073/pnas.0701764104. [DOI] [PMC free article] [PubMed] [Google Scholar]
- 10.Jung RE, Walker MK. Effects of 2,3,7,8-Tetrachlorodibenzo-p-dioxin (TCDD) on development of anuran amphibians. Environmental Toxicology and Chemistry. 1997;16(2):230–240. [Google Scholar]
- 11.Lavine JA, Rowatt AJ, Klimova T, Whitington AJ, Dengler E, Beck C, Powell WH. Aryl hydrocarbon receptors in the frog Xenopus laevis: two AhR1 paralogs exhibit low affinity for 2,3,7,8-tetrachlorodibenzo-p-dioxin (TCDD) Toxicological sciences. 2005;88(1):60–72. doi: 10.1093/toxsci/kfi228. [DOI] [PMC free article] [PubMed] [Google Scholar]
- 12.Martin OC, Gunawardane RN, Iwamatsu A, Zheng Y. Xgrip109: a gamma tubulin-associated protein with an essential role in gamma tubulin ring complex (gammaTuRC) assembly and centrosome function. J Cell Biol. 1998;141(3):675–687. doi: 10.1083/jcb.141.3.675. [DOI] [PMC free article] [PubMed] [Google Scholar]
- 13.Hankinson O, Brook BA, Weir-Brown KI, Hoffman EC, Johnson BS, Nanthur J, Reyes H, Watson AJ. Genetic and molecular analysis of Ah receptor and of Cyp1a1 gene expression. Biochimie. 1991;73:61–66. doi: 10.1016/0300-9084(91)90075-c. [DOI] [PubMed] [Google Scholar]
- 14.Jonsson M, Franks D, Woodin B, Jenny M, Garrick R, Behrendt L, Hahn ME, Stegeman JJ. The tryptophan photoproduct 6-formylindolo[3,2b]carbazole (FICZ) binds multiple AHRs an d inducees multiple CYP1 genes via AHR2 in zebrafish. Chem Biol Interact. 2009 doi: 10.1016/j.cbi.2009.1007.1003. in press. [DOI] [PMC free article] [PubMed] [Google Scholar]
- 15.Rokaw MD, Sarac E, Lechman E, West M, Angeski J, Johnson JP, Zeidel ML. Chronic regulation of transepithelial Na+ transport by the rate of apical Na+ entry. Am J Physiol. 1996;270(2 Pt 1):C600–607. doi: 10.1152/ajpcell.1996.270.2.C600. [DOI] [PubMed] [Google Scholar]
- 16.Okey AB. An aryl hydrocarbon receptor odyssey to the shores of toxicology: the Deichmann Lecture, International Congress of Toxicology-XI. Toxicol Sci. 2007;98(1):5–38. doi: 10.1093/toxsci/kfm096. [DOI] [PubMed] [Google Scholar]
- 17.Oberg M, Bergander L, Hakansson H, Rannug U, Rannug A. Identification of the tryptophan photoproduct 6-formylindolo[3,2-b]carbazole, in cell culture medium, as a factor that controls the background aryl hydrocarbon receptor activity. Toxicological sciences. 2005;85(2):935–943. doi: 10.1093/toxsci/kfi154. [DOI] [PubMed] [Google Scholar]
- 18.Diani-Moore S, Labitzke E, Brown R, Garvin A, Wong L, Rifkind AB. Sunlight generates multiple tryptophan photoproducts eliciting high efficacy CYP1A induction in chick hepatocytes and in vivo. Toxicol Sci. 2006;90(1):96–110. doi: 10.1093/toxsci/kfj065. [DOI] [PubMed] [Google Scholar]
- 19.Kennedy SW, Jones SP. Simultaneous measurement of cytochrome P4501A catalytic activity and total protein concentration with a fluorescence plate reader. Anal Biochem. 1994;222(1):217–223. doi: 10.1006/abio.1994.1476. [DOI] [PubMed] [Google Scholar]
- 20.Hestermann EV, Stegeman JJ, Hahn ME. Relative contributions of affinity and intrinsic efficacy to aryl hydrocarbon receptor ligand potency. Toxicol Appl Pharmacol. 2000;168(2):160–172. doi: 10.1006/taap.2000.9026. [DOI] [PubMed] [Google Scholar]
- 21.Poland A, Glover E. Genetic expression of aryl hydrocarbon hydroxylase by 2,3,7,8-tetrachlorodibenzo-p-dioxin: evidence for a receptor mutation in genetically non-responsive mice. Molecular Pharmacology. 1975;11:389–398. [Google Scholar]
- 22.Kannan G, Wilks JC, Fitzgerald DM, Jones BD, Bondurant SS, Slonczewski JL. Rapid acid treatment of Escherichia coli: transcriptomic response and recovery. BMC Microbiol. 2008;8:37. doi: 10.1186/1471-2180-8-37. [DOI] [PMC free article] [PubMed] [Google Scholar]
- 23.Bollerot K, Angelier N, Coumailleau P. Molecular cloning and embryonic expression of the Xenopus Arnt gene. Mechanisms of Development. 2001;108(1–2):227–231. doi: 10.1016/s0925-4773(01)00488-9. [DOI] [PubMed] [Google Scholar]
- 24.Rowatt AJ, DePowell JJ, Powell WH. ARNT gene multiplicity in amphibians: Characterization of ARNT2 from the frog Xenopus laevis. Journal of Experimental Zoology. 2003;300B(1):48–57. doi: 10.1002/jez.b.45. [DOI] [PubMed] [Google Scholar]
- 25.Fujita Y, Ohi H, Murayama N, Saguchi K, Higuchi S. Molecular cloning and sequence analysis of cDNAs coding for 3-methylcholanthrene-inducible cytochromes P450 in Xenopus laevis liver. Arch Biochem Biophys. 1999;371(1):24–28. doi: 10.1006/abbi.1999.1425. [DOI] [PubMed] [Google Scholar]
- 26.Drutel G, Kathmann M, Heron A, Schwartz JC, Arrang JM. Cloning and selective expression in brain and kidney of ARNT2 homologous to the Ah receptor nuclear translocator (ARNT) Biochemical and Biophysical Research Communications. 1996;225:333–339. doi: 10.1006/bbrc.1996.1176. [DOI] [PubMed] [Google Scholar]
- 27.Hirose K, Morita M, Ema M, Mimura J, Hamada H, Fujii H, Saijo Y, Gotoh O, Sogawa K, Fujii-Kuriyama Y. cDNA cloning and tissue-specific expression of a novel basic helix-loop-helix/PAS factor (Arnt2) with close sequence similarity to the aryl hydrocarbon receptor nuclear translocator (Arnt) Mol Cell Biol. 1996;16(4):1706–1713. doi: 10.1128/mcb.16.4.1706. [DOI] [PMC free article] [PubMed] [Google Scholar]
- 28.Powell WH, Karchner SI, Bright R, Hahn ME. Functional diversity of vertebrate ARNT proteins: Identification of ARNT2 as the predominant form of ARNT in the marine teleost, Fundulus heteroclitus. Archives of Biochemistry and Biophysics. 1999;361(1):156–163. doi: 10.1006/abbi.1998.0992. [DOI] [PubMed] [Google Scholar]
- 29.Antkiewicz DS, Peterson RE, Heideman W. Blocking expression of AHR2 and ARNT1 in zebrafish larvae protects against cardiac toxicity of 2,3,7,8-tetrachlorodibenzo-p-dioxin. Toxicol Sci. 2006;94(1):175–182. doi: 10.1093/toxsci/kfl093. [DOI] [PubMed] [Google Scholar]
- 30.Dougherty EJ, Pollenz RS. Analysis of Ah receptor-ARNT and Ah receptor-ARNT2 complexes in vitro and in cell culture. Toxicol Sci. 2008;103(1):191–206. doi: 10.1093/toxsci/kfm300. [DOI] [PMC free article] [PubMed] [Google Scholar]
- 31.Wei YD, Bergander L, Rannug U, Rannug A. Regulation of CYP1A1 transcription via the metabolism of the tryptophan-derived 6-formylindolo[3,2-b]carbazole. Archives of biochemistry and biophysics. 2000;383(1):99–107. doi: 10.1006/abbi.2000.2037. [DOI] [PubMed] [Google Scholar]
- 32.Wei YD, Helleberg H, Rannug U, Rannug A. Rapid and transient induction of CYP1A1 gene expression in human cells by the tryptophan photoproduct 6-formylindolo[3,2-b]carbazole. Chem Biol Interact. 1998;110(1–2):39–55. doi: 10.1016/s0009-2797(97)00111-7. [DOI] [PubMed] [Google Scholar]
- 33.Hughes AL. The evolution of functionally novel proteins after gene duplication. Proc Biol Sci. 1994;256(1346):119–124. doi: 10.1098/rspb.1994.0058. [DOI] [PubMed] [Google Scholar]
- 34.Quintana FJ, Basso AS, Iglesias AH, Korn T, Farez MF, Bettelli E, Caccamo M, Oukka M, Weiner HL. Control of T(reg) and T(H)17 cell differentiation by the aryl hydrocarbon receptor. Nature. 2008;453(7191):65–71. doi: 10.1038/nature06880. [DOI] [PubMed] [Google Scholar]
- 35.Hestermann EV, Brown M. Agonist and chemopreventative ligands induce differential transcriptional cofactor recruitment by aryl hydrocarbon receptor. Mol Cell Biol. 2003;23(21):7920–7925. doi: 10.1128/MCB.23.21.7920-7925.2003. [DOI] [PMC free article] [PubMed] [Google Scholar]
- 36.Klein SL, Strausberg RL, Wagner L, Pontius J, Clifton SW, Richardson P. Genetic and genomic tools for Xenopus research: The NIH Xenopus initiative. Dev Dyn. 2002;225(4):384–391. doi: 10.1002/dvdy.10174. [DOI] [PubMed] [Google Scholar]
- 37.Devary Y, Rosette C, DiDonato JA, Karin M. NF-kappa B activation by ultraviolet light not dependent on a nuclear signal. Science. 1993;261(5127):1442–1445. doi: 10.1126/science.8367725. [DOI] [PubMed] [Google Scholar]
- 38.Rosette C, Karin M. Ultraviolet light and osmotic stress: activation of the JNK cascade through multiple growth factor and cytokine receptors. Science. 1996;274(5290):1194–1197. doi: 10.1126/science.274.5290.1194. [DOI] [PubMed] [Google Scholar]
- 39.Agostinis P, Garmyn M, Van Laethem A. The Aryl hydrocarbon receptor: an illuminating effector of the UVB response. Sci STKE. 2007;2007(403):pe49. doi: 10.1126/stke.4032007pe49. [DOI] [PubMed] [Google Scholar]
- 40.Mukai M, Tischkau SA. Effects of tryptophan photoproducts in the circadian timing system: searching for a physiological role for aryl hydrocarbon receptor. Toxicol Sci. 2007;95(1):172–181. doi: 10.1093/toxsci/kfl126. [DOI] [PubMed] [Google Scholar]
- 41.Stephan FK, Zucker I. Circadian rhythms in drinking behavior and locomotor activity of rats are eliminated by hypothalamic lesions. Proc Natl Acad Sci U S A. 1972;69(6):1583–1586. doi: 10.1073/pnas.69.6.1583. [DOI] [PMC free article] [PubMed] [Google Scholar]
- 42.Ceriani MF, Darlington TK, Staknis D, Mas P, Petti AA, Weitz CJ, Kay SA. Light-dependent sequestration of TIMELESS by CRYPTOCHROME. Science. 1999;285(5427):553–556. doi: 10.1126/science.285.5427.553. [DOI] [PubMed] [Google Scholar]
- 43.Selby CP, Thompson C, Schmitz TM, Van Gelder RN, Sancar A. Functional redundancy of cryptochromes and classical photoreceptors for nonvisual ocular photoreception in mice. Proc Natl Acad Sci U S A. 2000;97(26):14697–14702. doi: 10.1073/pnas.260498597. [DOI] [PMC free article] [PubMed] [Google Scholar]
- 44.Mukai M, Lin TM, Peterson RE, Cooke PS, Tischkau SA. Behavioral rhythmicity of mice lacking AhR and attenuation of light-induced phase shift by 2,3,7,8-tetrachlorodibenzo-p-dioxin. J Biol Rhythms. 2008;23(3):200–210. doi: 10.1177/0748730408316022. [DOI] [PMC free article] [PubMed] [Google Scholar]
- 45.Shimba S, Watabe Y. Crosstalk between the AHR signaling pathway and circadian rhythm. Biochem Pharmacol. 2009;77(4):560–565. doi: 10.1016/j.bcp.2008.09.040. [DOI] [PubMed] [Google Scholar]
- 46.Tinsley R, Loumont C, Kobel H. Geographical Distribution and Ecology. In: Tinsley R, Kobel H, editors. The Biology of Xenopus. Oxford University Press; New York: 1996. [Google Scholar]
Associated Data
This section collects any data citations, data availability statements, or supplementary materials included in this article.


