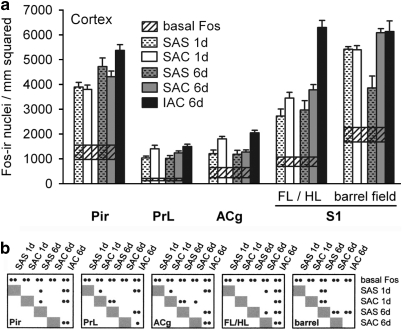
Figure 9.
(a-b) Graphs illustrating the density of Fos-immunoreactive nuclei in some cortical structures, including the piriform (Pir), prelimbic (PrL), anterior cingulate (ACg), and primary somatosensory (S1), for the experimental groups as described in the text. Conventions are as in Figure 6. FL/HL,forelimb/hindlimb area; IAC,investigator-administered cocaine; SAC,self-administered cocaine; SAS,self-administered saline.

