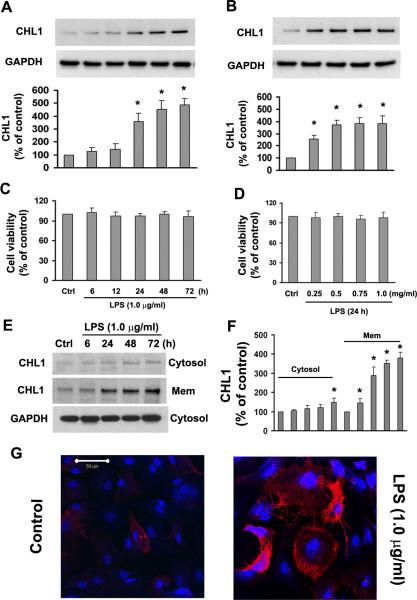
Fig. 1.
LPS upregulates CHL1 protein expression in primary cultures of mouse astrocytes. A. Time-dependence and B. dose-dependence of CHL1 expression upon treatment with LPS. The representative immunoblots of culture lysates show protein levels of CHL1 (top panel). GAPDH (bottom panel) was used as a loading control. Relative levels of CHL1 expression are shown as a percentage of the non-treated control group (control (Ctrl) set to 100%). *P<0.05 versus control group without LPS. C–D. Cell viability was examined by the MTT assay. N=5. E–F. The expression of CHL1 was determined and quantified in the cytosolic and membrane fractions of cultured astrocytes after LPS treatment. *P<0.05 versus control group without LPS. G. The astrocytes with (right) or without (left) treatment with 1.0 μg/ml LPS for 2 days were stained with goat anti-CHL1 antibody and visualized under a Zeiss LSM 5 confocal laser-scanning microscope. Scale bar = 50 μm .

