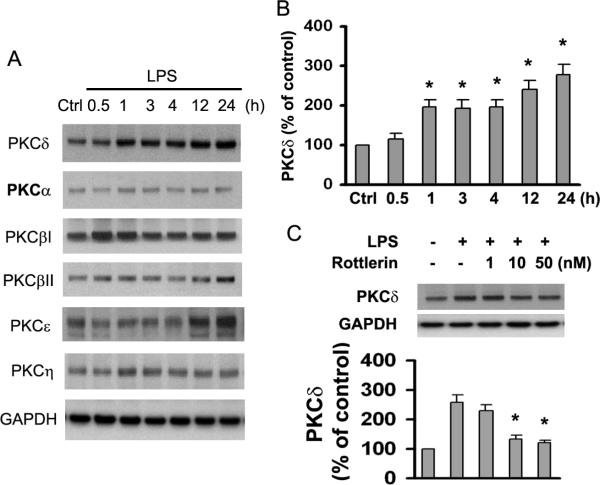
Fig. 3.
LPS induces expression of different PKC isoforms in cultured astrocytes. A. Time course of the effect of LPS treatment on PKC isoform expression. Control (Ctrl) refers to incubation without LPS for 24 h. This pertains also to the other figures and concomitant legends. GAPDH was used as loading control. B. Expression levels of PKCδ after LPS treatment were determined. C. Cells preincubated for 1 h with the indicated concentrations of Rottlerin were treated with LPS (1.0 μg/ml) for 24 h. PKCδ expression in cell lysates was quantified by immunoblot analysis.

