

Abstract
Background and purpose:
We have established an in vitro model of acute tubular necrosis in rat kidney tubular cells, using combined oxygen-glucose deprivation (COGD) and screened a library of 1280 pharmacologically active compounds for cytoprotective effects.
Experimental approach:
We used in vitro cell-based, high throughput, screening, with cells subjected to COGD using hypoxia chambers, followed by re-oxygenation. The 3-(4,5-dimethylthiazol-2-yl)-2,5-diphenyltetrazolium bromide (MTT) and the Alamar Blue assay measured mitochondrial respiration and the lactate dehydrogenase assay was used to indicate cell death. ATP levels were measured using a luminometric assay.
Key results:
Adenosine markedly reduced cellular injury, with maximal cytoprotective effect at 100 µM and an EC50 value of 14 µM. Inosine was also found to be cytoprotective. The selective A3 adenosine receptor antagonist MRS 1523 attenuated the protective effects of adenosine and inosine, while an A3 adenosine receptor agonist provided a partial protective effect. Adenosine deaminase inhibition attenuated the cytoprotective effect of adenosine but not of inosine during COGD. Inhibition of adenosine kinase reduced the protective effects of both adenosine and inosine during COGD. Pretreatment of the cells with adenosine or inosine markedly protected against the fall in cellular ATP content in the cells subjected to COGD.
Conclusions and implications:
The cytoprotection elicited by adenosine and inosine in a model of renal ischaemia involved both interactions with cell surface adenosine receptors on renal tubular epithelial cells and intracellular metabolism and conversion of adenosine to ATP.
Keywords: kidney, hypoxia, ischaemia, reperfusion injury, high throughput screening, adenosine, inosine, metabolism, adenosine receptors
Introduction
Acute tubular necrosis (ATN) is the major form of renal tubular cell death, which occurs if oxygen and energy supply is decreased due to reduced blood flow (ischaemic ATN) or after a toxic drug exposure (nephrotoxic ATN) (Chatterjee, 2007). ATN is the most common cause of acute renal failure (ARF) (Rosen, 2008) and there is no specific treatment for ATN. Identification of novel therapeutic approaches that ameliorate ATN may have a significant effect on outcomes of renal disease. A number of pharmacological interventions have been investigated for their ability to reduce renal ischaemia-reperfusion (I/R) injury and ischaemic ARF. Amongst other approaches, atrial natriuretic peptide, low-dose dopamine and the loop diuretic furosemide showed promise in animal models of ARF but were found to be ineffective in clinical trials (Edelstein et al., 1997; Dishart and Kellum, 2000; Venkataraman and Kellum 2000, 2003; Chatterjee and Thiemermann, 2003).
Ischaemia followed by reperfusion causes a characteristic injury to organs and tissues. The ischaemic injury is triggered by the lack of tissue oxygenation (hypoxia), while a subsequent reperfusion injury is induced by the restoration of oxygen supply (Szabo, 1996). Emerging pharmacological cytoprotective approaches in ARF include inhibitors of poly(ADP-ribose) polymerase (PARP), antioxidants, inhibitors of nitric oxide and peroxynitrite generation, peroxisome proliferator-activated receptor (PPAR) agonists, carbon monoxide and many others (Chatterjee, 2007). Ischaemic preconditioning, defined as multiple cycles of brief ischaemia and reperfusion before a prolonged ischaemic insult exerts protective effects in the kidney (Lee and Emala 2000); these effects are mediated, at least in part, by the release of adenosine during preconditioning (Lee and Emala 2000; Sugino et al., 2001; Li et al., 2005; Joo et al., 2006, 2007).
In order to identify novel molecules with cytoprotective properties, a cell-based system biology approach can be used. This approach, as opposed to target-centred drug discovery, utilizes a whole-cell based read-out (such as improvement in cell viability, inhibition of angiogenesis, changes in cell differentiation patterns, etc.), without a priori invoking any specific pathway or pharmacological target (Chen et al., 2004; Degterev et al., 2005; Sams-Dodd, 2005; Spedding et al., 2005; Xu et al., 2008). Using this approach, various molecular libraries can be screened. Molecules with positive results can subsequently be characterized and can undergo chemical modification as well as identification of their cellular mode of action (Butcher, 2005). Our research group has recently developed an in vitro cell-based assay to model ischaemia-reperfusion injury in the heart (Gero et al., 2007), and by screening a library of pharmacologically active compounds (LOPAC) obtained commercially (Sigma, St. Louis, MO, USA) has identified several molecules with previously unrecognized cytoprotective effects.
We have now established an in vitro model of acute tubular necrosis (ATN) in normal rat kidney epithelial (NRK) cells and applied a cell-based high-throughput approach to screen compound libraries and identify compounds with cytoprotective effects. As shown here, adenosine and inosine were identified as compounds with the most pronounced cytoprotective effects. We have conducted a subsequent integrated pharmacological characterization of these molecules, in order to investigate their cellular mode of action.
Methods
Cell culture
Normal rat kidney epithelial (NRK) cells were obtained from the European Collection of Cell Cultures (ECACC, Salisbury, UK) and maintained in Dulbecco's modified Eagle's medium (DMEM) supplemented with 10% fetal bovine serum (Invitrogen, Carlsbad, CA, USA), 4 mM glutamine, 100 IU·mL−1 penicillin and 100 µg·mL−1 streptomycin. Three days prior to the assay, 5 × 10³ cells per well were plated into 96-well tissue culture plates and cultured at 37°C at 5% CO2 atmosphere. NRK cells from passage numbers 12–13 were used for compound library screening, and passage numbers 10–25 were used for subsequent assays.
In vitro ATN model
We have developed an in vitro cell-based assay of ATN in NRK proximal tubular cells (Advani et al., 2009). NRK cells were plated into 96-well tissue culture plates and cultured for 3 days to form a confluent monolayer. Culture medium was replaced with DMEM containing no glucose (Biochrom AG, Berlin, Germany) prior to induction of hypoxia. Culture plates were placed in gas-tight incubation chambers (Billups-Rothenberg Inc, Del Mar, CA, USA) and the chamber atmosphere was replaced by flushing the chamber with 95% N2: 5% CO2 mixture (Linde Gas, Hungary) at 25 L·min−1 flow rate for 5 min. The hypoxic chamber was sealed and incubated at 37°C for the indicated time periods. After hypoxia the culture medium was removed and fresh DMEM containing 1 g·L−1 glucose supplemented with 10% FBS was added and the cells underwent re-oxygenation at 37°C and 5% CO2 atmosphere for various time periods depending on the experimental protocol. Cells exposed to hypoxia in complete culture medium served as controls (CTL), as no reduction was detected in cell viability compared to cells maintained at normal culture conditions (complete culture medium, 5% CO2 atmosphere, 37°C), if NRK cells were exposed to oxygen depletion with culture medium containing 1 g·L−1 glucose and 10% serum for 36 h.
The LOPAC library of compounds was screened using a 16-h-long hypoxia protocol, combined with 4 h of re-oxygenation. The compounds were administered before hypoxia induction and screened in duplicates. Test compounds were removed from the screen during the washout that preceded the re-introduction of glucose and the re-oxygenation period: therefore, compounds were only present during the COGD period. The screen was performed in duplicate and independently repeated using the same experimental setting. In the subsequent studies focusing on adenosine and inosine, different periods of hypoxia and re-oxygenation were used. In various studies we tested various periods of hypoxia (0–4–8–24–36 h) and subsequent re-oxygenation (0–4–8–24 h). Four groups were studied (n = 24 for each group). The first group received pretreatment with adenosine, while the second group was pretreated with inosine prior to COGD conditions (from 30–300 µM, applied 10 min before hypoxia). The third group (control) was subjected to COGD with drug vehicle only. The fourth group was the negative control group of the assay in which the cells were cultured in glucose containing medium (1 g/L) and kept at 37°C at 5% CO2 atmosphere during the entire assay period. At the end of the experiments, 3-(4,5-dDimethylthiazol-2-yl)-2,5-diphenyltetrazolium bromide (MTT) and Alamar Blue (Resazurin sodium salt; 7-hydroxy-3H-phenoxazin-3-one-10-oxide sodium salt) viability assays and the LDH cytotoxicity assay were conducted as described below.
Pharmacological characterization of the cytoprotective effects of adenosine and inosine in the in vitro acute tubular necrosis model
The concentration-dependence of the cytoprotective effects was tested in NRK cells subjected to COGD with adenosine or inosine pretreatment (1, 3, 10, 30, 100, 300, 1000 µM, n = 3 each). The effects of adenosine and inosine were compared on the same 96-well tissue culture plates. The A1 adenosine receptor antagonist 8-cyclopentyl-1,3-dipropylxanthine (CDPX) (Bruns et al., 1987), the selective A2A antagonist 8-(3-chlorostyryl) caffeine (CSC) (Lee and Emala 2001), the selective A2B adenosine receptor antagonist alloxazine (Rose'Meyer et al., 2003) and the A3 adenosine receptor antagonist MRS 1523 (Di Sole et al., 2008) (all nomenclature follows Alexander et al., 2008) were added 30 min prior to adenosine or inosine (30 or 300 µM) and COGD in the concentrations indicated. The cytotoxicity of receptor antagonists was also tested under normoxic conditions. The selective A3 adenosine receptor agonist, N6-(3-iodobenzyl)-adenosine-5′-N-methyluronamide (IB-MECA) was applied to the cells in the indicated concentrations and cells were subjected to COGD (n = 3 in all groups).
The adenosine deaminase inhibitor, erythro-9-(2-hydroxy-3-nonyl) adenine hydrochloride (EHNA) (Haun et al., 1996) and the adenosine kinase inhibitor, 4-amino-5-(3-bromophenyl)-7-(6-morpholino-pyridin-3-yl)pyrido (2,3-d)pyrimidine (ABT 702) (Jarvis et al., 2000; Kowaluk et al., 2000) were applied at 10 and 30 µM, prior to adenosine or inosine and COGD. The combined administration of EHNA and ABT 702 was also investigated in the renal necrosis model. The cytoprotective effects of glucose, adenosine and inosine were directly compared at a wider concentration range (1 µM–3 mM) on cell viability during COGD (n = 16–32) and the administration of ABT 702 on the protective effect of glucose was also investigated. In all studies, all relevant assay conditions (agonists and antagonists; adenosine and inosine comparisons, etc.) were represented on the same 96-well tissue culture plate to prevent inter-plate assay variability. The experiments were repeated independently at least three times, and the composite responses are shown in the figures.
Cell viability assay
To estimate the number of viable cells, 3-(4,5-dimethyl-2-thiazolyl)-2,5-diphenyl-2H-tetrazolium bromide (MTT) was added to the cells at a final concentration of 0.5 mg·mL−1 and cultured at 37 °C at 5% CO2 atmosphere for 3 h (Jagtap et al., 2002; Toth-Zsamboki et al., 2006). Cells were washed with PBS and the converted formazan dye was dissolved in isopropanol and measured at 570 nm with background measurement at 690 nm on a Powerwave reader (Biotek, Winooski, VT, USA). A calibration curve was created by measuring the converting capacity of MTT of serial dilutions of NRK cells. The viable cell count was calculated using Gen5 data reduction software.
Alamar Blue cell viability assay
Alamar Blue (resazurin, 7-hydroxy-3H-phenoxazin-3-one-10-oxide) was added to the cells at a final concentration of 10 µg·mL−1 and cultured at 37°C at 5% CO2 atmosphere for 3 h and fluorescence was measured on Synergy2 (Ex/Em: 530/590 nm) (Biotek, Winooski, VT, USA). A calibration curve was created using serial dilutions of NRK cells. The viable cell count was calculated using Gen5 data reduction software.
Lactate dehydrogenase (LDH) cytotoxicity assay
Cell culture supernatant (30 µL) was mixed with 100 µL freshly prepared LDH assay reagent to reach final concentrations of 85 mM lactic acid, 1040 mM nicotinamide adenine dinucleotide (NAD), 224 mM N-methylphenazonium methyl sulphate (PMS), 528 mM 2-(4-iodophenyl)-3-(4-nitrophenyl)-5-phenyl-2H-tetrazolium chloride (INT) and 200 mM Tris (pH 8.2). The changes in absorbance were read kinetically at 492 nm for 15 min. LDH activity values are shown as Vmax for kinetic assay in mOD/min (Gero et al., 2007).
Measurement of cellular ATP levels
ATP concentration was determined by a commercially available assay (CellTiter-Glo® Luminescent Cell Viability Assay, Promega, Madison, WI, USA). NRK cultures were exposed to 16 h of combined oxygen-glucose deprivation in 96-well plates and were lysed in 100 µL of CellTiter-Glo reagent. The luminescent signal was recorded for 1 s using a multimode reader (Synergy 2, Biotek, Winooski, VT, USA). Serial dilutions of ATP were used as calibration standards and the ATP content was calculated for each well.
Statistical analysis
Data are shown as mean ± SEM values. One-way anova was used to detect differences between groups. Post hoc comparisons were made using Tukey's test. Data were also analyzed with Student's unpaired t-test. A value of P < 0.05 was considered statistically significant. EC50 values were calculated using non-linear regression. All statistical calculations were performed using Graphpad Prism 5 analysis software.
Materials
Adenosine, inosine, 8-cyclopentyl-1,3-dipropylxanthine (CDPX), 8-(3-chlorostyryl) caffeine (CSC), alloxazine, MRS 1523, N6-(3-iodobenzyl)-adenosine-5′-N-methyluronamide (IB-MECA), erytro-9-(2-hydroxy-3-nonyl) adenine hydrochloride (EHNA) and the library of 1280 pharmacologically active compounds (LOPAC1280) were obtained from Sigma-Aldrich (St. Louis, MO, USA). The library compounds were provided at 10 mM in dimethyl sulphoxide (DMSO) and dilutions were made either in DMSO or phosphate buffered saline (PBS, pH 7.4) to obtain 0.5% DMSO in the assay volume and 50 µM final concentration. ABT 702 [4-amino-5-(3-bromophenyl)-7-(6-morpholino-pyridin-3-yl)pyrido (2,3-d)pyrimidine, 2HCl] was purchased from Calbiochem (Merck, Darmstadt, Germany). The receptor antagonists, as well as IB-MECA and ABT 702 were dissolved in DMSO: dilutions were made in phosphate buffered saline (PBS, pH 7.4) to obtain 0.5% DMSO in the assay volume. EHNA was dissolved in distilled water. Adenosine and inosine were dissolved in DMEM without glucose.
Results
Characterization of an in vitro acute tubular necrosis model in NRK cells
To develop a reproducible in vitro acute tubular necrosis model in NRK cells, we tested different periods (12, 16, 20, 24 or 36 h) of combined glucose-oxygen deprivation (COGD), followed by a subsequent re-oxygenation period of 4 h. Twelve hours of hypoxia combined with 4 h re-oxygenation already induced a detectable decline of the cell viability (Figure 1). A much longer period (36 h) of hypoxia followed by 4 h re-oxygenation irreversibly reduced cellular viability to undetectable level in the COGD group (Figure 1). Sixteen hours COGD followed by 4 h re-oxygenation resulted in a significant and consistent reduction in cell viability and was associated with a significant elevation of LDH activity in the supernatant (Figure 1). The Alamar blue assay detected a 60% reduction, while the MTT viability assay possibly overestimated the viability reduction to 80% as a result of decreased mitochondrial function (Figure 2A,B). Various re-oxygenation periods (0, 4, 8 and 24 h) were also investigated after the 16-h COGD. In the first 4 h of the re-oxygenation period, there was slight evidence for increased cell injury, as measured by the LDH assay (Figure 2B). However, the mitochondrial respiration assays (MTT, Alamar Blue) were largely unchanged between 4–24 h of re-oxygenation. Overall, these data indicate that in the current assay the majority of cell injury is induced by the hypoxic and not the re-oxygenation period.
Figure 1.
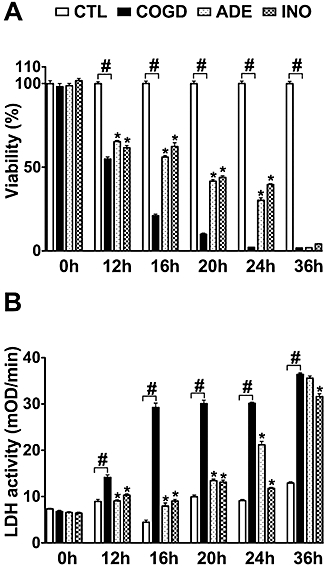
Adenosine and inosine reduce NRK cell injury during prolonged oxygen-glucose deprivation. Confluent NRK cultures were subjected to combined oxygen-glucose deprivation (COGD) for the indicated lengths. Viability was determined after 4 h of recovery by the MTT assay (A) and LDH activity (B) was measured in the supernatant. Adenosine was applied at 100 µM (ADE) and inosine at 300 µM (INO) preceding the hypoxic period. Controls (CTL) were exposed to hypoxia in complete culture medium and showed similar viability and LDH release to cells maintained under normoxic conditions. Data are shown as mean ± SEM values (n = 72). #P < 0.05 compared to CTL, *P < 0.05 compared to COGD.
Figure 2.
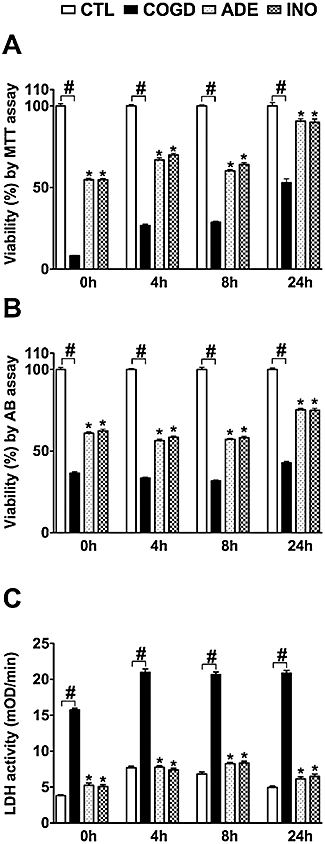
Adenosine and inosine pretreatment enhances cellular recovery after prolonged oxygen-glucose deprivation. Confluent NRK cultures were exposed to a 16-h-long combined oxygen-glucose deprivation (COGD) followed by an aerobic recovery period of the indicated length. Cellular viability was evaluated by the MTT (A) and Alamar Blue (AB) assays (B), and LDH activity (C) was measured in the supernatant. Adenosine was applied at 100 µM (ADE) and inosine at 300 µM (INO) preceding the hypoxic period and was present throughout the COGD. Controls (CTL) were exposed to hypoxia in complete culture medium and showed similar viability and LDH release to cells maintained under normoxic conditions. Data are shown as mean ± SEM values (n = 72). #P < 0.05 compared to CTL, *P < 0.05 compared to COGD.
Screening of the LOPAC library in the acute tubular necrosis model in NRK cells
Screening of the LOPAC library in the current assay (involving 16 h of hypoxia and 4 h of re-oxygenation) produced unexpected results in that most of the compounds in this library were without any significant cytoprotective effects. Importantly, 4-amino-1,8-naphthalimide, 6(5H)-phenanthridinone, (±)-chloro-APB hydrobromide, R(+)-6-bromo-APB hydrobromide, SKF 83565 hydrobromide and cinnarizine – compounds that have previously exerted cytoprotective effects in a rat cardiac myoblast model in which cell necrosis was triggered by hydrogen peroxide (Gero et al., 2007) – were found to be ineffective in the current assay. However, the screening has demonstrated that adenosine and some of its derivatives (2-phenylaminoadenosine, an adenosine receptor agonist with selectivity for the A2 receptor subtype and suramine, a P2X and P2Y receptor antagonist, antiparasitic and anti-tumor agent) exerted cytoprotective effects (Table 1). Our subsequent studies were re-focused to characterize the mode of the cytoprotective effect of adenosine, as well as inosine, its structurally closely related metabolite. In addition to adenosine, several adenosine receptor modulators exerted modest cytoprotective effects. Several additional compounds, which are known to influence cellular ion handling and intracellular metabolism, exerted cytoprotective effects or trends towards cytoprotection in the current assay (Table 1), but the overall degree of protection was inferior to the effect of adenosine; follow-up investigation around these effects is not subject of the current report.
Table 1.
A list of molecules from the LOPAC library that exerted cytoprotective effects in NRK cells exposed to combined glucose-oxygen deprivation (COGD) and following re-oxygenation. The relative cytoprotective effects are shown as percent values based on the increase in MTT conversion relative to the COGD versus CTL groups. (CTL group of the cells was defined as 100% cytoprotection and the cells in the COGD group were defined as 0% cytoprotection.) Compounds with cytoprotective values above 15% are listed. The relative changes of the LDH activity compared to the COGD group are shown as percent values. Data are shown as mean± SEM (n= 3)
| Compound | Potential mode of action |
Cytoprotection (%) |
|
|---|---|---|---|
| MTT assay | LDH-activity | ||
| Adenosinergic and purinergic compounds | |||
| Adenosine | A3 adenosine receptor actiation, energy source via degradation | 29 ± 3* | −99 ± 4* |
| 2-Phenylaminoadenosine | A2 adenosine receptor activation | 25 ± 3* | −66 ± 2* |
| 3-Deazaadenosine | Adenosylhomocysteine hydrolysis inhibitor | 18 ± 11 | −81 ± 37 |
| Suramine hexasodium 2′,3′-Didehydro-3′-deoxythymidine | A P2x and P2Y receptor antagonism nucleoside analogue, metabolic degradation? | 16 ± 17* | −60 ± 12 |
| 15 ± 7 | 0 | ||
| Phosphorylation inhibitors | |||
| LY-294,002 hydrochloride | A phosphatidylinositol 3-kinase inhibitor | 23 ± 2* | −58 ± 7 |
| Endothall | A phosphatase 2A (PP2A) inhibitor | 20 ± 10 | −35 ± 14 |
| Agents that preserve intracellular ATP by blocking ATP-dependent active transporters | |||
| 1-(4-Fluorobenzyl)-5-methoxy-2-methylindole-3-acetic acid | A multidrug Resistance-Associated Protein 1 inhibitor | 22 ± 8 | −61 ± 21 |
| Inhibition of NO production | |||
| NG,NG-dimethylarginine hydrochloride | A reversible inhibitor of nitric oxide synthase (NOS) | 21 ± 10* | −12 ± 12 |
| Ion channel modulators: preserving the integrity of the cell membrane, influencing Na+, K+and Ca2+ion flow. | |||
| Disopyramide phosphate | A K+ channel modulator | 19 ± 12 | −36 ± 45 |
| 5,5-Diphenylhydantoin | A modulator of Na+, K+, and Ca2+ channels | 16 ± 7 | 0 |
| Dantrolene sodium | RyR channel/intracellular calcium regulator | 15 ± 11 | −60 ± 42 |
| Serotoninergic drugs, dopaminergic drugs and cholinergic drugs | |||
| (±)-DOI hydrochloride | A 5-HT2/5-HT1C serotonin receptor agonist | 18 ± 8 | −35 ± 43 |
| 5-Hydroxy-L-tryptophan | A serotonin precursor. | 15 ± 8 | 0 |
| 6,7-ADTN hydrobromide | A non-selective dopamine receptor agonist | 18 ± 13 | −32 ± 22 |
| 4′,4″-Difluoro-3alpha-(diphenylmethoxy)tropane hydrochloride | Dopamine reuptake inhibitor. | 18 ± 7 | −43 ± 12 |
| 3,4-Dihydroxyphenylacetic acid | A metabolite of L-DOPA | 17 ± 11 | −27 ± 32 |
| Droperidol | A D1, D2 dopamine receptor antagonist | 16 ± 8 | 0 |
| DBO-83 | A nicotinic acetylcholine receptor agonist | 16 ± 11 | −23 ± 35 |
| Modulators of cell cycle: Inhibition of proliferation, RNA or protein synthesis, energy preservation | |||
| D-ribofuranosyl-benzimidazole | A RNA synthesis inhibitor | 17 ± 7 | −24 ± 6 |
| Daidzein | A mitochondrial aldehyde dehydrogenase inhibitor, promotes cell cycle G1 arrest | 15 ± 11 | 0 |
| Preservation of intracellular glucose, by delaying the degradation of the oligo- or polysaccharides | |||
| 1-Deoxynojirimycin hydrochloride | An alpha-glucosidase 1-II enxyme inhibitor | 15 ± 10 | −26 ± 50 |
P < 0.05 represents a statistically significant protective effect when compared to vehicle control.
LDH, lactate dehydrogenase; MTT, 3-(4,5-dimethylthiazol-2-yl)-2,5-diphenyltetrazolium bromide.
Effects of adenosine and inosine on in vitro acute tubular necrosis
Adenosine and inosine increased the cell viability of NRK cultures during 12, 16 and 20 h of COGD and also reduced the LDH enzyme release from the cells. At the highest concentrations tested, adenosine and inosine also proved to be protective after 24 h of COGD (Figure 1). During the re-oxygenation period, the presence of adenosine and inosine markedly enhanced the recovery of cellular respiration, as assessed by the MTT assay (Figure 2A). The MTT-converting capacity of the adenosine – or inosine-treated cells was almost completely restored by 24 h, while the extracellular LDH activity did not increase during this period. These findings are consistent with the hypothesis that re-oxygenation per se does not induce cellular injury, but the surviving cell population displays a decreased metabolic rate as an adaptation to the prolonged oxygen-glucose depletion. Thus, the available viability assays tend to underestimate viability in the early phase of re-oxygenation. Cells require a considerable time to fully recover after the COGD and adenosine or inosine may help restore the metabolic functions. Similar, although less pronounced trends were also seen with the Alamar Blue assay: viability in the adenosine or inosine treated groups was higher at 24 h than, for instance, at the end of the COGD period (i.e. 0 h re-oxygenation) (Figure 2B).
Pharmacological characterization of the effects of adenosine and inosine in an in vitro acute tubular necrosis model
For subsequent, in-depth characterization of the effects of adenosine and inosine, we selected 16 h of hypoxia and 4 h of re-oxygenation period as the standard assay conditions. First, we established a dose-response comparison between the cytoprotective effects of adenosine and inosine, by testing each compound in a concentration range of 1 µM–1 mM. Adenosine reached the maximum cytoprotective effect at 100 µM, while inosine was found less potent with a highest protection detected from 300 µM and above. Adenosine completely abolished cellular LDH release at 30 µM, while inosine had similar effects at 100 µM. An EC50 value of 14 µM was calculated for adenosine and 43 µM for inosine based on the viability values obtained by the MTT assay (Figure 3).
Figure 3.
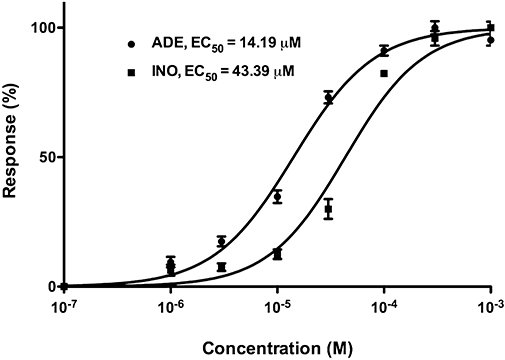
Dose-response curves for adenosine and inosine. Confluent NRK cultures were subjected to combined oxygen-glucose deprivation (COGD) for 16 h followed by a 4-h-long reoxygenation period. Adenosine (ADE) and inosine (INO) (1 µM-1 mM) were applied preceding the hypoxia induction and responses were calculated based on the viability values measured by the MTT assay. EC50 values are shown in µM. Data are shown as mean± SEM (n = 9).
The potential involvement of adenosine receptors was tested in the protective effects of inosine (Figure 4) by pretreating cells with the adenosine receptor antagonists alloxazine, CSC, CDPX and MRS 1523 prior to administration of cytoprotective concentrations (30 and 300 µM) of adenosine and inosine. CSC and MRS 1523, but not the other antagonists partially inhibited the protective effect of inosine, suggesting the involvement of A2A and A3 adenosine receptors in the cytoprotective action of inosine. The inhibition displayed by the A3 adenosine receptor antagonist was more pronounced than the effect of the A2A receptor antagonist; the latter compound only showing a slight reversal of the effect of inosine in the MTT assay, without affecting the LDH release. The effect of these antagonists on the protective effect of adenosine was similar (data not shown), with the most potent inhibition afforded by the A3 receptor antagonist, MRS 1523 (Figure 5A,B). At the concentrations tested, none of the receptor antagonist compounds affected viability of the cells under normal culture conditions (i.e. cells not subjected to hypoxia or re-oxygenation), except for MRS 1523, which, on its own, induced a significant (50 ± 2%, P < 0.05) decrease in cellular viability at the highest concentration tested (10 µM), as assessed by the MTT assay (Figure 5C,D). This response may be related to the fact that endogenous adenosine or inosine, present in the tissue culture medium – or, especially, released during COGD – may exert some tonic effect on cellular viability, which is antagonized by pharmacological inhibition of A3 adenosine receptors.
Figure 4.
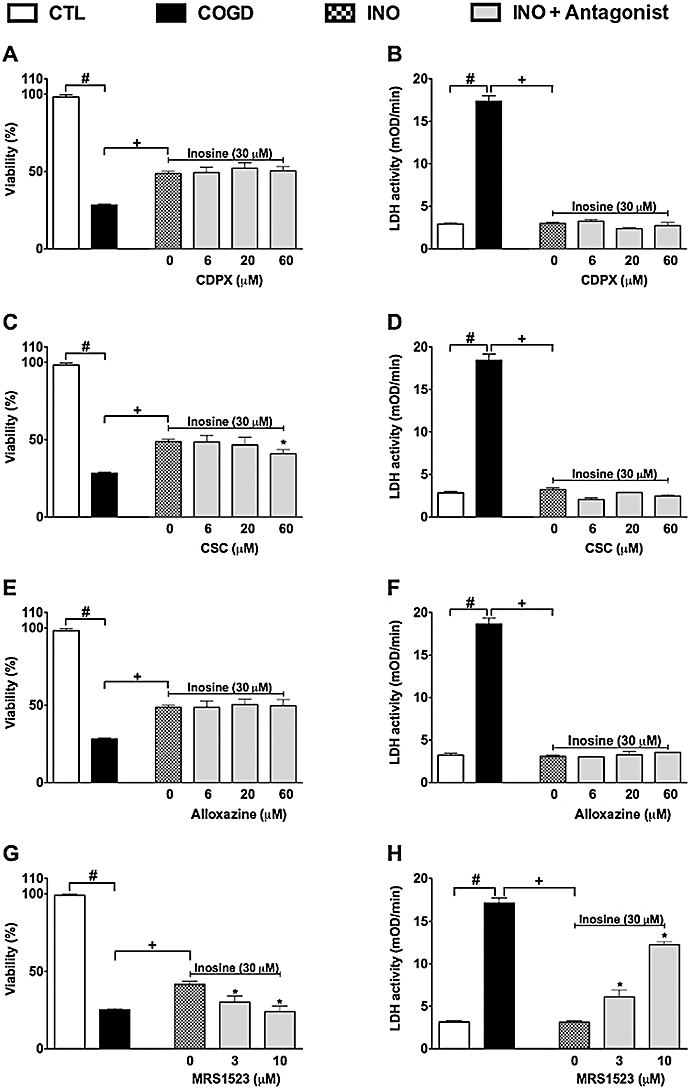
The effect of adenosine receptor antagonists on the cytoprotective effect of inosine. Confluent NRK cultures were subjected to combined oxygen-glucose deprivation (COGD, n = 96) for 16 h followed by a 4-h-long reoxygenation period. The A1 adenosine receptor antagonist, CDPX (A, B), the A2A adenosine receptor antagonist, CSC (C, D), the A2B adenosine receptor antagonist, alloxazine (E, F), and the A3 adenosine receptor antagonist, MRS 1523 (G, H) were applied in the indicated concentrations (n = 9) 30 min prior to the inosine pretreatment (INO, n = 36) and were present throughout the COGD period. Viability was measured by the MTT assay (A, C, E, G) and LDH activities (B, D, F, H) were measured in the supernatant. Controls (CTL, n = 48) were exposed to hypoxia in complete culture medium. Data are shown as mean ± SEM. #P < 0.05 compared to CTL, *P < 0.05 compared to INO, +P < 0.05 compared to COGD.
Figure 5.
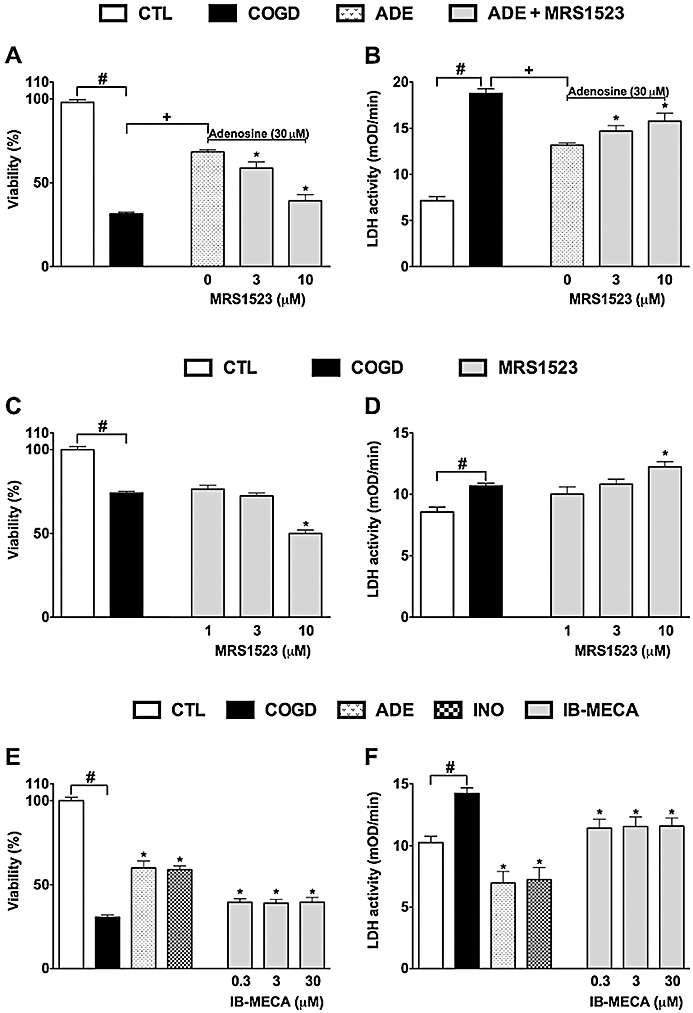
The cytoprotective effects of adenosine and inosine are partially mediated by activation of the A3 adenosine receptor. Confluent NRK cultures were subjected to glucose deprivation (C, D) or combined oxygen-glucose deprivation (COGD, n = 96) for 16 h followed by a 4-h-long reoxygenation period (A, B, E, F). Adenosine (ADE, n = 36) and inosine (INO, n = 36) were applied at 30 µM (A, B) or at 100 and 300 µM respectively (n = 9 each) (E, F). A3 adenosine receptor antagonist, MRS 1523 (A–D) and A3 adenosine receptor agonist IB-MECA (E–F) were applied in the indicated concentrations (n = 9 or 18 each concentrations). Controls (CTL, n = 48) were exposed to hypoxia in complete culture medium. Viability was measured by the MTT assay (A, C, E) and LDH activities (B, D, F) were measured in the supernatant. Data are shown as mean ± SEM. #P < 0.05 compared to CTL, *P < 0.05 compared to ADE (A, B). +P < 0.05 compared to COGD (A, B), *P < 0.05 compared to COGD (C–F).
Treatment of the cells with the A3 receptor agonist IB-MECA exerted a mild protective effect against COGD-induced injury to NRK cells, but its effects were significantly less pronounced than that of adenosine and inosine (Figure 5E,F). These findings are consistent with the hypothesis that the cytoprotective effects of adenosine and inosine during COGD are partially, but not fully mediated by A3 adenosine receptors.
The adenosine deaminase inhibitor EHNA (10 µM) markedly and almost fully reversed the protective effect of 100 and 300 µM adenosine during COGD (Figure 6A,B). On the other hand, EHNA did not influence the cytoprotective effect of inosine during COGD (Figure 6C,D). EHNA, however, slightly but significantly amplified the COGD-induced decrease in cell viability (in cells that did not receive adenosine or inosine treatment) (Figure 6). A significant liberation of adenosine and inosine from tubular cells was reported during hypoxia and reperfusion injury (Osswald et al., 1977; Vallon et al., 2006). Therefore, it is conceivable that adenosine is released from NRK cultures during COGD without exogenous adenosine pretreatment, and the cytoprotective effect of endogenous adenosine is also inhibited by EHNA. The adenosine kinase inhibitor ABT 702 (30 µM) significantly reversed the protective effect of 100 and 300 µM adenosine and inosine during COGD (Figure 7). Interestingly, ABT 702, on its own, appeared to have a mild cytoprotective effect during COGD (Figure 7).
Figure 6.
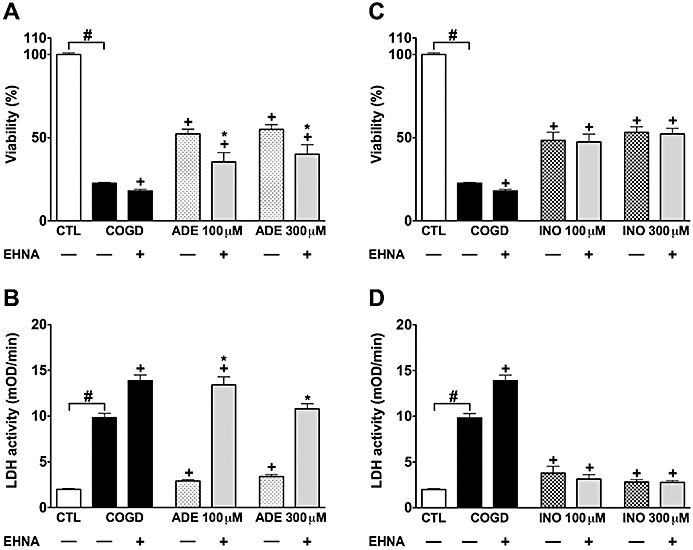
Adenosine deaminase blockade reduces the protective effect of adenosine. Confluent NRK cultures were subjected to combined oxygen-glucose deprivation (COGD, n = 48) for 16 h and viability was measured after a 4-h-long recovery by the MTT assay (A, C), and cellular injury was determined by the LDH assay (B, D). Cells were pretreated with 100 µM adenosine (ADE, n = 9) (A, B) or 300 µM inosine (INO, n = 9) (C, D) 30 min prior to hypoxia induction. The adenosine deaminase inhibitor (EHNA) was applied at 10 µM prior to adenosine/inosine (n = 9, each). Controls (CTL, n = 48) were exposed to hypoxia in complete culture medium. Data are shown as mean ± SEM. #P < 0.05 compared to CTL, *P < 0.05 compared to ADE or INO, +P < 0.05 compared to COGD.
Figure 7.
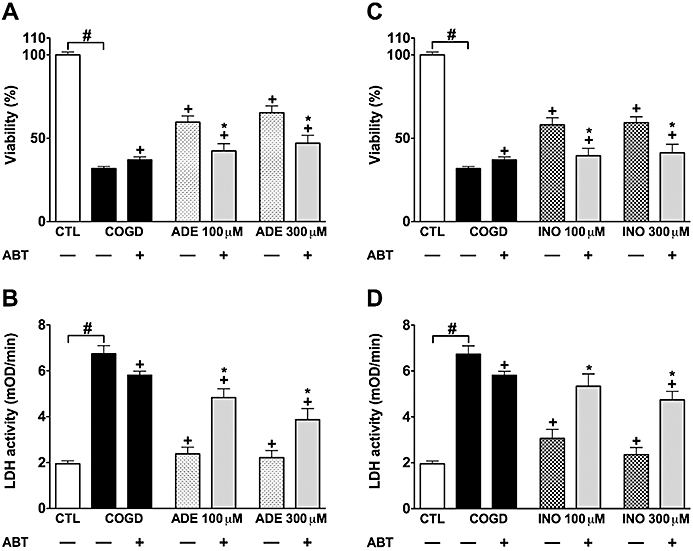
Adenosine kinase inhibition prevents the protective effects of adenosine and inosine. Confluent NRK cultures were subjected to combined oxygen-glucose deprivation (COGD, n = 48) for 16 h. Viability was measured after a 4-h-long recovery by the MTT assay (A, C), and cellular injury was determined by the LDH assay (B, D). Cells were pretreated with 100 µM adenosine (ADE, n = 9) (A, B) or 300 µM inosine (INO, n = 9) (C, D) 30 min prior to hypoxia induction. The adenosine kinase inhibitor (ABT 702, 30 µM) was applied 10 min prior to adenosine/inosine (n = 9, each) and was present throughout the COGD period. Controls (CTL, n = 48) were exposed to hypoxia in complete culture medium. Data are shown as mean ± SEM. #P < 0.05 compared to CTL, *P < 0.05 compared to ADE or INO, +P < 0.05 compared to COGD.
Characterization of the cytoprotective effects of adenosine, inosine and extracellular glucose over a wide concentration range in NRK cells, subjected to COGD
We have compared the protective effects of adenosine and glucose at wide concentration range during a 16-h-long COGD followed by 4 h of re-oxygenation. Adenosine and inosine at a micromolar (10–100 µM) concentration range resulted in a greater viability and a marked reduction in LDH activity in NRK cultures during COGD and following 0–4–8–24-h-long re-oxygenation, while glucose at the same concentration range displayed a weaker protective effect (data not shown). For instance, COGD reduced cellular viability to 27 ± 1%, and 100 µM glucose, adenosine and inosine increased it to 44 ± 1, 52 ± 1 and 51 ± 1% respectively. At 1 mM, however, glucose was as effective as adenosine or inosine in restoring cellular viability: glucose, adenosine and inosine, all at 1 mM, increased the viability to 50 ± 1, 51 ± 1 and 55 ± 1% respectively.
Effect of adenosine and inosine on cellular ATP levels in cells subjected to COGD
We have measured the effect of adenosine, inosine alone, and in combination with selected pharmacological agents (EHNA, ABT) on cellular ATP levels after 16 h of COGD. Cells pretreated with 300 µM adenosine, inosine or glucose maintained significantly higher cellular ATP levels than control cells exposed to COGD. Consistent with the viability data (see above), the adenosine kinase inhibitor ABT 702 (30 µM) and the adenosine deaminase inhibitor EHNA (10 µM) diminished the rise in cellular ATP levels in cells treated with adenosine during COGD. ABT also reduced the restorative effect of inosine and glucose during COGD (Figure 8).
Figure 8.
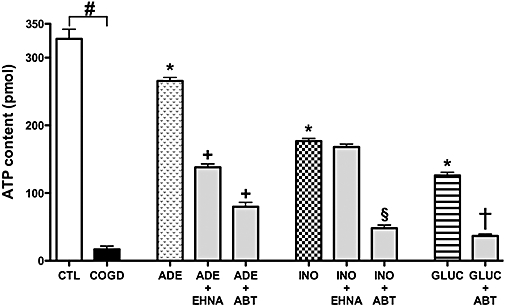
Adenosine and inosine preserve ATP content of NRK cultures during combined oxygen-glucose deprivation. Confluent NRK cultures were subjected to combined oxygen-glucose deprivation (COGD, n = 18) for 16 h. Cells were pretreated with 300 µM adenosine (ADE), inosine (INO) or glucose (GLUC) 30 min prior to hypoxia induction (n = 18, each). The adenosine kinase inhibitor ABT 702 (30 µM) or the adenosine deaminase inhibitor EHNA (10 µM) were applied prior to adenosine/inosine and glucose addition and were present throughout the COGD period. Values represent ATP content (pmol) of 105 NRK cells. Controls (CTL, n = 18) were exposed to hypoxia in complete culture medium and showed similar ATP content to cells maintained under normoxic conditions (not shown). Adenosine or inosine, applied during normoxia, failed to affect cellular ATP levels (not shown). Data are shown as mean ± SEM (n = 18). #P < 0.05 compared to CTL, *P < 0.05 compared to COGD, +P < 0.05 compared to ADE, §P < 0.05 compared to INO and †P < 0.05 compared to GLUC.
Discussion
The current results demonstrated that from a wide range of pharmacologically active compounds contained in the LOPAC library, only a handful of compounds were effective in protecting renal epithelial cells from hypoxia/glucose deprivation (COGD) and re-oxygenation induced injury. This finding is a sharp contrast to an earlier screen using the current assay, where hydrogen peroxide-induced cell injury in rat cardiac myoblasts was attenuated by a wide variety of compounds: PARP inhibitors, compounds that interfere with intracellular calcium handling, cell cycle progression and others (Gero et al., 2007). This finding indicates that even though free radicals and oxidants are an important component of hypoxic cell injury, direct exposure to oxidants cannot fully model the cell injury elicited by hypoxia and re-oxygenation. It is also likely that there are cell-type dependent differences between myoblasts and renal epithelial cells.
The cytoprotective effects of adenosine and inosine are consistent with several studies in the literature demonstrating the modulatory role of renal adenosine receptors in various models of renal ischaemia-reperfusion injury in vivo (Okusa et al., 1999, 2000, 2001; Lee and Emala, 2000, 2001; Nishiyama et al. 2001; Okusa 2002; Day et al., 2003, 2005; Jackson et al., 2006). In rats, activation of A1 and A2A adenosine receptors has been shown to attenuate renal reperfusion injury (Lee and Emala 2000, 2001; Okusa 2002) and the renoprotection provided by ischaemic preconditioning also proved to be elicited by the activation of A1 receptors. Inhibition of A3 adenosine receptors protects against ischaemia-reperfusion-induced renal failure, while its activation depresses renal function in rats (Lee and Emala 2000). Furthermore, A1 adenosine receptor knockout mice were found to have severely impaired renal function after reperfusion injury (Lee et al., 2004; Gallos et al., 2005), while the A3 adenosine receptor knockout mice were protected against renal reperfusion injury (Lee et al., 2003; Lien et al., 2003). Furthermore, there are data in the literature implicating the potential role of A2B receptors in protecting against renal ischaemia-reperfusion injury (Grenz et al., 2008). In our experimental model, the results point to the importance of the A3 receptor, as the A3 receptor agonist IB-MECA protects, while the A3 receptor antagonist MRS 1523 exacerbates the cell injury during COGD. The current results may be interesting in the context of previously published reports on in vitro renal ischaemia-reperfusion injury (Lee, 2002; Lee and Emala 2002a,b;). Lee and Emala have demonstrated the protective effect of adenosine in human kidney proximal tubule (HK-2) cells expressing all four subtypes of adenosine receptors (A1, A2A, A2B, A3) and the protective effect of adenosine was attributed to A1 and A2A adenosine receptors. Our results are in good agreement with the findings demonstrating that stimulation of the A2A receptors can exert cytoprotective effects, as 2-phenylaminoadenosine, a relatively selective A2 adenosine receptor agonist also exerted cytoprotective effects in our model system (Table 1). However, our data indicate that the cytoprotective effects of adenosine and inosine are mediated principally by A3 rather than A2A receptors, and we found no evidence for any protective effects of the A2B receptor agonist used. The differences may be attributed to the different cell types used and the mechanism that triggers the cellular injury in the current model. While using mitochondrial electron transport chain inhibitors in combination with glucose deprivation (even with a calcium ionophore) is a widely accepted model system to mimic ischaemic injury (Lee, 2002; Lee et al., 2002a,b;), we employed a ‘true’ oxygen-glucose depletion without the need of an irreversible chemical blockade of mitochondrial function, which also allowed a time-dependent recovery of the mitochondria. As far as the role of A2B receptors is concerned, reports indicate that this receptor subtype shows a selective expression profile in the renal vasculature (and not in epithelial cells) (Grenz et al., 2008). Therefore, the experimental model used in the current study was not suitable to test the potential role of these receptors in the protective effect of adenosine or inosine.
While our present studies suggested a role for cell-surface adenosine receptors in the protective effects of adenosine and inosine, the potential involvement of receptor-independent, intracellular actions was also indicated by some of the results. During ischaemic renal injury resulting in acute tubular necrosis (ATN), the tubular cells undergo an extensive period of hypoxia. This is associated with marked depletions of the oxygen, NAD+ and intracellular ATP pools, followed by a shift of the cells into energy generation via the anaerobic route. Although this mechanism is less effective than mitochondrial ATP generation, the cells are able to use it as an emergency pathway to produce ATP to support the most essential cellular processes. However, it should be noted that anaerobic metabolism assumes the presence of available metabolizable substrates. After a long ischaemic period the cells inevitably die, as they run out of substrates or the end products of the anaerobic route inhibit the degradation of the available further substrates. A shorter ischaemia, however, leaves a portion of the cells exhausted but still viable and a complete recovery may occur if reperfusion starts at this point. Our results are consistent with a hypothesis that adenosine serves as a ‘cytoprotective food’ (i.e. a source of cellular energy generation) under the current conditions and extends the tolerance of the tubular cells to ischaemia. This proposal is supported by the following observations and considerations: (i) the inhibition of the conversion of adenosine to inosine by the adenosine deaminase inhibitor EHNA completely prevented the cytoprotective effect of adenosine suggesting that adenosine does not exert its principal effects in its unchanged form; (ii) the blockade of adenosine phosphorylation by the adenosine kinase inhibitor ABT 702, which inhibits the formation of AMP (and ultimately of ATP) from adenosine completely abolished to cytoprotective effect of both adenosine and inosine and (iii) the partial restoration of extracellular glucose concentration exerted protective effects comparable to the effects of adenosine (suggesting that possibly both glucose and adenosine, ultimately, act as sources of cellular ATP generation). The observation that the presence of adenosine affords a time-dependent recovery of mitochondrial respiration (assessed, for instance, by the MTT assay) is also consistent with the fact that adenosine provides an alternative source of energy to the cells, promoting the recovery of mitochondrial function in the cells that survived the period of hypoxia (Figure 2).
In the late 90s, several reports indicated potential, receptor-independent, protective roles of purine nucleosides in vitro during hypoxia in renal epithelial, astroglial, glial and neuronal cells (Haun et al., 1996; Jurkowitz et al., 1998; Mandel et al., 1998; Litsky et al., 1999). Inosine (as well as adenosine, after conversion via the adenosine deaminase pathway to inosine) may stimulate energy generation via the nucleoside phosphorylase/ribose-phosphate/transketolase route, since inosine metabolism in the cell yields ribose 1-phosphate. Three molecules of ribose-1-phosphate molecules are isomerized into two molecules of fructose 6-phosphates and one of glyceraldehyde 3-phosphate. These intermediates enter the glycolytic pathway and produce energy (Haun et al., 1996; Jurkowitz et al., 1998; Litsky et al., 1999). As shown in Figure 9, 8 mol ATP and 5 mol NADH + H+can be produced from 3 mol adenosine during hypoxic conditions, when cells are restricted to glycolysis. From the same molar amount of (extracellular) glucose, 6 mol of ATP and 6 mol of NADH + H+are produced during glycolysis, as 6 mol of ATP is required for glucose phosphorylation, while a maximum of 9 mol of net ATP and 6 mol of NADH + H+can be generated from (intracellular) glucose-phosphate (produced from glycogen breakdown). During anaerobic conditions, the accumulation of NADH + H+occurs, with a subsequent inhibition of several enzymes (citrate synthetase, isocitrate-dehydrogenase, α-ketoglutarate dehydrogenase), thereby interfering with the Krebs cycle, which is controlled by the ratio of NADH/NAD+ and ATP/ADP. During prolonged anaerobic conditions, NADH + H+ accumulate and inhibit glycolysis and the Krebs cycle. Thus, adenosine and inosine breakdown may present an energy source to be preferred over extracellular glucose under these conditions, as they delay the accumulation of NADH + H+, thereby maintaining some vital cellular functions. In short, adenosine may exert some of its cytoprotective effects under our current experimental conditions by providing an emergency energy source, when glucose is insufficient to support cellular functions. The above hypothesis is supported both by several reports that cellular ATP levels were elevated in ischaemic or hypoxic cells treated with adenosine or inosine (Weinberg and Humes, 1986; Takeo et al., 1988; Haun et al., 1996; Jurkowitz et al., 1998; Mandel et al., 1998) as well as our present measurements demonstrating the same effect (Figure 8). Although we have not directly measured the transport of adenosine or inosine into the cells, these nucleosides can readily enter cells (see Haun et al., 1996; Jurkowitz et al., 1998) Our present finding that intracellular high energy phosphates such as ATP were elevated after inosine or adenosine treatment are also suggestive of such an uptake mechanism.
Figure 9.
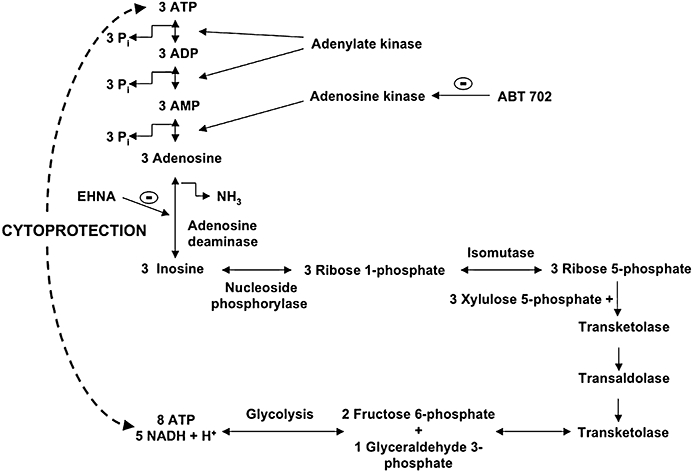
Scheme representing some of the proposed metabolic pathways for the conversion of adenosine and inosine into different substrates for the glycolytic pathway. The diagram also shows an alternative way to produce energy in the absence of glucose during hypoxic injury.
Although the metabolic fate of adenosine and inosine shares many common features (Figure 9), there is a dramatic difference in the cytoprotective effects of the two molecules, adenosine being approximately three times as potent as inosine. Does, then, the cytoprotective effect of adenosine and inosine, as demonstrated in the current study, occur via common pathways? What accounts for the greater potency of adenosine? The similar prevention of the cytoprotective effects of adenosine and inosine by MRS 1523 indicates that the extracellular effects of these compounds are mediated by some common pathways (such as the A3 adenosine receptor and its downstream intracellular pathway). The cytoprotective effect of both adenosine and inosine is completely inhibited by the adenosine kinase inhibitor ABT 702. The cytoprotective effects (as well as the replenishment of intracellular ATP levels) of adenosine (but not of inosine) was markedly inhibited by the adenosine deaminase inhibitor EHNA, suggesting that the conversion of adenosine to inosine was an essential step in the cytoprotection provided by adenosine. Nevertheless, adenosine afforded the greater cytoprotection. We propose the following hypotheses: the two processes (i) degradation of adenosine and inosine via the pentose phosphate pathway and (ii) the phosphorylation of adenosine to AMP are required in a well-balanced parallel fashion to support the generation of ATP under hypoxic conditions. The first process provides the energy, while the second one supplies the substrate to convert into ATP, a high-energy intermediate that conserves energy in a ready-to-use form. Interestingly, the combined blockade of adenosine deaminase (by EHNA) and adenosine kinase (by ABT 702) resulted in no further reduction in cell viability after COGD (as compared to either inhibitor alone; data not shown), which suggest that these enzymes take part in the same cytoprotective mechanism. Furthermore, the adenosine kinase inhibitor (ABT 702), without exogenous adenosine or inosine, provided a mild cytoprotective effect, but prevented the cytoprotection provided by exogenous adenosine or inosine, and also exogenous glucose (data not shown). While ABT 702 may exert a mild protective effect by promoting the metabolism of endogenous adenosine via the pentose phosphate pathway, if no other source of energy is available, this action results in an opposing response when energy is supplied by exogenous adenosine, inosine or glucose, as it blocks the formation of AMP and ultimately ATP from these sources. Based on the above observations, we propose that the higher cytoprotective potency of adenosine was attributable to the better balance it achieved between the breakdown to ribose phosphate and the concurring formation of AMP.
A few years ago inosine was considered as an inactive metabolite, but several recent studies have shown that it has immuno-modulatory (Hasko et al., 2004), neuroprotective (Spitsin et al., 2001), cardioprotective (Szabo et al., 2006) and overall cytoprotective effects. As discussed above, inosine can bind to adenosine receptors and initiate intracellular signalling pathways and may serve as a substrate for enzymes involved in cellular metabolism. In addition, inosine (but not adenosine) can inhibit poly(ADP-ribose) polymerase (PARP) activation and inhibit necrotic type cell death in oxidatively damaged cells by blocking a suicidal utilization of NAD+ in the cell (Virag and Szabo 2001). This latter action, however, is unlikely to contribute to the observed effects in the current experimental conditions, as potent PARP inhibitors do not exert protective effects against the COGD type cell injury in the cell system used in the present study (data not shown). Nevertheless, it is likely that both the cytoprotective effects of adenosine and inosine involve multiple, parallel and interrelated mechanisms under the current experimental conditions.
During ischaemia and inflammation, the concentration of purine metabolites increases dramatically in the extracellular space. ATP breaks down into AMP and subsequently to adenosine, which may be released from the cells and appear in the extracellular space. Inosine can be formed from adenosine, by adenosine deaminase, an enzyme, occurring both intracellularly and extracellularly. Consistent with these notions, there are several reports that demonstrate the cytoprotective effect of endogenously formed adenosine in the context of acute ischaemic injury of the kidney (Beach et al., 1991; Grenz et al., 2007a,b;). These events (endogenous formation of cytoprotective molecules) can only be partially reproduced in a single-cell biological screening assay such as the current one. Nevertheless, the fact that treatment with EHNA and 10 µM MRS 1523 worsens the viability and increases LDH release under control COGD conditions (i.e. in the absence of exogenously supplied adenosine or inosine) is consistent with the hypothesis that some amount of endogenous adenosine is formed as a result of COGD, which is then pharmacologically modulated by EHNA and MRS 1523.
When attempting to reduce a complex process such as ATN to a simple in vitro screening assay in a single cell type, one has to accept a number of limitations. The current model, where experimental compounds were applied in the pretreatment regimen (i.e. prior and during COGD), may be relevant to some clinical manifestations of ATN (for instance, pretreatment with a potential cytoprotective molecule may be feasible as a preventive approach in a subset of high-risk patients undergoing angiography to prevent contrast agent-induced ATN, or in high-risk patients undergoing a prescheduled major surgical intervention with a risk of inducing renal ischaemia). However, in other clinical conditions, a post-treatment approach (where the cytoprotective compound would be delivered when the blood flow is re-established to the kidney) would be more appropriate. Also, clearly, in vitro hypoxia and glucose deprivation does not mimic all aspects of organ ischaemia, just as re-establishing supply of oxygen and glucose to the cells does not fully mimic reperfusion of a previously ischaemic organ with blood. Protection mechanisms related to vascular receptors (e.g. potential A2B receptor mediated effects; see above), or effects on platelets, neutrophils, coagulation pathways and many other factors are not mimicked by the current experimental scenario. Additional limitations of the current assay may stem from the potentially different receptor expression profile of the currently used cell line and the renal epithelial cells in situ. Ischaemia and reperfusion has been shown to alter the expression of various adenosine receptor subtypes (see Eltzschig et al., 2005; Milano et al., 2008). As we have not measured changes in the expression of the adenosine receptors in the current assay, this additional limitation must also be considered when interpreting the current findings.
In conclusion, the current report demonstrates the cytoprotective effect of adenosine and inosine in an in vitro model of ATN and delineates some of the extracellular and intracellular modes of action of these molecules. The current results support the notion that these molecules serve as important endogenous cytoprotective agents. The findings also support the view that pharmacological therapies based around the structure and molecular action of adenosine or inosine will be of potential use for the experimental therapy of acute ischaemic kidney diseases.
Acknowledgments
This work was primarily supported by a grant from the Oszkar Asboth project grant of the National Office for Research and Technology (Budapest, Hungary). Additional funding was received from the Hungarian Research Fund (OTKA). C.S. is also supported by the US National Institutes of Health: R01 GM66189.
Glossary
Abbreviations:
- Alamar Blue
Resazurin sodium salt; 7-hydroxy-3H-phenoxazin-3-one-10-oxide sodium salt
- ABT 702
4-amino-5-(3-bromophenyl)-7-(6-morpholino-pyridin-3-yl)pyrido (2,3-d)pyrimidine, 2HCl
- ARF
acute renal failure
- ATN
acute tubular necrosis
- CDPX
8-cyclopentyl-1,3-dipropylxanthine
- COGD
combined oxygen-glucose deprivation
- CSC
8-(3-chlorostyryl) caffeine
- DMEM
Dulbecco's modified Eagle's medium
- DMSO
dimethyl sulphoxide
- EHNA
erythro-9-(2-hydroxy-3-nonyl) adenine hydrochloride
- IB-MECA
N6-(3-iodobenzyl)-adenosine-5′-N-methyluronamide
- I/R
ischaemia-reperfusion
- LDH
lactate dehydrogenase
- LOPAC 1280
Library of 1280 pharmacologically active compounds
- MTT
3-(4,5-dimethylthiazol-2-yl)-2,5-diphenyltetrazolium bromide
- NRK
normal rat kidney epithelial cells
- PARP
Poly(ADP-ribose) polymerase
- PBS
phosphate buffered saline
- PPAR
peroxisome proliferator-activated receptor
References
- Advani A, Gilbert RE, Thai K, Gow RM, Langham RG, Cox AJ, et al. Expression, localization, and function of the thioredoxin system in diabetic nephropathy. J Am Soc Nephrol. 2009;20:730–741. doi: 10.1681/ASN.2008020142. [DOI] [PMC free article] [PubMed] [Google Scholar]
- Alexander SPH, Mathie A, Peters JA. Guide to receptors and channels (GRAC) Br J Pharmacol. (3rd edn.) 2008;153:S1–S209. doi: 10.1038/sj.bjp.0707746. [DOI] [PMC free article] [PubMed] [Google Scholar]
- Beach RE, Watts BA, 3rd, Good DW, Benedict CR, DuBose TD., Jr Effects of graded oxygen tension on adenosine release by renal medullary and thick ascending limb suspensions. Kidney Int. 1991;39:836–842. doi: 10.1038/ki.1991.105. [DOI] [PubMed] [Google Scholar]
- Bruns RF, Fergus JH, Badger EW, Bristol JA, Santay LA, Hartman JD, et al. Binding of the A1-selective adenosine antagonist 8-cyclopentyl-1,3-dipropylxanthine to rat brain membranes. Naunyn Schmiedebergs Arch Pharmacol. 1987;335:59–63. doi: 10.1007/BF00165037. [DOI] [PubMed] [Google Scholar]
- Butcher EC. Can cell systems biology rescue drug discovery? Nat Rev Drug Dis. 2005;4:461–467. doi: 10.1038/nrd1754. [DOI] [PubMed] [Google Scholar]
- Chatterjee PK. Novel pharmacological approaches to the treatment of renal ischemia-reperfusion injury: a comprehensive review. Naunyn Schmiedebergs Arch Pharmacol. 2007;376:1–43. doi: 10.1007/s00210-007-0183-5. [DOI] [PubMed] [Google Scholar]
- Chatterjee PK, Thiemermann C. Emerging drugs for renal failure. Expert Opin Emerg Drugs. 2003;8:389–435. doi: 10.1517/14728214.8.2.389. [DOI] [PubMed] [Google Scholar]
- Chen S, Zhang Q, Wu X, Schultz PG, Ding S. Dedifferentiation of lineage-committed cells by a small molecule. J Am Chem Soc. 2004;126:410–411. doi: 10.1021/ja037390k. [DOI] [PubMed] [Google Scholar]
- Day YJ, Huang L, McDuffie MJ, Rosin DL, Ye H, Chen JF, et al. Renal protection from ischemia mediated by A2A adenosine receptors on bone marrow-derived cells. J Clin Invest. 2003;112:883–891. doi: 10.1172/JCI15483. [DOI] [PMC free article] [PubMed] [Google Scholar]
- Day YJ, Huang L, Ye H, Linden J, Okusa MD. Renal ischemia-reperfusion injury and adenosine 2A receptor-mediated tissue protection: role of macrophages. Am J Physiol Renal Physiol. 2005;288:F722–F731. doi: 10.1152/ajprenal.00378.2004. [DOI] [PubMed] [Google Scholar]
- Degterev A, Huang Z, Boyce M, Li Y, Jagtap P, Mizushima N, et al. Chemical inhibitor of nonapoptotic cell death with therapeutic potential for ischemic brain injury. Nat Chem Biol. 2005;1:112–119. doi: 10.1038/nchembio711. [DOI] [PubMed] [Google Scholar]
- Di Sole F, Cerull R, Babich V, Casavola V, Helmle-Roth C, Burckhardt G. Short- and long-term A3 adenosine receptor activation inhibits the Na+/H+ exchanger NHE3 activity and expression in opossum kidney cells. J Cell Physiol. 2008;216:221–233. doi: 10.1002/jcp.21399. [DOI] [PubMed] [Google Scholar]
- Dishart MK, Kellum JA. An evaluation of pharmacological strategies for the prevention and treatment of acute renal failure. Drugs. 2000;59:79–91. doi: 10.2165/00003495-200059010-00005. [DOI] [PubMed] [Google Scholar]
- Edelstein CL, Ling H, Wangsiripaisan A, Schrier RW. Emerging therapies for acute renal failure. Am J Kidney Dis. 1997;30:S89–S95. doi: 10.1016/s0272-6386(97)90548-5. [DOI] [PubMed] [Google Scholar]
- Eltzschig HK, Abdulla P, Hoffman E, Hamilton KE, Daniels D, Schonfeld C, et al. HIF-1-dependent repression of equilibrative nucleoside transporter (ENT) in hypoxia. J Exp Med. 2005;202:1493–1505. doi: 10.1084/jem.20050177. [DOI] [PMC free article] [PubMed] [Google Scholar]
- Gallos G, Ruyle TD, Emala CW, Lee HT. A1 adenosine receptor knockout mice exhibit increased mortality, renal dysfunction, and hepatic injury in murine septic peritonitis. Am J Physiol Renal Physiol. 2005;289:F369–F376. doi: 10.1152/ajprenal.00470.2004. [DOI] [PubMed] [Google Scholar]
- Gero D, Modis K, Nagy N, Szoleczky P, Toth ZD, Dorman G, et al. Oxidant-induced cardiomyocyte injury: Identification of the cytoprotective effect of a dopamine 1 receptor agonist using a cell-based high-throughput assay. Int J Mol Med. 2007;20:749–761. [PubMed] [Google Scholar]
- Grenz A, Zhang H, Eckle T, Mittelbronn M, Wehrmann M, Kohle C, et al. Protective role of ecto-5′-nucleotidase (CD73) in renal ischemia. J Am Soc Nephrol. 2007a;18:833–845. doi: 10.1681/ASN.2006101141. [DOI] [PubMed] [Google Scholar]
- Grenz A, Zhang H, Hermes M, Eckle T, Klingel K, Huang DY, et al. Contribution of E-NTPDase1 (CD39) to renal protection from ischemia-reperfusion injury. FASEB J. 2007b;21:2863–2873. doi: 10.1096/fj.06-7947com. [DOI] [PubMed] [Google Scholar]
- Grenz A, Osswald H, Eckle T, Yang D, Zhang H, Tran ZV, et al. The Reno-Vascular A2B Adenosine Receptor Protects the Kidney from Ischemia. PLoS Medicine. 2008;5:e137. doi: 10.1371/journal.pmed.0050137. [DOI] [PMC free article] [PubMed] [Google Scholar]
- Hasko G, Sitkovsky MV, Szabo C. Immunomodulatory and neuroprotective effects of inosine. Trends Pharmacol Sci. 2004;25:152–157. doi: 10.1016/j.tips.2004.01.006. [DOI] [PubMed] [Google Scholar]
- Haun SE, Segeleon JE, Trapp VL, Clotz MA, Horrocks LA. Inosine mediates the protective effect of adenosine in rat astrocyte cultures subjected to combined glucose-oxygen deprivation. J Neurochem. 1996;67:2051–2059. doi: 10.1046/j.1471-4159.1996.67052051.x. [DOI] [PubMed] [Google Scholar]
- Jackson EK, Zacharia LC, Zhang M, Gillespie DG, Zhu C, Dubey RK. cAMP-adenosine pathway in the proximal tubule. J Pharmacol Exp Ther. 2006;317:1219–1229. doi: 10.1124/jpet.106.101360. [DOI] [PubMed] [Google Scholar]
- Jagtap P, Soriano FG, Virag L, Liaudet L, Mabley J, Szabo E, et al. Novel phenanthridinone inhibitors of poly (adenosine 5′-diphosphate-ribose) synthetase: potent cytoprotective and antishock agents. Crit Care Med. 2002;30:1071–1082. doi: 10.1097/00003246-200205000-00019. [DOI] [PubMed] [Google Scholar]
- Jarvis MF, Yu H, Kohlhaas K, Alexander K, Lee CH, Jiang M, et al. ABT-702 (4-amino-5-(3-bromophenyl)-7-(6-morpholinopyridin-3-yl)pyrido[2, 3-d]pyrimidine), a novel orally effective adenosine kinase inhibitor with analgesic and anti-inflammatory properties: I. In vitro characterization and acute antinociceptive effects in the mouse. J Pharmacol Exp Ther. 2000;295:1156–1164. [PubMed] [Google Scholar]
- Joo JD, Kim KM, D'Agati VD, Lee HT. Ischemic preconditioning provides both acute and delayed protection against renal ischemia and reperfusion injury in mice. J Am Soc Nephrol. 2006;17:3115–3123. doi: 10.1681/ASN.2006050424. [DOI] [PubMed] [Google Scholar]
- Joo JD, Kim M, Horst P, Kim J, D'Agati VD, Emala CW, Sr, et al. Acute and delayed renal protection against renal ischemia and reperfusion injury with A1 adenosine receptors. Am J Physiol Renal Physiol. 2007;293:F1847–F1857. doi: 10.1152/ajprenal.00336.2007. [DOI] [PubMed] [Google Scholar]
- Jurkowitz MS, Litsky ML, Browning MJ, Hohl CM. Adenosine, inosine, and guanosine protect glial cells during glucose deprivation and mitochondrial inhibition: correlation between protection and ATP preservation. J Neurochem. 1998;71:535–548. doi: 10.1046/j.1471-4159.1998.71020535.x. [DOI] [PubMed] [Google Scholar]
- Kowaluk EA, Mikusa J, Wismer CT, Zhu CZ, Schweitzer E, Lynch JJ, et al. ABT-702 (4-amino-5-(3-bromophenyl)-7-(6-morpholino-pyridin- 3-yl)pyrido[2,3-d]pyrimidine), a novel orally effective adenosine kinase inhibitor with analgesic and anti-inflammatory properties. II. In vivo characterization in the rat. J Pharmacol Exp Ther. 2000;295:1165–1174. [PubMed] [Google Scholar]
- Lee HT. Preconditioning and Adenosine Protect Human proximal Tubule Cells in an In Vitro Model of Ischemic Injury. J Am Soc Nephrol. 2002;13:2753–2761. doi: 10.1097/01.asn.0000032421.79225.6e. [DOI] [PubMed] [Google Scholar]
- Lee HT, Emala CW. Protective effects of renal ischemic preconditioning and adenosine pretreatment: Role of A(1) and A(3) receptors. AM J Physiol Renal Physiol. 2000;278:F380–F387. doi: 10.1152/ajprenal.2000.278.3.F380. [DOI] [PubMed] [Google Scholar]
- Lee HT, Emala CW. Systemic adenosine given after ischemia protects renal function via A(2a) adenosine receptor activation. Am J Kidney Dis. 2001;38:610–618. doi: 10.1053/ajkd.2001.26888. [DOI] [PubMed] [Google Scholar]
- Lee HT, Emala CW. Adenosine attenuates oxidant injury in human proximal tubular cells via A(1) and A(2a) adenosine receptors. Am J Physiol Renal Physiol. 2002a;282:F844–F852. doi: 10.1152/ajprenal.00195.2001. [DOI] [PubMed] [Google Scholar]
- Lee HT, Emala CW. Characterization of adenosine receptors in human kidney proximal tubule (HK-2) cells. Exp Nephrol. 2002b;10:383–392. doi: 10.1159/000065306. [DOI] [PubMed] [Google Scholar]
- Lee HT, Ota-Setlik A, Xu H, D'Agati VD, Jacobson MA, Emala CW. A3 adenosine receptor knockout mice are protected against ischemia- and myoglobinuria-induced renal failure. Am J Physiol Renal Physiol. 2003;284:F267–F273. doi: 10.1152/ajprenal.00271.2002. [DOI] [PubMed] [Google Scholar]
- Lee HT, Xu H, Nasr SH, Schnermann J, Emala CW. A1 adenosine receptor knockout mice exhibit increased renal injury following ischemia and reperfusion. Am J Physiol Renal Physiol. 2004;286:F298–F306. doi: 10.1152/ajprenal.00185.2003. [DOI] [PubMed] [Google Scholar]
- Li FZ, Kimura S, Nishiyama A, Rahman M, Zhang GX, Abe Y. Ischemic preconditioning protects post-ischemic renal function in anesthetized dogs: role of adenosine and adenine nucleotides. Acta Pharmacol Sin. 2005;26:851–859. doi: 10.1111/j.1745-7254.2005.00109.x. [DOI] [PubMed] [Google Scholar]
- Lien YH, Lai LW, Silva AL. Pathogenesis of renal ischemia/reperfusion injury: lessons from knockout mice. Life Sci. 2003;74:543–552. doi: 10.1016/j.lfs.2003.08.001. [DOI] [PubMed] [Google Scholar]
- Litsky ML, Hohl CM, Lucas JH, Jurkowitz MS. Inosine and guanosine preserve neuronal and glial cell viability in mouse spinal cord cultures during chemical hypoxia. Brain Res. 1999;821:426–432. doi: 10.1016/s0006-8993(99)01086-0. [DOI] [PubMed] [Google Scholar]
- Mandel JL, Takano T, Soltoff SP, Murdaugh S. Mechanisms whereby exogenous adenine nucleotides improve rabbit renal proximal function during and after anoxia. J Clin Invest. 1998;81:1255–1264. doi: 10.1172/JCI113443. [DOI] [PMC free article] [PubMed] [Google Scholar]
- Milano PM, Douillet CD, Riesenman PJ, Robinson WP, 3rd, Beidler SK, Zarzaur BL, et al. Intestinal ischemia-reperfusion injury alters purinergic receptor expression in clinically relevant extraintestinal organs. J Surg Res. 2008;145:272–278. doi: 10.1016/j.jss.2007.03.028. [DOI] [PMC free article] [PubMed] [Google Scholar]
- Nishiyama A, He KS, Miura H, Rahman K, Fujisawa M, Fukui Y, et al. Renal interstitial adenosine metabolism during ischemia in dogs. Am J Physiol Renal Physiol. 2001;280:F231–F238. doi: 10.1152/ajprenal.2001.280.2.F231. [DOI] [PubMed] [Google Scholar]
- Okusa MD. A(2A) adenosine receptor: a novel therapeutic target in renal disease. Am J Physiol Renal Physiol. 2002;282:F10–F18. doi: 10.1152/ajprenal.2002.282.1.F10. [DOI] [PubMed] [Google Scholar]
- Okusa MD, Linden J, Macdonald T, Huang L. Selective A2A adenosine receptor activation reduces ischemia-reperfusion injury in rat kidney. Am J Physiol. 1999;277:F404–F412. doi: 10.1152/ajprenal.1999.277.3.F404. [DOI] [PubMed] [Google Scholar]
- Okusa MD, Linden J, Huang L, Rieger JM, Macdonald TL, Huynh LP. A(2A) adenosine receptor-mediated inhibition of renal injury and neutrophil adhesion. Am J Physiol Renal Physiol. 2000;279:F809–F818. doi: 10.1152/ajprenal.2000.279.5.F809. [DOI] [PubMed] [Google Scholar]
- Okusa MD, Linden J, Huang L, Rosin DL, Smith DF, Sullivan G. Enhanced protection from renal ischemia-reperfusion injury with A(2A)-adenosine receptor activation and PDE 4 inhibition. Kidney Int. 2001;59:2114–2125. doi: 10.1046/j.1523-1755.2001.00726.x. [DOI] [PubMed] [Google Scholar]
- Osswald H, Schmitz HJ, Kemper R. Tissue content of adenosine, inosine and hypoxanthine in the rat kidney after ischemia and postischemic recirculation. Pflugers Arch. 1977;371:45–49. doi: 10.1007/BF00580771. [DOI] [PubMed] [Google Scholar]
- Rose'Meyer RB, Harrison GJ, Headrick JP. Enhanced adenosine A(2B) mediated coronary response in reserpinised rat heart. Naunyn Schmiedebergs Arch Pharmacol. 2003;367:266–273. doi: 10.1007/s00210-002-0678-z. [DOI] [PubMed] [Google Scholar]
- Rosen S, Stillman IE. Acute tubular necrosis is a syndrome of physiologic and pathologic dissociation. J Am Soc Nephrol. 2008;19:871–875. doi: 10.1681/ASN.2007080913. [DOI] [PubMed] [Google Scholar]
- Sams-Dodd F. Target-based drug discovery: is something wrong? Drug Discov Today. 2005;10:139–147. doi: 10.1016/S1359-6446(04)03316-1. [DOI] [PubMed] [Google Scholar]
- Spedding M, Jay T, Costa e Silva J, Perret L. A pathophysiological paradigm for the therapy of psychiatric disease. Nat Rev Drug Discov. 2005;4:467–476. doi: 10.1038/nrd1753. [DOI] [PubMed] [Google Scholar]
- Spitsin S, Hooper DC, Leist T, Streletz LJ, Mikheeva T, Koprowskil H. Inactivation of peroxynitrite in multiple sclerosis patients after oral administration of inosine may suggest possible approaches to therapy of the disease. Multiple Sclerosis. 2001;7:313–319. doi: 10.1177/135245850100700507. [DOI] [PubMed] [Google Scholar]
- Sugino H, Shimada H, Tsuchimoto K. Role of adenosine in renal protection induced by a brief episode of ischemic preconditioning in rats. Jpn J Pharmacol. 2001;87:134–142. doi: 10.1254/jjp.87.134. [DOI] [PubMed] [Google Scholar]
- Szabo C. The pathophysiological role of peroxynitrite in shock, inflammation, and ischemia-reperfusion injury. Shock. 1996;6:79–88. doi: 10.1097/00024382-199608000-00001. [DOI] [PubMed] [Google Scholar]
- Szabo G, Stumpf N, Radovits T, Sonnenberg K, Gero D, Hagl S, et al. Effects of inosine on reperfusion injury after heart transplantation. Eur J Cardiothorac Surg. 2006;30:96–102. doi: 10.1016/j.ejcts.2006.04.003. [DOI] [PubMed] [Google Scholar]
- Takeo S, Tanonaka K, Miyake K, Imago M. Adenine nucleotide metabolites are beneficial for recovery of cardiac contractile force after hypoxia. J Mol Cell Cardiol. 1988;20:187–199. doi: 10.1016/s0022-2828(88)80052-x. [DOI] [PubMed] [Google Scholar]
- Toth-Zsamboki E, Horvath E, Vargova K, Pankotai E, Murthy K, Zsengeller Z, et al. Activation of poly (ADP-ribose) polymerase by myocardial ischemia and coronary reperfusion in human circulating leukocytes. Mol Med. 2006;12:221–228. doi: 10.2119/2006-00055.Toth-Zsamboki. [DOI] [PMC free article] [PubMed] [Google Scholar]
- Vallon V, Muhlbauer B, Osswald H. Adenosine and kidney function. Physiol Rev. 2006;86:901–940. doi: 10.1152/physrev.00031.2005. [DOI] [PubMed] [Google Scholar]
- Venkataraman R, Kellum JA. Novel approaches to the treatment of acute renal failure. Expert Opin Investig Drugs. 2000;9:2579–2592. doi: 10.1517/13543784.9.11.2579. [DOI] [PubMed] [Google Scholar]
- Venkataraman R, Kellum JA. Novel approaches to the treatment of acute renal failure. Expert Opin Investig Drugs. 2003;12:1353–1366. doi: 10.1517/13543784.12.8.1353. [DOI] [PubMed] [Google Scholar]
- Virag L, Szabo C. Purines inhibit poly (ADP-ribose) polymerase activation and modulate oxidant-induced cell death. FASEB J. 2001;15:99–107. doi: 10.1096/fj.00-0299com. [DOI] [PubMed] [Google Scholar]
- Weinberg JM, Humes HD. Increases of cell ATP produced by exogenous adenine nucleotides in isolated rabbit kidney tubules. Am J Physiol. 1986;250:F720–33. doi: 10.1152/ajprenal.1986.250.4.F720. [DOI] [PubMed] [Google Scholar]
- Xu Y, Shi Y, Ding S. A chemical approach to stem-cell biology and regenerative medicine. Nature. 2008;453:338–344. doi: 10.1038/nature07042. [DOI] [PubMed] [Google Scholar]