

Abstract
Dynamic instability, in which abrupt transitions occur between growing and shrinking states, is an intrinsic property of microtubules that is regulated by both mechanics and specialized proteins. We discuss a model of dynamic instability based on the popular idea that growth is maintained by a cap at the tip of the fiber. The loss of this cap is thought to trigger the transition from growth to shrinkage, called a catastrophe. The model includes longitudinal interactions between the terminal tubulins of each protofilament and “gating rescues” between neighboring protofilaments. These interactions allow individual protofilaments to transiently shorten during a phase of overall microtubule growth. The model reproduces the reported dependency of the catastrophe rate on tubulin concentration, the time between tubulin dilution and catastrophe, and the induction of microtubule catastrophes by walking depolymerases. The model also reproduces the comet tail distribution that is characteristic of proteins that bind to the tips of growing microtubules.
Keywords: cell biology, cytoskeleton, kinesin, modeling
Microtubules are microscopic tubes composed of an ordered lattice of α-β-tubulin dimers. The uniform orientation of these dimers confers a polarity on microtubules that enables directed intracellular transport. Microtubules are also the main component of the mitotic spindle, and they are therefore essential for cell division. Microtubules self-assemble and exhibit an unusual behavior termed dynamic instability (1). Dynamically unstable microtubules undergo alternating periods of growth and shrinkage, with rapid transitions between these states. The switch from growth to shrinkage is called a catastrophe, and the reverse is called a rescue. In the cell, dynamic instability is essential for allowing the cytoskeleton to organize in response to cellular cues (2).
Dynamic instability of the microtubule plus-end has been described as a two-state system (growth and shrinkage) with stochastic transitions between the two states (3, 4). The simplest version of this model assumes constant switching probabilities and can be solved analytically (5). More complicated models that include additional dynamic states have been proposed after detailed observations of microtubule dynamics in cell extracts (6).
Dynamic instability requires an increase in the chemical potential of tubulins after assembly. This energy is provided by hydrolysis of a GTP bound to tubulin. Specifically, tubulin loaded with GTP is added at the tip of the microtubule (1), and the nucleotide is later hydrolyzed to GDP within the fiber.
Several authors have attempted to explain dynamic instability as an interplay between the addition of GTP-tubulin and hydrolysis of GTP in the fiber lattice (1). It is commonly assumed that GTP tubulins situated at the microtubule tip form a cap that stabilizes the growing state. When the cap is lost or broken by hydrolysis, a catastrophe follows. Numerous models based on this idea have been proposed, which are either discrete (7, 8) or continuous (9), with more detailed descriptions also incorporating the mechanical stability of the lattice (10, 11).
The different modeling approaches have distinct strengths and weaknesses. The phenomenological model is simple and successfully reproduces dynamic instability, but provides no insight into the underlying mechanisms that give rise to it. Therefore, it cannot predict how the rates of dynamic transitions are influenced by external regulatory factors. The detailed mechanical approaches often lead to assumptions that cannot be measured experimentally, such as interactions between protofilaments (12). Finally, the continuous approach may not be appropriate if the number of GTP subunits present in the cap is small, as has been suggested by dilution experiments (13).
Future studies on microtubule organization would benefit greatly from a simple, yet predictive, description of dynamic instability, because changes in dynamics could then be linked directly to the regulatory mechanisms of microtubule-associated proteins (MAPs). Even in comparatively simple cells, such as fission yeast, numerous mechanisms are known to influence microtubule dynamic instability. The most fundamental is the limited abundance of tubulin; a growing microtubule depletes the concentration of free tubulin, leading to negative feedback between polymer mass and microtubule growth (14). A second important effect is the encounter of microtubule tips with the physical boundaries of the cell (15). Besides these two basic processes, which arise from the intrinsic properties of tubulin, dynamic instability is also regulated by numerous MAPs. Ideally, a model would be capable of providing a mechanistic link between these processes and microtubule dynamics.
Fortunately, substantial quantitative data characterizing the basic regulatory mechanisms have been obtained from in vitro experiments. It has been shown, for instance, that the growth speed and catastrophe time depend linearly on the concentration of free tubulin (16). Similar experiments addressed the effects of force on the frequency of catastrophes. The results suggested that force increases the catastrophe rate indirectly by lowering the rate at which GTP-tubulin is incorporated into the microtubule tip. In other words, force has a similar effect to reducing the free tubulin concentration (16). The mechanisms by which MAPs alter the dynamic properties of microtubules have not been determined in most cases (17). However, it has been proposed that motors from the depolymerizing kinesin-8 family induce catastrophes in a microtubule length-dependent manner by walking processively to the plus end and removing the terminal tubulin subunit (18, 19). These in vitro data are supported by live-cell imaging experiments in Schizosaccharomyces pombe that indicate that kinesin-8 motors induce catastrophe with a rate that depends on microtubule length (20).
In this study we construct a model for microtubule dynamic instability that quantitatively reproduces the continuous data from these experiments. We first describe and analyze a 1D model of dynamic instability, which correctly reproduces the classical experiments on microtubule growth (13, 16). The simplicity and analytical tractability of this model suggest a specific mechanism for transitions between growth and shrinkage. The model most closely matching the experimental data is extended to multiple protofilaments, allowing it to exhibit shortening excursions during periods of overall growth (22, 30). The dispersion of protofilament lengths in this model is consistent with the distribution of EB1 family protein decorating tips of growing microtubules (23). Finally, the effect of a kinesin-8 depolymerizing motor is studied and compared with live-cell imaging experiments (20).
1D Model
The first model considers a simple 1D lattice composed of units that exist in one of two states. For clarity, we refer here to the association of the units with GDP or GTP, although we later discuss that the two states could be of a different nature. Shrinkage and rescue are not considered. The model predicts the time of the catastrophe for a microtubule that is initially growing. The addition of a GTP unit at the tip occurs with first-order kinetics at rate g, with irreversible hydrolysis occurring at rate h for any GTP unit (Fig. 1).
Fig. 1.

The dynamics of the protective cap are determined by the addition of GTP-loaded units (T) at the tip (Top) and hydrolysis of GTP to GDP (D). Hydrolysis occurs spontaneously within the fiber for each T-unit independently of its surroundings (Middle). Addition and spontaneous hydrolysis occur stochastically with rates g and h, respectively. A protofilament undergoes catastrophe as soon as the N-terminal units are in GDP configuration (Bottom). Units outside of the region defined by the coupling parameter N are not considered.
Finally, an important property of the model is the definition of the pattern leading to catastrophe. Here, a catastrophe occurs when all N terminal units are in the GDP state (Fig. 1). This introduces the third and final parameter of the model: an integer N, which we refer to as the coupling parameter. This parameter reflects the number of distinct changes that must occur for a catastrophe to be initiated. In Results and Discussion we describe in greater detail the experimental data used to test this model.
Basic Regulation of Catastrophe
The first body of experiments is concerned with the influence of free tubulin concentration or force on microtubule catastrophes. This effect is present in cells, where microtubules are confined by the cell cortex and tubulin concentration is constant over the lifetime of a typical microtubule. This situation is achieved in vitro by nucleating microtubules from seeds (24) and either modulating the tubulin concentration or applying compressive forces on the microtubule tip. In both cases, the catastrophe times are related linearly to the average growth speeds (13, 16) (Fig. 2A).
Fig. 2.

Experimental measurements (A and B) and results of the 1D model for several values of N (C and D). In A and C, the average catastrophe time is shown for different microtubule speeds under conditions of constant growth. B and D correspond to a dilution experiment, where assembly stops because monomers suddenly become unavailable. This occurs either because the monomers have been removed by dilution or the microtubule tip is stalled by pushing it against a barrier. (A) Experimental data measured by application of a force (circles) or variation of tubulin concentration (squares), and linear fit (dashed line) from ref. 16. (B) Histogram of catastrophe time obtained after the growth is halted by force (16). (Inset) Average catastrophe time as a function of growth speeds v0 before stalling (16). (C) Catastrophe time calculated by averaging 1,000 simulations (points) and derived analytically (lines). h = 0.002, 0.058, and 0.16 s−1 for N = 1, 2, and 3 respectively. Error bars are omitted for clarity. (D) Normalized catastrophe time distributions for v0 = 2.4 μm/min obtained from 1,000 simulations and analytical fit (lines, α = 1, 1.32, and 2.3 for N = 1, 2 and, 3 respectively; see Materials and Methods). (Insets) The dependence of average catastrophe time on the growth speed before dilution.
A second body of information is given by dilution experiments. Although this situation does not occur commonly in vivo, these experiments are useful for elucidating the mechanisms that lead to dynamic instability. In dilution experiments, microtubules are first grown at a high tubulin concentration, with a correspondingly high assembly rate vgrowth. The concentration of tubulin is then reduced rapidly, which leads to induction of catastrophes by preventing further growth of the microtubule. The time elapsed between dilution and catastrophe (catastrophe time) is recorded (Fig. 2B). These experiments have shown that the mean catastrophe time is independent of the growth speed before dilution (16, 25), and the stabilizing cap at the tip of growing microtubules is short, containing fewer than ≈40 GTP units (25, 26).
Results and Discussion
The 1D model was first tested for its ability to reproduce the frequency of catastrophe for different microtubule growth speeds. The model has three parameters: the growth rate g, the hydrolysis rate h, and the coupling parameter N. However, g is linked directly to the average growth speed vgrowth = gδ, where δ = 8 nm is the length of one tubulin unit. The rate of hydrolysis h was assumed constant under different microtubule growth rates and was estimated for each model independently. It was determined by fitting the catastrophe time of each model to that observed for microtubules growing at a speed of 2.4 μm/s, thus constraining all three curves in Fig. 2D to match the experimental data for this speed.
The results for N ∈ {1, 2, 3} are shown on Fig. 2 C and D and indicate that the correct (linear) functional dependence is only obtained for a coupling parameter N = 2. Models with a coupling parameter N other than 2 did not produce a linear dependence (Fig. 2C). The stochastic simulations were verified further by calculating an analytical expression for the mean catastrophe time by treating the cap as a terminating Markov chain (see Materials and Methods). The relationship is approximately linear for N = 2 over the range of measured growth rates, where h ≪ g.
Dilution experiments were simulated by applying a stepwise reduction in the growth speed from vgrowth to zero, after the cap was allowed to reach equilibrium (see Materials and Methods). All three models successfully reproduced the independence of the mean catastrophe rate after dilution on the growth speed before dilution (Fig. 2D Inset). However, the model with a coupling parameter of N = 1 provided a poor fit to the observed distribution of catastrophe times, and although N = 3 reproduced the correct functional dependence, the closest fit was again obtained for N = 2. In summary, the 1D model matched the variations of catastrophe rates with tubulin concentration only for N = 2. Because h is also constrained by the fitting procedure, all parameters are determined.
Composite Microtubule Model.
Although a 1D model may be appropriate for describing the dynamics of actin-related fibers (27), microtubules generally contain 13 protofilaments; therefore, we investigated whether the 1D model could be extended to describe such a structure. Because it has been suggested that the longitudinal bonds within protofilaments are strong compared with the lateral interactions (12), we constructed a simple composite model consisting of 13 laterally coupled 1D models (Fig. 3A). For simplicity, the dynamics of each protofilament were modeled with identical values of g, h, and N to the 1D model described in the previous section, and tubulin units were added to each protofilament independently during growth. During shrinkage a protofilament can be rescued by an interaction with a GTP tubulin subunit in a neighboring protofilament, a process that we refer to as “gating rescue” (Fig. 3 B and C). A catastrophe of the microtubule occurs if any one of the 13 protofilaments loses its cap and is not rescued by neighboring protofilaments.
Fig. 3.

Schematic representation of composite model and gating rescue interactions. (A) Each protofilament is in contact with two neighbors. (B) GTP units rescue neighboring shrinking protofilaments (black bar). Thus, the short-lived shrinkage event will not affect the overall microtubule state. (C) The shortest protofilament cannot be rescued by this mechanisms and consequently will trigger a microtubule catastrophe.
The composite model reproduced the dilution and steady-state experiments (Fig. 4) and exhibits qualitatively identical behavior to the 1D model, albeit with a shorter average catastrophe time for the same h. A close quantitative fit to the experimental data can be recovered by decreasing the rate h by approximately a factor of 2. We also note that the composite model forces neighboring protofilaments to have similar length, thus leading to coherent extensions that are consistent with sheet structures that are observed in electron microscopy reconstructions of dynamic microtubules (29).
Fig. 4.

Results of the composite microtubule model and experimental evidence (see also Fig. S1). (A and B) Catastrophes are calculated as described in Fig. 2, except that the histogram in B is summed over a range of growth speeds v0 ∈ [0,3] μm/min. Each simulated data point is an average of 1,000 independent simulations. The hydrolysis parameter h is 0.029 s−1 for all simulations. (C) Extension of +TIP proteins at the microtubule tip, as function of growth speed. The experimental Mal3 comet size (squares; from ref. 23) can be compared with the distribution of GTP units with respect to the longest protofilament (black line), averaged from 8,000 simulations. (D) Excursion length distribution for a microtubule growing at a rate g = 1 s−1. The best exponential fit (line) yields a mean excursion length of 38 nm.
+TIP Tracking Tails and Shortening Excursions.
Mal3 is the fission yeast representative of the EB1 family of plus-tip proteins and has been shown to recognize a structural feature of growing microtubule ends (23). Mal3 localizes with an exponential distribution that peaks at the tips of growing microtubules and an extension that increases linearly with microtubule growth speed (23). To test this idea further, we used stochastic simulations to calculate the distribution of GTP units with respect to the longest protofilament in the microtubule. The resulting distributions are exponential for all simulated growth speeds, and the length scale increases linearly with microtubule growth speeds. The results are even in quantitative agreement with the observed distribution of Mal3 (Fig. 4C), thus supporting the idea that the localization of Mal3 indeed reflects the arrangements of the protofilaments at the tip of the microtubules.
The composite model also exhibits shortening excursions where the longest protofilament shortens during periods of overall microtubule growth. Experiments with microtubules grown against barriers under constant force have suggested that shortening events of up to 40 nm can occur (22). The model is in agreement with the magnitude of the backward steps, predicting an average excursion length of 38 nm (Fig. 4D), but it does not reproduce the frequency of these events.
Because there is some controversy over the design and interpretation of micromechanical measurements of microtubule dynamics (22, 30), these observations cannot yet be used as strong criteria for evaluating models, although this situation is likely to be resolved by future experiments.
Induction of Catastrophe by Kinesin-8.
Although in vivo regulation of microtubule dynamic instability by force or tubulin concentration is essential, it is also desirable for a model to capture the regulatory effects of MAPs. For example, the walking depolymerase kinesin-8 induces catastrophes in a length-dependent manner (18, 19). The kinesin-8 is postulated to walk processively toward the plus end of the microtubule and promote catastrophe by removing tubulin subunits (Fig. 5A). To test this idea, we added walking depolymerases to the model. The motor could bind along the length of the microtubule to any protofilament and unbind with the measured kinetics. Motors paused at the microtuble tips, but could be pushed by subsequent motors. Moreover, a pushed motor would break off with the associated terminal tubulin, which promoted castastrope by shortening the GTP cap. The effect of kinesin-8 produced a linear dependence between the frequency of catastrophe and the length of the microtubule (Fig. 5B), as observed from live-cell imaging in fission yeast (20).
Fig. 5.

Induction of catastrophe by a walking depolymerase. (A) In the model, depolymerizing kinesin such as kinesin-8 (18, 19) can bind anywhere on the microtubule lattice with rate a. They walk processively to the plus end with speed v. They stall at the plus end but are pushed by the motor that arrives subsequently, upon which they detach, removing the terminal tubulin unit of the microtubule, such that N − 1 hydrolysis events are now sufficient to induce catastrophe. (B) Effect of the attachment rate a on the catastrophe rate. A total of 700 kinesins are simulated with a speed v = 3 μm/min, and the fiber growth speed is 1.5 μm/min. Different kinesin attachment rates are shown (expressed in number of attachments per s and per unoccupied binding site). For each attachment rate 5 × 10⁴ simulations were averaged. The experimental curve (squares) was measured in S. pombe cells (20).
The analysis can also be verified further if g and h are set to match the observed in vivo dynamics of microtubules, and if we assume a motor speed of v ≈3 μm/min (18). In that case, the length-dependent catastrophe rate (20) provides an estimate of the number of kinesin-8 binding events at ≈100 s−1. However, if we assume that there are ≈700 kinesin-8 molecules per cell [an estimate obtained from budding yeast (31)], the number of diffusional encounters between kinesin-8 molecules and a microtubule is expected to be ≈1,000 s−1. Because only a fraction of the collision events may lead to attachment, the postulated mechanism is indeed consistent with the known characteristics of the system.
Conclusion
The model contains only three parameters. Remarkably, the same set of parameters quantitatively reproduced the behavior of microtubules from a compendium of experimental data. Classical in vitro studies on microtubule catastrophes (13, 16) were used to constrained all parameters: g is set by the rate of microtubule growth; h is set by the catastrophe rate at a specific speed, and N is set by the functional dependence of the catastrophe time on growth rate. The agreement with more recent experiments (20, 22, 23) corroborates the underlying physical model of catastrophes.
In particular, the coupling parameter N is critical to determining the dynamics of catastrophes: we could fit the data only if N = 2. This potentially reflects an intrinsic feature of the microtubule cap, but because the model is phenomenological in nature several different mechanistic interpretations can be considered to apply to the microtubule tip. In recent work it has been shown that the assembly of microtubules must also be related to structural changes in the tubulin dimers (32, 33). An alternative interpretation to the classical chemical kinetic view is therefore that the coupling is mechanical in origin and is triggered by the addition of another subunit. In this scenario, GTP hydrolysis could occur after the conformational change associated with the cap, without affecting the stability of the microtubule.
Walker et al. (13) used a similar 1D model that they called coupled hydrolysis. However, they used N = 13, presumably because it is the number of protofilaments in a typical microtubule, and the model could not therefore fully explain the experimental data. Assuming similarly that hydrolysis occurs fast beyond N, the composite model with N = 2 multiplied by 13 protofilaments conforms to the upper bound of ≈40 for the number of GTP units in growing tips of microtubules (13) and is also consistent with the conclusion that a small cap is sufficient to stabilize the fiber (34). Coupled hydrolysis was used subsequently in the “lateral cap model” (35). This model, however, assumed helical growth of the microtubule and among other things failed to match the linear dependence between growth speed and catastrophe time.
The small N also implies that dynamic instability could be influenced by a very small number of molecules. Consequently, the regulation of microtubules by associated proteins should probably be modeled discretely. The 1D and 3D models discussed here are similar. They both reproduce the effect of tubulin concentration and dilution on catastrophes and the effect of walking depolymerases. The 3D model extends the 1D model by incorporating a gating rescue interaction between neighboring protofilaments. This model exhibited backward excursions and provided a plausible mechanism for the distribution of +TIP proteins (22, 23).
Although the gating rescue model is simple and could reflect the essence of protofilament dynamics at the microtubule tip, it could be extended to incorporate other aspects of the assembly process. For example, in the composite model, the kinetics of each protofilament are identical but, in reality, these rates could differ between protofilaments because of differing accessibility to the solvent or mechanical coupling to neighboring protofilaments. It would also be interesting to include the 3D mechanics that define the sheet-like structure of microtubule ends. Despite its simplifications, the model described here is already applicable to many problems involving microtubule organization. For example, recent work on modeling microtubule organization in fission yeast (36) showed that microtubules are regulated mainly by force and the walking depolymerase klp5/klp6, which is a heterodimer from the kinesin-8 family. Because the 1D and 3D models account for both of these effects, they should accurately predict the behavior of microtubules in this system, without requiring additional ad hoc parameters.
Microtubule rescues were not considered in the current model, because they occur infrequently in vitro and are likely to be initiated by MAPs by a mechanism that has not yet been identified experimentally. However, rescues and pauses are likely to be important for regulating microtubule dynamics in many cell types such as cultured vertebrate cells or interphasic Xenopus egg extracts (6). When further experimental data become available it should also be possible to incorporate the effect of “stable” GTP remnants in the microtubule lattice (37).
The presented models are simple and mathematically tractable and agree well with many key experimental observations. The effects caused by regulatory proteins, which upon binding locally change the growth or the transition rates of GTP tubulin can be included. They may therefore prove useful in studying the modulation of dynamic instability, which is an essential element of microtubule function in vivo.
Materials and Methods
Analysis of the Models.
Assuming a small time scale τ, the 1D model can be approximated by a Markov chain (28) with 2N states, where N is the coupling parameter. The transitions from one state to another depend only on the probability G = gτ to add a GTP unit at the tip during the time step and the probability H = hτ to hydrolyze any GTP unit during the time step. It is thus possible to derive the state diagram of the Markov chain (see for N = 2, Fig. 6) and its transition matrix. In the model, the state corresponding to a catastrophe terminates the chain and is called the absorbing state. In general, if it is the final element in the state vector, the transition matrix can be written as
 |
where P is the square matrix of size (2N − 1) describing the transitions between transient states, 1 is scalar and P0 is the vector containing the probabilities to reach the absorbing state from each transient state in one step. The mean number of steps before catastrophe is then M = ωt (I − P)−1 1 (38), where ω is a vector of length (2N − 1) containing the initial probability of each transient state, i is the identity matrix of size (2N − 1), and 1 is the vector [1,1,…, 1] of size (2N − 1).
Fig. 6.

State transition diagram for the 1D model with N = 2. The rectangles represent the possible states for the two terminal tubulin units, with transitions indicated by arrows. The probabilities of each transition for a time τ are calculated from G = g τ and H = h τ, where g and h are the rates to grow and hydrolyze, respectively. The state DD (in gray) is called the absorbing state, because no transition leaves from it.
For example for N = 2, the state vector is [TT, DT, TD, DD], where DD is the absorbing state. The transition matrix reads
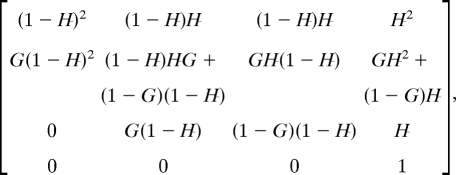 |
and for vanishing τ we obtain the average catastrophe time T = τM:
In the case where h ≪ g, the linear dependency between the catastrophe time and the growth rate appears:
The transition matrix for N = 3 and 4 and the average catastrophe time were derived similarly.
Simulations.
The models were simulated stochastically by using a fixed time step τ = 5 ms, generating trajectories for the Markov process illustrated on Fig. 6. A C++ implementation of the 1D model is available at www.cytosim.org.
To find the dependence of the catastrophe time on the growth speed, the parameter g was varied while h was held constant. The value for h was determined by fitting the catastrophe time of each model to the experimentally observed value of 550 s for microtubules growing at a speed of 2.4 μm·s−1 (Fig. 2C).
To simulate the dilution experiments, g was set to 0 after 10 s of simulated time, which is sufficient to reach a steady state for the cap size. To fit the distribution of catastrophe time after dilution (Fig. 2D), we used the number α of GTP units in the cap at dilution time. Because hydrolysis of different units occur independently at rate h, the probability of a catastrophe after a time t is p = (1 − e−ht)α. α is used as a fitting parameter to best match the distribution of catastrophe time obtained numerically with the corresponding probability density function αh (eht − 1)α−1e−αht. The parameter h is known and as expected, the fit-derived value of α is between 1 and N.
Walking Depolymerase.
The 3D model was simulated in the presence of depolymerizing kinesin-8 molecules. Each unbound kinesin molecule in the simulation contributes a binding probability a = 10−4 s−1 per binding site on the microtubule. Bound kinesin-8 molecules are simulated individually and exclude each other on the microtubule lattice. They bind stochastically to unoccupied sites with a rate a, and then move toward the plus end with an average velocity v = 2vgrowth. The number of steps made by a kinesin for the time interval τ follows a Poisson law with parameter vτ/δ, but progression is allowed only if the subsequent site is unoccupied. The kinesins walk processively toward the plus end, unbinding stochastically with realistic rate [one event per 1,500 steps (18)]. They stall at the microtubule end, but if another motor arrives subsequently, they detach, removing the terminal tubulin unit with them (19). Microtubules are described with the composite 3D protofilament model with N = 2, h = 0.029 s−1, and g = 3 s−1 (vgrowth ≈1.5 μm/min). Similar results were obtained with the 1D model.
The number of binding events per unit time can be derived by fitting the measured microtubule catastrophe rate using the model of kinesin-8 (Fig. 5B). For a 10-μm-long microtubule, the total number of binding sites is ≈ 10 × 13/0.008 ≈ 16,000. For the attachment rate per binding site ≈10−5/s obtained from the fit, the number of attachments should be ≈110 per s. However, we can estimate the number of diffusional encounters for a Brownian process. For this, the equation for first capture time ΔW + 1/D = 0 (30) was solved in a cylindrical geometry of length 10 μm and radius R = 2 μm with the boundary conditions ∂rW(R) = 0 (reflecting barrier at the cell membrane) and W(ε) = 0 (absorbing barrier for one microtubule along the central axis). With ε = 30 nm and D = 10 μm2/s, the capture time from an initial position on the cylinder's edge is W(R) ≈0.7 s. With ≈700 proteins in the cell, 700/0.7 = 1,000 collision events are possible per s. Although we cannot estimate the fraction of collisions leading to attachment, this simple calculation sets the lower number of molecules necessary to make this scenario possible.
Supplementary Material
Acknowledgments.
We thank Thomas Surrey, Christian Tischer, and Philipp Keller for critically reading the manuscript; Christian Tischer for sharing unpublished data; and Pierre Connault for discussion. This work was supported by BioMS (Center for Modeling and Simulation in the Biosciences), the Volkswagenstiftung, and Human Frontier Science Program Grant HFSP RGY084.
Footnotes
The authors declare no conflict of interest.
This article is a PNAS Direct Submission.
This article contains supporting information online at www.pnas.org/cgi/content/full/0910774106/DCSupplemental.
References
- 1.Mitchison T, Kirschner M. Dynamic instability of microtubule growth. Nature. 1984;312:237–242. doi: 10.1038/312237a0. [DOI] [PubMed] [Google Scholar]
- 2.Kirschner M, Mitchison T. Beyond self-assembly: From microtubules to morphogenesis. Cell. 1986;45:329–342. doi: 10.1016/0092-8674(86)90318-1. [DOI] [PubMed] [Google Scholar]
- 3.Hill TL. Linear Aggregation Theory in Cell Biology. New York: Springer; 1987. [Google Scholar]
- 4.Bayley PM, Schilstra MJ, Martin SR. A simple formulation of microtubule dynamics: Quantitative implications of the dynamic instability of microtubule populations in vivo and in vitro. J Cell Sci. 1989;93:241–254. doi: 10.1242/jcs.93.2.241. [DOI] [PubMed] [Google Scholar]
- 5.Verde F, Dogterom M, Stelzer E, Karsenti E, Leibler S. Control of microtubule dynamics and length by cyclin A- and cyclin B-dependent kinases in Xenopus egg extracts. J Cell Biol. 1992;118:1097–1108. doi: 10.1083/jcb.118.5.1097. [DOI] [PMC free article] [PubMed] [Google Scholar]
- 6.Keller PJ, Pampaloni F, Lattanzi G, Stelzer EHK. Three-dimensional microtubule behavior in Xenopus egg extracts reveals four dynamic states and state-dependent elastic properties. Biophys J. 2008;95:1474–1486. doi: 10.1529/biophysj.107.128223. [DOI] [PMC free article] [PubMed] [Google Scholar]
- 7.Antal T, Krapivsky PL, Redner S. Dynamics of microtubule instabilities. J Stat Mech. 2007;5:L05004. doi: 10.1088/1742-5468/2007/05/L05004. [DOI] [PMC free article] [PubMed] [Google Scholar]
- 8.Ranjith P, Lacoste D, Mallick K, Joanny JF. Nonequilibrium self-assembly of a filament coupled to atp/gtp hydrolysis. Biophys J. 2009;96:2146–2159. doi: 10.1016/j.bpj.2008.12.3920. [DOI] [PMC free article] [PubMed] [Google Scholar]
- 9.Flyvbjerg H, Holy TE, Leibler SE. Stochastic dynamics of microtubules: A model for caps and catastrophes. Phys Rev Lett. 1994;73:2372–2375. doi: 10.1103/PhysRevLett.73.2372. [DOI] [PubMed] [Google Scholar]
- 10.Van Buren V, Cassimeris L, Odde DJ. Mechanochemical model of microtubule structure and self-assembly kinetics. Biophys J. 2005;89:2911–2926. doi: 10.1529/biophysj.105.060913. [DOI] [PMC free article] [PubMed] [Google Scholar]
- 11.Martin SR, Schilstra MJ, Bayley PM. Dynamic instability of microtubules: Monte Carlo simulation and application to different types of microtubule lattice. Biophys J. 1993;65:578–596. doi: 10.1016/S0006-3495(93)81091-9. [DOI] [PMC free article] [PubMed] [Google Scholar]
- 12.Van Buren V, Odde DJ, Cassimeris L. Estimates of lateral and longitudinal bond energies within the microtubule lattice. Proc Natl Acad Sci USA. 2002;99:6035–6040. doi: 10.1073/pnas.092504999. [DOI] [PMC free article] [PubMed] [Google Scholar]
- 13.Walker RA, et al. Dynamic instability of individual microtubules analyzed by video light microscopy: Rate constants and transition frequencies. J Cell Biol. 1988;107:1437–1448. doi: 10.1083/jcb.107.4.1437. [DOI] [PMC free article] [PubMed] [Google Scholar]
- 14.Janulevicius A, Van Pelt J, Van Ooyen A. Compartment volume influences microtubule dynamic instability: A model study. Biophys J. 2006;90:788–798. doi: 10.1529/biophysj.105.059410. [DOI] [PMC free article] [PubMed] [Google Scholar]
- 15.Gregoretti IV, Margolin G, Alber MS, Goodson HV. Insights into cytoskeletal behavior from computational modeling of dynamic microtubules in a cell-like environment. J Cell Sci. 2006;119:4781–4788. doi: 10.1242/jcs.03240. [DOI] [PubMed] [Google Scholar]
- 16.Janson ME, de Dood ME, Dogterom M. Dynamic instability of microtubules is regulated by force. J Cell Biol. 2003;161:1029–1034. doi: 10.1083/jcb.200301147. [DOI] [PMC free article] [PubMed] [Google Scholar]
- 17.Howard J, Hyman AA. Microtubule polymerases and depolymerases. Curr Opin Cell Biol. 2007;19:31–35. doi: 10.1016/j.ceb.2006.12.009. [DOI] [PubMed] [Google Scholar]
- 18.Varga V, et al. Yeast kinesin-8 depolymerizes microtubules in a length-dependent manner. Nat Cell Biol. 2006;8:957–962. doi: 10.1038/ncb1462. [DOI] [PubMed] [Google Scholar]
- 19.Varga V, et al. Kinesin-8 motors act cooperatively to mediate length-dependent microtubule depolymerization. Cell. 2009;138:1174–1183. doi: 10.1016/j.cell.2009.07.032. [DOI] [PubMed] [Google Scholar]
- 20.Tischer C, Brunner D, Dogterom M. Force- and kinesin-8-dependent effects in the spatial regulation of fission yeast microtubule dynamics. Mol Syst Biol. 2009;5:250. doi: 10.1038/msb.2009.5. [DOI] [PMC free article] [PubMed] [Google Scholar]
- 21.Kerssemakers JWJ, et al. Assembly dynamics of microtubules at molecular resolution. Nature. 2006;442:709–712. doi: 10.1038/nature04928. [DOI] [PubMed] [Google Scholar]
- 22.Schek HT, 3rd, Gardner MK, Cheng J, Odde DJ, Hunt AJ. Microtubule assembly dynamics at the nano scale. Curr Biol. 2007;17:1445–1455. doi: 10.1016/j.cub.2007.07.011. [DOI] [PMC free article] [PubMed] [Google Scholar]
- 23.Bieling P, et al. Reconstitution of a microtubule plus-end tracking system in vitro. Nature. 2007;450:1100–1105. doi: 10.1038/nature06386. [DOI] [PubMed] [Google Scholar]
- 24.Drechsel DN, Hyman AA, Cobb MH, Kirschner MW. Modulation of the dynamic instability of tubulin assembly by the microtubule-associated protein tau. Mol Biol Cell. 1992;3:1141–1154. doi: 10.1091/mbc.3.10.1141. [DOI] [PMC free article] [PubMed] [Google Scholar]
- 25.Walker RA, Pryer NK, Salmon ED. Dilution of individual microtubules observed in real time in vitro: Evidence that cap size is small and independent of elongation rate. J Cell Biol. 1991;114:73–81. doi: 10.1083/jcb.114.1.73. [DOI] [PMC free article] [PubMed] [Google Scholar]
- 26.Voter WA, O'Brien ET, Erickson HP. Dilution-induced disassembly of microtubules: Relation to dynamic instability and the GTP cap. Cell Motil Cytoskeleton. 1991;18:55–62. doi: 10.1002/cm.970180106. [DOI] [PubMed] [Google Scholar]
- 27.Garner EC, Campbell CS, Mullins RD. Dynamic instability in a DNA-segregating prokaryotic actin homolog. Science. 2004;306:1021–1025. doi: 10.1126/science.1101313. [DOI] [PubMed] [Google Scholar]
- 28.Papoulis A, Pillai SU. Probability, Random Variables, and Stochastic Processes. 4th Ed. New York: McGraw Hill; 2002. [Google Scholar]
- 29.Chretien D, Fuller SD, Karsenti E. Structure of growing microtubule ends: Two-dimensional sheets close into tubes at variable rates. J Cell Biol. 1995;129:1311–1328. doi: 10.1083/jcb.129.5.1311. [DOI] [PMC free article] [PubMed] [Google Scholar]
- 30.Berg HC. Random Walks in Biology. Princeton: Princeton Univ Press; 1992. [Google Scholar]
- 31.Ghaemmaghami S, et al. Global analysis of protein expression in yeast. Nature. 2003;425:737–741. doi: 10.1038/nature02046. [DOI] [PubMed] [Google Scholar]
- 32.Wang HW, Nogales E. Nucleotide-dependent bending flexibility of tubulin regulates microtubule assembly. Nature. 2005;435:911–915. doi: 10.1038/nature03606. [DOI] [PMC free article] [PubMed] [Google Scholar]
- 33.Rice LM, Montabana EA, Agard DA. The lattice as allosteric effector: Structural studies of αβ- and γ-tubulin clarify the role of GTP in microtubule assembly. Proc Natl Acad Sci USA. 2008;105:5378–5383. doi: 10.1073/pnas.0801155105. [DOI] [PMC free article] [PubMed] [Google Scholar]
- 34.Drechsel DN, Kirschner MW. The minimum GTP cap required to stabilize microtubules. Curr Biol. 1994;4:1053–1061. doi: 10.1016/s0960-9822(00)00243-8. [DOI] [PubMed] [Google Scholar]
- 35.Bayley P, Schilstra M, Martin S. A lateral cap model of microtubule dynamic instability. FEBS Lett. 1989;259:181–184. doi: 10.1016/0014-5793(89)81523-6. [DOI] [PubMed] [Google Scholar]
- 36.Foethke D, Makushok T, Brunner D, Nédélec F. Force- and length-dependent catastrophe activities explain interphase microtubule organization in fission yeast. Mol Syst Biol. 2009;5:241. doi: 10.1038/msb.2008.76. [DOI] [PMC free article] [PubMed] [Google Scholar]
- 37.Dimitrov A, et al. Detection of GTP-tubulin conformation in vivo reveals a role for GTP remnants in microtubule rescues. Science. 2008;322:1353–1356. doi: 10.1126/science.1165401. [DOI] [PubMed] [Google Scholar]
Associated Data
This section collects any data citations, data availability statements, or supplementary materials included in this article.