

Abstract
High mobility group (HMG) proteins regulate chromatin architecture and gene expression. Constitutional rearrangement of an HMG family member, HMGA2, in an 8-year old boy resulted in extreme overgrowth and advanced bone development. Moreover, a recent genome-wide association study documented an association between a variant in the 3′ untranslated region of HMGA2 (rs1042725) and height in otherwise healthy individuals. We attempted to extend these findings by testing if this HMGA2 polymorphism is associated with other skeletal measures in two large population cohorts of diverse race/ethnicity. Genotyping was completed in 1,680 Afro-Caribbean men aged ≥40 years and 1,548 Caucasian American men aged ≥69 years. Bone mineral density (BMD) was assessed with peripheral quantitative computed tomography. The minor allele frequency of rs1042725 was 32% among Afro-Caribbeans and 48% among Caucasians (p<0.0001). No association was observed with height in either study cohort. However, presence of the minor allele of this SNP was associated with decreased tibia trabecular volumetric BMD in both populations (p=0.007 Afro-Caribbean; p=0.0007 Caucasian). Real time quantitative RT-PCR and Western blot analysis demonstrated HMGA2 mRNA and protein expression in the human fetal osteoblast cell line, hFOB. Our analyses suggest a novel association between a common genetic variant in HMGA2 and trabecular BMD in ethnically diverse older men. Additional research is needed to better understand the role of HMGA2 in the regulation of bone metabolism.
Keywords: Osteoporosis, Genetics, BMD, men, HMGA2, race
INTRODUCTION
The high mobility group AT-hook 2 (HMGA2) gene encodes a protein in the high mobility group (HMG) DNA binding family of non-histone architectural transcription factors. These proteins bind the minor groove of AT rich DNA and introduce structural alterations in chromatin. The conformational change in DNA that is induced by HMGA2 facilitates the formation of enhanceosomes, transcriptional complexes that bind to enhancer sequences in target genes to regulate their transcription [1–4]. HMGA2 is expressed in almost all tissues of the early stage embryo and is subsequently restricted to tissues with mesenchymal derivation with apparently limited expression in adults [5].
The HMGA2 protein may play a role in growth regulation. For example, the pygmy mouse phenotype has been linked to a HMGA2 (−/−) genotype, and this phenotype has been replicated by knocking out HMGA2 in mice [5, 6]. An analogous phenotype, the autosomal dwarf chicken, has also been mapped to the HMGA2 locus [6]. Despite the existence of a skeletal phenotype in animal models, the function of HMGA2 in bone development and metabolism is not well defined.
Recently, however, evidence in support of a role for HMGA2 in human bone growth and development has been published. A case study of an 8-year old boy with severe somatic overgrowth and advanced endochondral bone and dental development revealed a pericentric inversion of chromosome 12, with breakpoints at p11.22 and q14.3, at the HMGA2 locus [7]. Also, a recent genome wide association study (GWAS) identified an association of a common single nucleotide polymorphism (SNP) in the 3′ untranslated region of HMGA2 (rs1042725) with a 0.3 cm difference in adult and childhood height in the general population [8]. Since then, two other GWAS have successfully replicated these findings [9, 10]. In the current study, we attempted to extend these findings by testing if the HMGA2 polymorphism is associated with other skeletal measures in two large, well-characterized population samples of ethnically diverse, older men. Finally, we also examined HMGA2 mRNA and protein levels in human fetal and adult osteoblast-like cell lines.
MATERIALS AND METHODS
Study populations
Afro-Caribbean men were participants in the Tobago Bone Health Study, a study of 2,652 community-dwelling men aged 40 years and older who resided on the Caribbean island of Tobago [11]. Men who were ambulatory, not terminally ill and who had not undergone a bilateral hip replacement were recruited between 1998 and 2004 and completed an areal BMD (aBMD) assessment using dual-energy X-ray absorptiometry (DXA). In 2004, participants returned for a follow-up exam and underwent a peripheral quantitative computed tomography (pQCT) scan of the tibia and radius to assess volumetric BMD (vBMD). Approximately 70% of survivors returned for the follow-up exam and 451 new participants were also recruited. Written informed consent was obtained from each participant using forms and procedures approved by the University of Pittsburgh Institutional Review Board, the U.S. Surgeon General’s Human Use Review Board, and the Division of Health and Human Services Institutional Review Board.
Caucasian men were participants in the Osteoporotic Fractures in Men Study [MrOS, 12,13]. MrOS is a prospective study of 5995 men age 65 or older from six clinical centers in the United States (Birmingham, AL; Minneapolis, MN; Palo Alto, CA; Pittsburgh, PA: Portland, OR; and San Diego, CA). Men who were ambulatory, not terminally ill and who had not undergone a bilateral hip replacement were recruited from population-based listings. Areal BMD was assessed by DXA. In a subset of participants (n=1180) from the Minneapolis and Pittsburgh clinical sites, pQCT scans were obtained to assess vBMD of the radius and tibia. Approval of the MrOS study was obtained from institutional review boards at each clinic and written informed consent was obtained from all participants.
Bone Measurements
Areal BMD at the proximal femur and its subregions was measured by DXA in both study populations using a Hologic QDR-4500W densitometer (Hologic Inc., Bedford, MA). Volumetric BMD at the non-dominant forearm and left tibia was measured by pQCT using an XCT-2000 scanner (Stratec Medizintechnik, Pforzheim, Germany). Technicians followed stringent protocols for patient positioning and scanning. A scout view was obtained prior to the pQCT scan to define an anatomic reference line for the relative location of the subsequent scans (4% and 33% of the total length) at the radius and tibia. Tibia length was measured from the medial malleolus to the medial condyle of the tibia, and forearm length was measured from the olecranon to the ulna styloid process. A single axial slice of 2.5 mm thickness with a voxel size of 0.5 mm and a speed of 20 mm/s was taken at all locations. Image processing was performed using the Stratec software package (Version 5.5E). To determine the trabecular vBMD (mg/cm3) at the 4% site of the radius and tibia, identical parameters for contour finding and separation of trabecular and cortical bone were: contour mode 2, Threshold=169 mg/cm3; peel mode 1, area=45%. To determine the cortical vBMD (mg/cm3) at the 33% site of the radius and tibia, identical parameters were: mode 2, Threshold=169 mg/cm3; cortmode 1, Threshold=710 mg/cm3. The short-term in vivo precision of the pQCT measurements for 15 subjects ranged from 0.65% (for cortical density at the tibia) to 2.1% (for trabecular density at the tibia).
Other Measures
Physical characteristics were measured by clinic staff. Body weight was measured in kilograms with participants wearing light clothing and without shoes using a calibrated balance beam scale. Height was measured in centimeters without participants wearing shoes using a stadiometer. Two to four height measurements were made and the average used in analysis.
Genotyping
Genotyping was performed using a pre-designed TaqMan SNP assay (Applied Biosystems, Foster City, CA). Genotyping was completed on genomic DNA according to the manufacture’s protocol on a 7900HT Fast Real-Time PCR system (Applied Biosystems, Foster City, CA). The reactions were cycled with standard TaqMan conditions (95°C for 10 min, 45 cycles of 95°C for 15 sec and 60°C for 1 min, and final cool down to 4°C). The genotypes were called with the Applied Biosystems SDS 2.2.2 software package. The average genotyping completeness rate was 95.6% and the average genotyping consensus rate among the 8.86% blind replicate samples was 99.2%, for both studies. Genotypes were in Hardy-Weinberg equilibrium in both study populations (p>0.05).
Cell Culture
The human adult osteoblast-like cell lines MG63, SaOS-2, HOS and U2-OS were cultured in RPMI medium 1640 with L-Glutamine and 10% fetal bovine serum (v/v) (Invitrogen; Carlsbad, CA). The human fetal osteoblast cell line hFOB was cultured in a 1:1 mixture of DMEM and F12 medium supplemented with 10% fetal bovine serum (v/v) (Invitrogen; Carlsbad, CA). Penicillin/Streptomycin was included in all culture media at a concentration of 2units/mL. The cell cultures were maintained at 37°C in a humidified chamber with 5% CO2.
Real-time Quantitative PCR
MG63, SaOS-2, HOS, U2-OS and hFOB were cultured to sub-confluence (~80–90%) and used for total RNA isolation with Trizol reagent (Invitrogen, Carlsbad, CA) according to the manufacturer’s instructions. Total RNA samples were analyzed using a Nanodrop spectrophotometer (Nanodrop Products, Wilmington, DE). Reverse transcription was performed using 2.5 μg of total RNA and random hexamer with SuperScript III reverse transcriptase according to the manufacturer’s instructions (Invitrogen, Carlsbad, CA). For real time quantitative PCR, the cDNA product was analyzed in a 10 μl reaction containing 0.5 μM of HMGA2 primer/probes (Hs00971725_m1) and 2x Universal Master Mix according to the Manufacturer’s instructions (Applied Biosystems, Foster City, CA). Amplification was conducted on a 7900HT Fast Real-Time PCR system (Applied Biosystems. Foster City, CA) with the following PCR conditions: 50 °C for 2 min, 95 °C for 10 min, 40 cycles at 94 °C for 15 s, and 60 °C for 1 min. HMGA2 expression was normalized to human GAPDH expression level. All reactions were run in duplicate. No template and no reverse transcriptase controls were performed simultaneously. Expression of HMGA2 in ΔCt was obtained using ΔCt = CtHMGA2-Ct GAPDH for each cell line. Relative level of expression (ΔΔCt) of each cell line was calculated by comparing ΔCt to the ΔCt of HOS (ΔΔCt = ΔCt target cell − ΔCt HOS).
Western blot analysis
Ten μg of total protein isolated from cells at sub-confluence were resolved by SDS-PAGE, transferred to nitrocellulose and analyzed by standard immunoblotting using HRP-conjugated secondary antibody and chemiluminescence detection (Pierce Biotechnology, Rockford, IL). Rabbit polyclonal anti-HMGA2 (HMG1-C) antibody was used (Sc-30223 Santa-Cruz Biotechnology; Santa Cruz, CA). The expression of β-actin was analyzed to demonstrate the amount of total protein in each sample.
Statistical analysis
Associations with bone phenotypes were tested assuming additive and recessive inheritance models using linear regression or analysis of covariance (ANCOVA). Allele frequencies were determined by gene counting and Hardy-Weinberg equilibrium was tested by a goodness of fit statistic. For the additive model, a linear regression model was constructed to test if 0, 1, or 2 minor alleles were associated with bone phenotypes. The continuous phenotypes were regressed on the allele count (0, 1, 2). For the recessive inheritance model, ANCOVA was used to test the association between genotype and phenotype. All models were adjusted for age. Statistical analysis was performed using the Statistical Analysis System (SAS 9.1; SAS Institute, Cary, NC).
RESULTS
Population Characteristics
Afro-Caribbean men ranged, in age, from 40–92 years (mean, 58.8 years) (Table 1). Caucasian men ranged in age from 69–97 years (mean, 77.8 years). The two populations were similar in body size. The minor allele (T) frequencies of rs1042725 differed between the two populations (Afro-Caribbean: 0.321; Caucasian: 0.479; p<0.0001).
Table 1.
Characteristicsa of the Genotyped Men.
| Afro-Caribbean (n=1680) | Caucasian (n=1548) | |
|---|---|---|
| Age (yr) | 58.8 (10.43) | 77.8 (5.50) |
| Age Range (yr) | 40–92 | 69–97 |
| Height (cm) | 174.91 (6.79) | 172.98 (6.87) |
| Weight (kg) | 84.32 (15.72) | 83.58 (13.61) |
| BMI (kg/m2) | 27.53 (4.73) | 27.90 (4.05) |
| Minor Allele Frequency | 0.321 | 0.479 |
values are mean(SD)
HMGA2 Genetic Associations in Afro-Caribbean Men
Genetic association results for the genotyped SNP in HMGA2 (rs1042725) and height, body weight, trabecular and cortical vBMD at the radius and tibia, and proximal femur aBMD in Afro-Caribbean men are summarized in Table 2. There was no statistically significant association between variation at rs1042725 and height or body weight. The minor allele of rs1042725 was associated with lower trabecular and cortical vBMD. At the tibia, cortical vBMD differed by 5 mg/cm3 or 0.18 standard deviations (SD) (p=0.005) and trabecular vBMD differed by 8 mg/cm3 or 0.19 SDs (p=0.007), between homozygous genotype groups. At the radius, the effect size was identical to the tibia; cortical vBMD differed by 5 mg/cm3 (p=0.018) and trabecular vBMD differed by 8 mg/cm3 (p=0.022), between homozygous genotypes. Lastly, DXA assessed aBMD of the proximal femur showed borderline associations at the total hip (p=0.08), but a significant difference of 0.03 mg/cm2 in BMD at the femoral neck between homozygous genotypes (p=0.01). Similar results were observed in models with additional adjustment for height and weight (results not shown).
Table 2.
HMGA2 Genotype Associations with Anthropometric and Bone Mineral Density Measures in Afro-Caribbean Men.
| Trait | Genotype Mean (SE) |
p-valueb | ||
|---|---|---|---|---|
| C/C (n=759) | C/T (n=733) | T/T (n=180) | ||
| Height (cm) | 174.85 (0.23) | 175.20 (0.24) | 175.07 (0.47) | 0.4105a |
| Weight (kg) | 84.22 (0.53) | 84.71 (0.55) | 84.14 (1.09) | 0.5804r |
| Radius BMD (mg/cm3) | ||||
| Trabecular | 208 (2) | 206 (2) | 200 (3) | 0.0220r |
| Cortical | 1213 (1) | 1210 (1) | 1208 (2) | 0.0180a |
| Tibia BMD (mg/cm3) | ||||
| Trabecular | 230 (1) | 227 (1) | 222 (3) | 0.0071a |
| Cortical | 1178 (1) | 1174 (1) | 1173 (2) | 0.0054a |
| Proximal Femur BMD (g/cm2) | ||||
| Total Hip | 1.15 (0.005) | 1.15 (0.005) | 1.13 (0.010) | 0.0852r |
| Femoral Neck | 1.00 (0.005) | 0.99 (0.005) | 0.97 (0.010) | 0.0166r |
p-value of the best fit model are shown, age adjusted;
additive model;
recessive model. The P values highlighted in bold face achieve Bonferroni adjusted statistical significance accounting for the six BMD traits (P<0.008).
HMGA2 Genetic Associations in Caucasian Men
Genetic association results for the genotyped SNP in HMGA2 (rs1042725) and height, body weight, trabecular and cortical vBMD at the radius and tibia, and proximal femur aBMD in Caucasian men are summarized in Table 3. Similar to results in the Afro-Caribbean men, there was no statistically significant association between variation at rs1042725 and height or body weight (p=0.16 and p=0.27, respectively), although there was a trend towards decreased height with the presence of the minor allele (0.69 cm difference between homozygous genotypes). The strongest association observed was for trabecular vBMD at the tibia, where the minor T/T genotype was associated with 12 mg/cm3 or 0.30 SD lower vBMD compared to the C/C genotype (p=0.0007). In contrast to analyses in the Afro-Caribbean men, there was no statistically significant association between rs1042725 variation and cortical vBMD in the Caucasian population at either the tibia or radius. Lastly, there was no statistically significant association between rs1042725 and DXA assessed aBMD at either the total hip or the femoral neck. Similar results were observed in models with additional adjustment for height and weight (results not shown).
Table 3.
HMGA2 Genotype Associations with Anthropometric and Bone Mineral Density Measures in Caucasian Men.
| Trait | Genotype Mean (SE) |
p-valueb | ||
|---|---|---|---|---|
| C/C (n=423) | C/T (n=768) | T/T (n=357) | ||
| Height (cm) | 173.38(0.34) | 172.89(0.25) | 172.69(0.38) | 0.1640a |
| Weight (kg) | 84.24(0.67) | 83.39(0.49) | 83.19(0.74) | 0.2719a |
| Radius BMD (mg/cm3) | ||||
| Trabecular | 200(3) | 197(2) | 193(3) | 0.0996a |
| Cortical | 1159(2) | 1160(1) | 1158(2) | 0.6211r |
| Tibia BMD (mg/cm3) | ||||
| Trabecular | 235(2) | 232(2) | 223(3) | 0.0007a |
| Cortical | 1136(2) | 1136(1) | 1133(2) | 0.1779r |
| Proximal Femur BMD(g/cm2) | ||||
| Total Hip | 0.96(0.01) | 0.97(0.01) | 0.96(0.01) | 0.3718r |
| Femoral Neck | 0.79(0.01) | 0.79(0.01) | 0.79(0.01) | 0.7643r |
p-value of the best fit model are shown, age and site adjusted;
additive model;
recessive model; total n for DXA measures is 1398 and for pQCT measures is 1068. The P values highlighted in bold face achieve Bonferroni adjusted statistical significance accounting for the six BMD traits (P<0.008).
HMGA2 mRNA and Protein Expression in Bone Cells
Expression levels of HMGA2 mRNA and protein in bone cells were characterized using osteoblast-like adult cell lines MG63, SaOS-2, HOS, U2-OS and the fetal osteoblast cell line hFOB. Using real time quantitative RT-PCR, we detected a very high level of HMGA2 mRNA in fetal hFOB (1299 relative fold) in comparison to MG63, SaOS-2, HOS and U2-OS cells (4.6, 17.7, 1, and 11.9 relative fold, respectively) (Figure 1A). The presence of HMGA2 in these cells was further confirmed using Western blot analysis. In agreement with the real time quantitative RT-PCR, HMGA2 protein was detected in hFOB but not in the other osteoblast-like cells (Figure 1B).
Figure 1. Expression of HMGA2 in osteoblast-like cell lines.
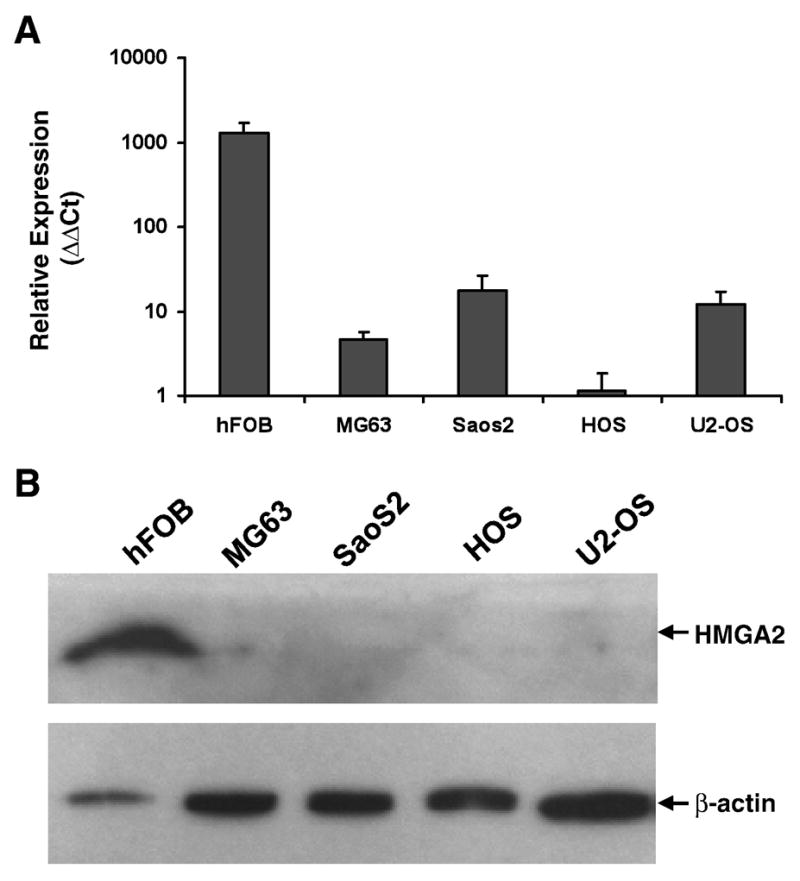
A. Quantitative RT-PCR of HMGA2 using total RNA isolated from each cell line. Relative expression level (ΔΔCt) was calculated using ΔCt of HOS as a reference. B. Western blot analysis of HMGA2 protein. B-actin was used as an internal control to demonstrate protein loading. The locations of HMGA2 and β-actin are labeled with arrows.
DISCUSSION
We used two ethnically diverse cohorts of older men to analyze genetic associations between a common polymorphism (rs1042725) within the HMGA2 gene and measures of bone mineral density. Our analysis was prompted by the recent discovery that this HMGA2 polymorphism is associated with height in humans [8–10] and by reports of a severe skeletal phenotype including shortened bones and advanced endochondral bone formation in a boy with constitutional rearrangement of the HMGA2 gene region [7]. While we did not replicate the association with height in our population samples, we did document statistically significant associations with multiple measures of BMD in two independent and racially diverse populations. The most consistent association was observed in trabecular volumetric BMD at the distal end of the tibia in both populations. In both the Caucasian and Afro-Caribbean populations, rs1042725 in HMGA2 had a greater association at the weight bearing tibia site compared to the radius. These results suggest a novel association of a variant in HMGA2 and individual variation in BMD.
There were statistically significant associations with both trabecular and cortical vBMD at the tibia and the radius in Afro-Caribbeans, where the effect size was similar at both skeletal sites (8 mg/cm3 decrease in trabecular vBMD, 5 mg/cm3 decrease in cortical vBMD). Also, there was a significant association with areal BMD at the femoral neck. In the Caucasian men, we observed a statistically significant association with trabecular vBMD only at the tibia (12 mg/cm3 difference). Because the variation in trabecular vBMD at the radius was greater in the Caucasians compared to the Afro-Caribbeans, the trend did not achieve statistical significance at this skeletal site (7 mg/cm3 difference; p=0.10). Differences in age between the two cohorts may have also contributed to the different results. The increased effect size observed in the Afro-Caribbean than in the Caucasian men could be also due to greater genetic homogeneity of the Afro-Caribbean population.
We were unable to replicate a previously reported association between rs1042725 and height in the current study. There have been three genome-wide association studies which have confirmed an association between height and HMGA2 variation [8–10]. These studies involved more than 16,000 European ancestry subjects with mean ages between 50 and 60 years, and detected very small genotype related differences (±0.4 cm) in height [8]. Therefore, a likely reason we were unable to replicate an association with height is due to inadequate statistical power to detect such small genotype related differences. However, we did observe a similar non-significant trend for decreased height with the HMGA2 minor allele in the Caucasian population.
We cannot be sure that the SNP in this study is the causal variant associated with the observed differences in BMD. However, the linkage disequilibrium (LD) pattern within a one megabase region of HMGA2 (Figure 2) shows that the only other SNPs with significant LD with the tested SNP are in the HMGA2 gene region. There are no other variants in neighboring genes that are in LD with the associated SNP in HMGA2. Thus, it seems likely that a SNP within HMGA2 is the causal variant.
Figure 2. Linkage Disequilibrium and Recombination in a One Megabase Region Surrounding rs1042725 in the HGMA2 Gene.

The linkage disequilibrium values from the HapMap project are depicted for all known variants within the region and show strong LD only within the immediate HMGA2 region (◆ = rs1042725; o = Yoruban Population; x = CEPH Utah Population).
There has been little research directed at understanding the role of HMGA2 in bone development and metabolism. Although the pygmy phenotypes in mice and chickens which are associated with the HMGA2 locus are small in body size, most research has been related to the role of HMGA2 in adipose differentiation and in lipomatosis [1–7, 14, 15]. The current findings and a case report of a Caucasian boy with rearrangement of the HMGA2 gene region and abnormal bone phenotypes, such as flared, enlarged epiphyses, shortened long bones and advanced endochondral bone age suggests that HMGA2 may play a role in skeletal development and determining normal variation in BMD [7].
HGMA proteins are involved in cell cycle regulation and are implicated in the processes of cellular differentiation, proliferation and apoptosis [15–17], and have recently been implicated in cellular senescence [18]. The HMGA proteins respond to external signals such as growth factors, cytokines, tumor suppressors/promoters and differentiation factors by altering gene transcription and cell-cycle progression through nucleosome DNA binding [17]. Expression of HMGA2 in human embryonic stem cells during embryoid body development has been demonstrated [16] and HMGA2 has also been implicated in determining the epithelial-mesenchymal transition in early development [19]. Previous expression studies have confirmed the presence of HMGA2 in early embryonic tissue, and that expression may be restricted to the lung and kidney in the adult [16]. In order to confirm the presence of HMGA2 in bone cells, we analyzed the expression of HMGA2 in fetal and adult osteoblast-like cell lines using real time quantitative RT-PCR and Western blot analysis. Consistent with previous reports, we detected HMGA2 mRNA and protein levels only in the fetal osteoblast hFOB cells. HMGA proteins influence the expression of genes involved in chondrogenesis such as COL11A2 [20] and recombinant HMGA2 was recently shown to increase proliferation and growth of chondrocytes in vitro [21]. Thus, it is possible that HMGA2 might play a role in cartilage and bone formation early in life perhaps in an allele specific manner.
The functional significance of rs1042725 in the 3′ untranslated region (UTR) of HMGA2 is unclear. The 3′ UTR of HMGA2 has been implicated in post-transcriptional regulation [22, 23] through multiple target sites for microRNAs. It is possible that 3′ UTR SNPs, acting either alone or as a haplotype, influence microRNA binding, secondary structure of the mRNA and half-life of the transcript [24]. Alternatively, the functional variant may be in linkage disequilibrium with rs1042725. Additional research is needed to test these possibilities.
Although the mechanisms underlying the current findings are unclear, our results suggest that there is an association between a 3′ UTR genetic variant in HMGA2 and BMD. Specifically, in two large, ethnically diverse cohorts, we have demonstrated a robust association between rs1042725 and trabecular volumetric BMD. This genetic association and bone cell specific expression data support the need for further research on the function of HMGA2 in human bone.
Acknowledgments
The authors thank Zhao Jin for technical assistance in qRT-PCR and Western blot analysis. This work was supported by grants R01-AR049747 and R01-AR051124 from The National Institute of Arthritis and Musculoskeletal Diseases (NIAMS), and R01-CA84950 from The National Cancer Institute. The following institutes provide support for the Osteoporotic Fractures in Men (MrOS) Study: NIAMS, the National Institute on Aging (NIA), the National Center for Research Resources (NCRR), and NIH Roadmap for Medical Research under the following grant numbers: U01 AR45580, U01 AR45614, U01 AR45632, U01 AR45647, U01 AR45654, U01 AR45583, U01 AG18197, U01-AG027810, and UL1 RR024140.
References
- 1.Xianjin Zhou, Kiran Chada. HMGI Family Protein: Architectural Transcription Factors in Mammalian Development and Cancer. Keio J Med. 1998;47:73–77. doi: 10.2302/kjm.47.73. [DOI] [PubMed] [Google Scholar]
- 2.Reeves Raymond. Structure and Function of the HMGI(Y) Family of Architectural Transcription Factors. Envirn Health Perspect. 2000;108:803–9. doi: 10.1289/ehp.00108s5803. [DOI] [PubMed] [Google Scholar]
- 3.Noro B, Licheri B, Sgarra R, Rustighi A, Tessari MA, Chau KY, Ono SJ, Giancotti V, Manfioletti G. Molecular Dissection of the Architectural Transcription Factor HMGA2. Biochemistry. 2003;42:4569–77. doi: 10.1021/bi026605k. [DOI] [PubMed] [Google Scholar]
- 4.Goodwin G. Molecules in focus: The high mobility group protein, HMGI-C. Int J Biochem Cell Biol. 1998;30:761–6. doi: 10.1016/s1357-2725(98)00016-8. [DOI] [PubMed] [Google Scholar]
- 5.Berg JP. Pygmy mouse gene mutation protects against obesity. Euro J Endocrinol. 2000;143:317–8. doi: 10.1530/eje.0.1430317. [DOI] [PubMed] [Google Scholar]
- 6.Ruyter-Spira CP, de Groof AC, van der Poel JJ, Herbergs J, Masabanda J, Fries R, Groenen MM. The HMGI-C Gene is a likely candidate for the autosomal dwarf locus in the chicken. J Hered. 1998;89:295–300. doi: 10.1093/jhered/89.4.295. [DOI] [PubMed] [Google Scholar]
- 7.Ligon AH, Moore SDP, Parisi MA, Mealiffe ME, Harris DJ, Ferguson HL, Quade BJ, Morton CC. Constitutional Rearrangement of the Architectural Factor HMGA2: A novel human phenotype including overgrowth and lipomas. Am J Hum Genet. 2005;76:340–8. doi: 10.1086/427565. [DOI] [PMC free article] [PubMed] [Google Scholar]
- 8.Weedon M, Lettre G, Freathy R, Lindgren C, Voight B, Perry J, Elliott K, Hackett R, Guiducci C, Shields B, Zeggini E, Lango H, Lyssenko V, Timpson N, Burtt N, Rayner N, Saxena R, Ardlie K, Tobias J, Ness A, Ring S, Palmer C, Morris A, Peltonen L, Salomaa V, Smith G, Groop L, Hattersley A, McCarthy M, Hirschhorn J, Frayling T The Diabetes Genetics Initiative, The Wellcome Trust Case Control Consortium. A common variant of HMGA2 is associated with adult and childhood height in the general population. Nat Genet. 2007;39:1245–50. doi: 10.1038/ng2121. [DOI] [PMC free article] [PubMed] [Google Scholar]
- 9.Sanna S, Jackson AU, Nagaraja R, Willer CJ, Chen WM, Bonnycastle L, Shen H, Timpson N, Lettre G, Usala G, Chines PS, Stringham HM, Scott LJ, Dei M, Lai S, Albai G, Crisponi L, Naitza S, Doheny KF, Pugh EW, Ben-Shlomo Y, Ebrahim S, Lawlor DA, Bergman RN, Watanabe RM, Uda M, Tuomilehto J, Coresh J, Hirschhorn JN, Shuldiner AR, Schlessinger D, Collins FS, Smith GD, Boerwinkly E, Cau A, Boehnke M, Abecasis GR, Mohlke KL. Common variants in the GDF-UQCC region are associated with variation in human height. Nat Genet. 2008;40:198–203. doi: 10.1038/ng.74. [DOI] [PMC free article] [PubMed] [Google Scholar]
- 10.Weedon MN, Lango H, Lindgren CM, Wallace C, Evans DM, Mangino M, Freathy RM, Perry JR, Stevens S, Hall AS, Samani NJ, Shields B, Prokopenko I, Farrall M, Dominiczak A, Johnson T, Bergmann S, Beckmann JS, Vollenweider P, Waterworth DM, Mooser V, Palmer CN, Morris AD, Ouwehand WH, Zhao JH, Li S, Loos RJ, Barroso I, Deloukas P, Sandhu MS, Wheeler E, Soranzo N, Inouye M, Wareham NJ, Caulfield M, Munroe PB, Hattersley AT, McCarthy MI, Frayling TM Diabetes Genetics Initiative; The Wellcome Trust Case Control Consortium; Cambridge GEM Cosortium. Genome-wide association analysis identifies 20 loci that influence adult height. Nat Genet. 2008;40:575–83. doi: 10.1038/ng.121. [DOI] [PMC free article] [PubMed] [Google Scholar]
- 11.Hill DD, Cauley JA, Sheu Y, Bunker CH, Patrick AL, Baker CE, Beckles GL, Wheeler VW, Zmuda JM. Correlates of bone mineral density in men of African ancestry: the Tobago bone health study. Osteoporos Int. 2008;19:227–34. doi: 10.1007/s00198-007-0450-9. [DOI] [PubMed] [Google Scholar]
- 12.Orwoll E, Blank JB, Barrett-Connor E, Cauley J, Cummings S, Ensrud K, Lewis C, Cawthon PM, Marcus R, Marshall LM, McGowan J, Phipps K, Sherman S, Stefanick ML, Stone K. Design and baseline characteristics of the osteoporotic fractures in men (MrOS) study - A large observational study of the determinants of fracture in older men. Contemp Clin Trials. 2005;26:569–85. doi: 10.1016/j.cct.2005.05.006. [DOI] [PubMed] [Google Scholar]
- 13.Blank JB, Cawthon PM, Carrion-Petersen ML, Harper L, Johnson JP, Mitson E, Delay RR. Overview of recruitment for the osteoporotic fractures in men study (MrOS) Contemp Clin Trials. 2005;26:557–68. doi: 10.1016/j.cct.2005.05.005. [DOI] [PubMed] [Google Scholar]
- 14.Pollitzer WS, Anderson JJB. Ethnic and genetic differences in bone mass: a review with a hereditary vs environmental perspective. Am J Clin Nutr. 1989;50:1244–59. doi: 10.1093/ajcn/50.6.1244. [DOI] [PubMed] [Google Scholar]
- 15.Battista S, Fidanza V, Fedele M, Klein-Szanto AJP, Outwater E, Brunner H, Santoro M, Croce CM, Fusco A. The expression of a truncated HMGI-C gene induces gigantism associated with lipomatosis. Cancer Res. 1999;59:4793–7. [PubMed] [Google Scholar]
- 16.Gattas GJ, Quade BJ, Nowak RA, Morton CC. HMGIC expression in human adult and fetal tissues and in uterine leiomyomata. Genes Chromosomes Cancer. 1999;25:316–320. [PubMed] [Google Scholar]
- 17.Reeves R. Molecular biology of HMGA proteins: hubs of nuclear function. Gene. 2001;277:63–81. doi: 10.1016/s0378-1119(01)00689-8. [DOI] [PubMed] [Google Scholar]
- 18.Narita M, Narita M, Krizhanovsky V, Nunez S, Chicas A, Hearn SA, Myers MP, Lowe SW. A novel role for high-mobility group a proteins in cellular senescence and heterochromatin formation. Cell. 2006;126:503–14. doi: 10.1016/j.cell.2006.05.052. [DOI] [PubMed] [Google Scholar]
- 19.Thuault S, Valcourt U, Petersen M, Manfioletti G, Heldin CH, Moustakas A. Transforming growth factor-beta employs HMGA2 to elicit epithelial-mesenchymal transition. J Cell Biol. 2006;174:175–83. doi: 10.1083/jcb.200512110. [DOI] [PMC free article] [PubMed] [Google Scholar]
- 20.Kubo T, Matsui Y, Goto T, Yukata K, Yasui N. Overexpression of HMGA2-LPP fusion transcripts promotes expression of the alpha 2 type XI collagen gene. Biochem Biophys Res Commun. 2006;340:476–81. doi: 10.1016/j.bbrc.2005.12.042. [DOI] [PubMed] [Google Scholar]
- 21.Richter A, Hauschild G, Escobar HM, Nolte I, Bullerdiek J. Application of High-Mobility- Group-A proteins increases the proliferative activity of chondrocytes in vitro . Tissue Eng Part A. doi: 10.1089/ten.tea.2007.0308. Published online August 23, 2008. [DOI] [PubMed] [Google Scholar]
- 22.Borrmann L, Wilkening S, Bullerdiek J. The expression of HMGA genes is regulated by their 3′ UTR. Oncogene. 2001;20:4537–41. doi: 10.1038/sj.onc.1204577. [DOI] [PubMed] [Google Scholar]
- 23.Lee YS, Dutta A. The tumor suppressor microRNA let-7 represses the HMGA2 Oncogene. Genes Dev. 2007;21:1025–30. doi: 10.1101/gad.1540407. [DOI] [PMC free article] [PubMed] [Google Scholar]
- 24.Chen JM, Ferec C, Cooper DN. A systematic analysis of disease-associated variants in the 3′ regulatory regions of human protein-coding genes II: the importance of mRNA secondary structure in assessing the functionality of 3′ UTR variants. Hum Genet. 2006;120:301–33. doi: 10.1007/s00439-006-0218-x. [DOI] [PubMed] [Google Scholar]