The structure of apo malate dehydrogenase from Escherichia coli has been determined to 1.45 Å resolution.
Keywords: malate dehydrogenase, Escherichia coli
Abstract
The structure of apo malate dehydrogenase from Escherichia coli has been determined to 1.45 Å resolution. The crystals belonged to space group C2, with unit-cell parameters a = 146.0, b = 52.0, c = 168.9 Å, β = 102.2°. The structure was determined with the molecular-replacement pipeline program BALBES and was refined to a final R factor of 18.6% (R free = 21.4%). The final model has two dimers in the asymmetric unit. In each dimer one monomer contains the active-site loop in the open conformation, whereas in the opposing monomer the active-site loop is disordered.
1. Introduction
Malate dehydrogenase (MDH) is an enzyme of the citric acid cycle that catalyzes the reversible oxidation of malate to oxaloacetate with the concomitant reduction of NADH. In prokaryotes, MDH is a homodimer (McAlister-Henn et al., 1987 ▶). Apo and holo structures of Escherichia coli malate dehydrogenase have been solved previously (Bell et al., 2001 ▶; Hall & Banaszak, 1993 ▶; Hall et al., 1992 ▶). In the present study, MDH was crystallized unexpectedly as a minor contaminant from a system designed for the overexpression and purification of Pseudomonas aeruginosa salicylate adenylase (PchD) in E. coli. The crystals believed to be PchD were later identified as MDH using the molecular-replacement pipeline program BALBES (Long et al., 2008 ▶). The structure determination and refinement were completed because the data were 0.4 Å higher resolution than the highest resolution ligand-bound structure and 0.75 Å higher resolution than the highest resolution apo structure. MDH crystallized with two dimers in the asymmetric unit. Two monomers (one per dimer) are in the open conformation reported by Banaszak and coworkers (Bell et al., 2001 ▶), in which the loop comprising residues 79–91 shifts position to expose the substrate-binding pocket. In the other monomer of each dimer this loop was disordered and thus was not apparent in the electron density.
2. Experimental methods
2.1. Protein expression and purification
The plasmid pPchD (Quadri et al., 1999 ▶) was a gift from Professor C. T. Walsh (Harvard Medical School). The QuikChange kit (Stratagene) and two primers, 5′-GCG AGC TGG AGG CCC GCG CAT GAC TTG CGG CCG CAC TCG-3′ and 5′-CGA GTG CGG CCG CAA GTC ATG CGC GGG CCT CCA GCT CGC-3′, were used to insert the natural stop codon, thus eliminating the C-terminal histidine tag. E. coli BL21 (DE3) (Stratagene) cells were transformed with this variant of the previous plasmid, encoding the wild-type pchD gene. A single colony was inoculated into 50 ml Luria–Bertani (LB) medium supplemented with kanamycin (50 µg ml−1) and incubated at 310 K with shaking (250 rev min−1) for 6 h. The culture was harvested by centrifugation (6000g, 10 min, 277 K). The pellet was stored at 277 K overnight and resuspended in 2 × 500 ml LB medium supplemented with kanamycin (50 µg ml−1). The cultures were grown at 310 K with shaking (250 rev min−1) until an OD600 of 0.8 was reached. The cultures were cooled to 291 K with continued shaking and protein expression was induced at an OD600 of 0.9 with 0.1 mM isopropyl β-d-1-thiogalactopyranoside. The cells were harvested by centrifugation (6000g, 10 min, 277 K) after 20 h. The cell pellet was resuspended in 30 ml 20 mM Tris–HCl pH 8.5 (lysis buffer).
Cells were disrupted by three passes through a French pressure cell (241 MPa) and the cellular debris was removed by ultracentrifugation (142 000g, 2 h, 277 K). The supernatant was dialyzed overnight against lysis buffer and loaded onto a Source 30Q anion-exchange column (GE Healthcare) equilibrated with lysis buffer. PchD and malate dehydrogenase were eluted at approximately 50–75 mM NaCl in a linear gradient of 0–125 mM NaCl over 20 column volumes. The pooled fractions were loaded onto a Superdex 75 size-exclusion column (GE Healthcare) equilibrated with 100 mM N-(2-acetamido)iminodiacetic acid (ADA) pH 7.0. The fractions containing PchD and malate dehydrogenase were pooled, diluted by half with water and concentrated using an Amicon stirred cell with a YM-30 membrane to 26 mg ml−1 as determined by the Bradford assay.
2.2. Crystallization, data collection and processing
Malate dehydrogenase was selectively crystallized at 291 K by hanging-drop vapor diffusion. Drops containing 4 µl protein solution pre-incubated with 1 mM p-chloromercuribenzoate (PCMB) were mixed with 0.5 µl reservoir solution (100 mM ADA pH 6.5, 0.2 M sodium acetate, 30% PEG MME 5000, 5% glycerol). Rod-shaped single crystals formed in one week and reached full size after two weeks. For data collection, the crystals were washed four times in cryoprotectant containing 100 mM ADA pH 7.0, 30% PEG MME 5000, 30% glycerol to remove excess mercury and flash-cooled in liquid nitrogen. Diffraction data were collected on beamline 9-2 at the Stanford Synchrotron Radiation Laboratory (Menlo Park, California, USA) with a wavelength of 1.00 Å at 100 K. The exposure time per frame was 5 s, with a crystal-to-detector distance of 200 mm. A fluorescence scan of the crystal indicated that mercury was not present. The data were processed with MOSFLM and SCALA (Collaborative Computational Project, Number 4, 1994 ▶). The crystals were assigned to space group C2, with unit-cell parameters a = 146.0, b = 52.0, c = 168.9 Å, β = 102.2°. Data-collection statistics are given in Table 1 ▶.
Table 1. Crystallographic statistics.
Values in parentheses are for the highest resolution shell.
| Data collection | |
| Resolution range (Å) | 60.97–1.45 (1.49–1.45) |
| Space group | C2 |
| Unit-cell parameters (Å, °) | a = 146.0, b = 52.0, c = 168.9, β = 102.2 |
| Observations | |
| Unique | 216241 |
| Total | 1951316 |
| Mosaicity (°) | 0.30 |
| Completeness (%) | 98.4 (94.8) |
| Multiplicity | 2.8 (2.2) |
| Rmerge† | 0.056 (0.417) |
| 〈I/σ(I)〉 | 11.2 (1.5) |
| Refinement | |
| Resolution range (Å) | 60.97–1.45 |
| No. of reflections‡ | 194384 |
| R factor§ | 0.186 |
| Rfree‡ | 0.214 |
| No. of atoms | |
| Protein, non-H | 9422 |
| Nonprotein | 567 |
| R.m.s. deviations | |
| Lengths (Å) | 0.024 |
| Angles (°) | 2.06 |
| Overall B factor (Å2) | 17.6 |
R
merge = 
 .
.
9.9% of the reflections were reserved for calculation of R free.
R factor = 
 .
.
2.3. Structure determination and refinement
A molecular-replacement search using the program BALBES (Long et al., 2008 ▶) and the FASTA sequence of E. coli malate dehydrogenase was completed, yielding a clear solution with one dimer in the asymmetric unit. Inspection of the crystal packing showed gaps in the lattice with electron density corresponding to a second dimer in the asymmetric unit, which was placed with the program Phaser (McCoy et al., 2005 ▶), fixing the first dimer and searching for the second by molecular replacement. Model building was performed using Coot (Emsley & Cowtan, 2004 ▶) in iterative cycles with refinement using REFMAC5 (Winn et al., 2001 ▶). Refinement statistics are given in Table 1 ▶. The final model contains two dimers per asymmetric unit. Monomer A, composed of residues 1–312, forms a dimer with monomer B (residues 1–79 and 87–311). Monomer C, composed of residues 1–312, forms a dimer with monomer D (residues 1–79 and 85–311). The model includes alternate side-chain conformations for 78 amino acids in the four chains. The model also includes 567 water molecules and no mercury. Waters were added using a 2(F o − F c) map at 1.5σ. Additional waters could be added to 2(F o − F c) maps drawn at 1.0σ, thereby lowering the R and R free; however, further refinement did not support the inclusion of these water molecules since the electron density was poor. A Ramachandran plot generated by PROCHECK (Laskowski et al., 1993 ▶) showed that the model exhibits excellent geometry, with 94% of the amino-acid residues in the most favorable region and 6% in the additional allowed region.
2.4. Structure analysis
The structural alignments and calculations of the root-mean-square deviations (r.m.s.d.s) were all performed using LSQMAN in the DEJAVU program package (Kleywegt & Jones, 1997 ▶). The atomic coordinates and structure factors have been deposited in the Protein Data Bank, Research Collaboratory for Structural Bioinformatics, Rutgers University, New Brunswick, New Jersey, USA (entry 3hhp).
3. Results and discussion
This project was initiated with the intent of crystallizing and solving the structure of salicylate adenylase (PchD) from P. aeruginosa (PAO1), a protein involved in the pyochelin siderophore-production pathway. This protein, which was produced with a C-terminal histidine tag using the pPchD plasmid (Quadri et al., 1999 ▶), did not crystallize. Therefore, the tag was removed by the insertion of a stop codon as described in §2 and the protein was again overexpressed and purified from BL21 (DE3) E. coli. The PchD protein contained a few minor contaminants that were evident when visualized by Coomassie-stained SDS–PAGE (Fig. 1 ▶ a), but was deemed suitable for crystallization studies.
Figure 1.
(a) SDS–PAGE gel showing protein purity. The protein purified, salicylate adenylase (PchD) from P. aeruginosa, also contained the E. coli malate dehydrogenase (MDH) contaminant that readily crystallized. (b) Crystals of malate dehydrogenase surrounded by protein precipitate, presumably PchD.
Protein crystals were produced surrounded by protein precipitate (Fig. 1 ▶ b). Crystals were carefully excised from the precipitate and were of diffraction quality, routinely diffracting to 2.0 Å resolution. Since molecular replacement using Phaser (McCoy et al., 2005 ▶) with nonribosomal peptide synthetase adenylase homologues [DhbE from Bacillus subtilis (May et al., 2002 ▶) and PheA from Brevibacillus brevis (Conti et al., 1997 ▶)] failed and incorporation of selenomethionine was ineffective, heavy-atom techniques were employed. One crystal soaked in p-chloromercuribenzoate diffracted to 1.45 Å resolution and a complete data set was collected on Stanford Synchrotron Radiation Lightsource beamline 9-2 (Table 1 ▶). A fluorescence scan of the crystal indicated that no mercury was present.
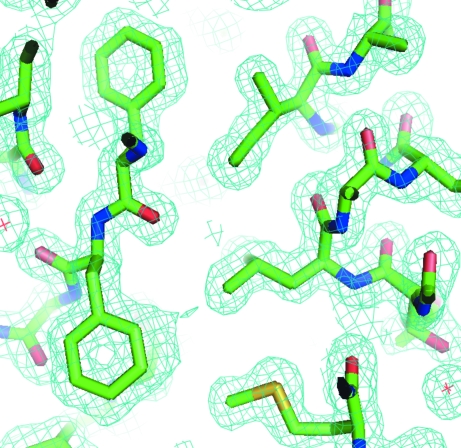
Molecular-replacement calculations were performed using the program BALBES (Long et al., 2008 ▶) and the FASTA sequence for PchD, which yielded no solutions. However, the log file indicated that there was a similar crystal system with the same space group and isomorphous unit-cell parameters in the Protein Data Bank for malate dehydrogenase (PDB code 2pwz). Malate dehydrogenase (MDH) from E. coli has a monomer molecular weight of 32.3 kDa (312 amino acids), the approximate molecular weight of the most significant contaminant in the purification (Fig. 1 ▶ a). Since MDH is a housekeeping gene (part of the citric acid cycle), molecular-replacement calculations were repeated using the FASTA sequence of MDH. This produced a clear solution, placing one dimer in the asymmetric unit. However, the Matthews coefficient (4.9 Å3 Da−1 for one dimer, 2.45 Å3 Da−1 for two dimers) and the incomplete lattice from this solution indicated that a second dimer should be present. This second dimer was easily placed with Phaser (McCoy et al., 2005 ▶). The refinement of the structure was completed, since this is the highest resolution structure of E. coli malate dehydrogenase, and indeed of any malate dehydrogenase, obtained to date. A typical section of electron density can be seen in Fig. 2 ▶.
Figure 2.
Representative 2F o − F c electron-density maps contoured at 1σ. The holes in the aromatic amino acids are readily apparent (Phe263 is pointing up and Phe264 is pointing down) and the difference in the size of the S atoms relative to the C, O and N atoms is also evident (Met295).
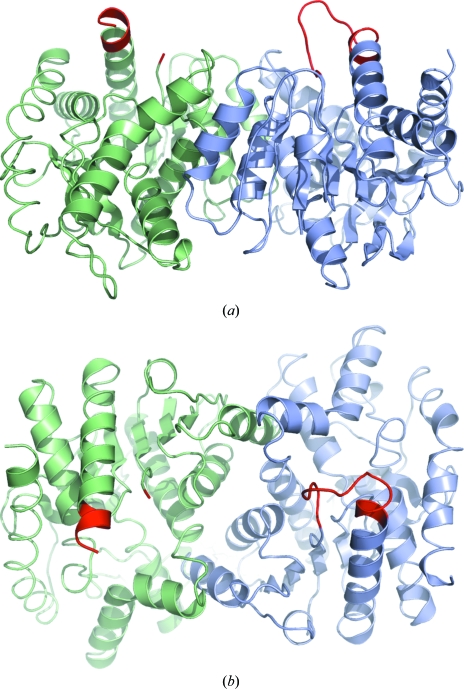
Monomers A and B form one of the two dimers, whereas as the second dimer comprises monomers C and D. The dimer composed of monomers A and B is depicted in two orientations in Fig. 3 ▶, with the active-site loops (residues 79–91) shown in red. In each dimer there is one monomer with a well ordered loop, whereas in the second monomer the active-site loop is disordered. None of the monomers contained NAD(H), which is not surprising since this was not a component of the crystallization system, nor is there an ion in the substrate-binding site.
Figure 3.
Dimeric structure of E. coli malate dehydrogenase. Monomer A is shown in blue and monomer B is shown in green, with the active site loop in red. The second image is rotated 90° about the x axis relative to the first.
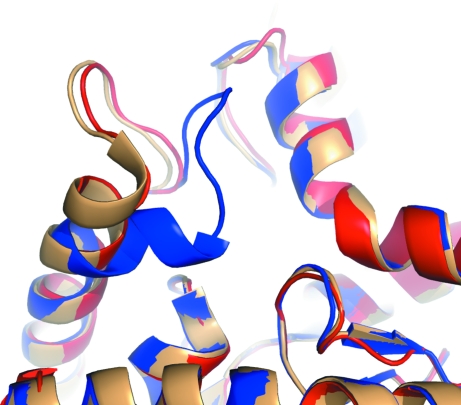
Open and closed active-site E. coli MDH structures have been determined previously and closing of the active site is dependent on the inclusion of an ion (citrate, sulfate etc.) that can serve as a malate analog: if a malate analog is present, this loop closes over the active site and is held in place by ionic interactions with the ion (Bell et al., 2001 ▶; Hall & Banaszak, 1993 ▶; Hall et al., 1992 ▶). Arg81 has previously been hypothesized to be important for the stability and orientation of the substrate for catalysis and also for substrate specificity (Bell et al., 2001 ▶). Superposition of our structure with previously reported structures (PDB entries 1ie3, 1ib6 and 1emd) indicate the expected level of structural similarity. The r.m.s.d. between monomer A compared with the previously determined structure with an open active site (PDB code 1ie3) is 0.55 Å for 312 Cα atoms (the Cα atoms of all amino acids in the protein). A comparison to those with closed active sites (PDB entries 1ib6 and 1emd) shows r.m.s.d. values ranging from 0.62 to 0.65 Å for 304 Cα atoms, with those not accounted for being those of residues 80–87, the active-site loop containing the important Arg81 which changes conformation (Fig. 4 ▶). In the remaining two monomers (B and D) of our structure, the active-site loop is disordered and no electron density is visualized for residues 80–86 (B) or 80–84 (D). The r.m.s.d. for the open structure (1ib6) with monomer B gives an r.m.s.d. of 0.51 Å for 304 Cα atoms, with the disordered amino acids accounting for the Cα atoms not included in the calculation. The structure presented here indicates that there is more mobility in this loop than previously documented.
Figure 4.
Comparison of the malate dehydrogenase active site (red, monomer A) to the previously determined open (tan; PDB entry 1ie3) and closed (blue; PDB entry 1ib6) structures.
Supplementary Material
PDB reference: malate dehydrogenase, 3hhp, r3hhpsf
Acknowledgments
Diffraction data were collected at the Stanford Synchrotron Radiation Laboratory, a national user facility operated by Stanford University on behalf of the US Department of Energy, Office of Basic Energy Sciences. The SSRL Structural Molecular Biology Program is supported by the Department of Energy, Office of Biological and Environmental Research and by the National Institutes of Health, National Center for Research Resources, Biomedical Technology Program and the National Institute of General Medical Sciences. We would like to thank the staff at the Stanford Synchrotron Radiation Laboratory for their support and assistance. Preliminary X-ray diffraction data were collected at the Protein Structure Lab at the University of Kansas. This study was funded by NIH/NCRR COBRE 5P20-RR17780.
References
- Bell, J. K., Yennawar, H. P., Wright, S. K., Thompson, J. R., Viola, R. E. & Banaszak, L. J. (2001). J. Biol. Chem.276, 31156–31162. [DOI] [PubMed]
- Collaborative Computational Project, Number 4 (1994). Acta Cryst. D50, 760–763.
- Conti, E., Stachelhaus, T., Marahiel, M. A. & Brick, P. (1997). EMBO J.16, 4174–4183. [DOI] [PMC free article] [PubMed]
- Emsley, P. & Cowtan, K. (2004). Acta Cryst. D60, 2126–2132. [DOI] [PubMed]
- Hall, M. D. & Banaszak, L. J. (1993). J. Mol. Biol.232, 213–222. [DOI] [PubMed]
- Hall, M. D., Levitt, D. G. & Banaszak, L. J. (1992). J. Mol. Biol. 226, 867–882. [DOI] [PubMed]
- Kleywegt, G. J. & Jones, T. A. (1997). Methods Enzymol.277, 525–545. [DOI] [PubMed]
- Laskowski, R. A., MacArthur, M. W., Moss, D. S. & Thornton, J. M. (1993). J. Appl. Cryst.26, 283–291.
- Long, F., Vagin, A. A., Young, P. & Murshudov, G. N. (2008). Acta Cryst. D64, 125–132. [DOI] [PMC free article] [PubMed]
- May, J. J., Kessler, N., Marahiel, M. A. & Stubbs, M. T. (2002). Proc. Natl Acad. Sci. USA, 99, 12120–12125. [DOI] [PMC free article] [PubMed]
- McAlister-Henn, L., Blaber, M., Bradshaw, R. A. & Nisco, S. J. (1987). Nucleic Acids Res.15, 4993. [DOI] [PMC free article] [PubMed]
- McCoy, A. J., Grosse-Kunstleve, R. W., Storoni, L. C. & Read, R. J. (2005). Acta Cryst. D61, 458–464. [DOI] [PubMed]
- Quadri, L. E., Keating, T. A., Patel, H. M. & Walsh, C. T. (1999). Biochemistry, 38, 14941–14954. [DOI] [PubMed]
- Winn, M. D., Isupov, M. N. & Murshudov, G. N. (2001). Acta Cryst. D57, 122–133. [DOI] [PubMed]
Associated Data
This section collects any data citations, data availability statements, or supplementary materials included in this article.
Supplementary Materials
PDB reference: malate dehydrogenase, 3hhp, r3hhpsf
PDB reference: malate dehydrogenase, 3hhp, r3hhpsf


