

Abstract
Background: Blood pressure (BP) and growth increase at an accelerated rate during puberty. The temporal relationship of the two events has not been well characterized.
Objective: The purpose of this current investigation was to examine the rate of BP change in relation to pubertal growth with the intent to shed light on new mechanisms by which BP is regulated.
Methods: We examined data from a cohort of 182 normotensive children who had measurements made semiannually for up to 12 yr. From the recorded heights, we identified the subject-specific pubertal growth spurt (PGS) using a growth curve model. With the estimated PGS as an anchoring point, we obtained the rates at which BP and weight changed as continuous functions of time for the duration of pubertal growth. Examining BP on a scale relative to PGS placed BP development in the context of pubertal growth.
Results: Average ages at PGS were 11.5 for girls and 13.3 for boys. Fitted spline models estimated that at the time of PGS, the mean systolic BP was 100 mm Hg for girls and 107 mm Hg for boys; the mean diastolic BP at the PGS was 59 mm Hg for girls and 61 mm Hg for boys. The most intriguing observation was that rate of change in systolic BP and weight peaked at precisely the estimated PGS.
Conclusion: The time synchronization of rates of change in BP, weight, and height suggests common regulating mechanisms for somatic growth and BP or growth changes that secondarily affect BP.
Pubertal increases in growth and blood pressure peak at precisely the same age.
Puberty results from a complex series of interacting influences that are driven by increases in production of gonadal hormones. Blood pressure (BP) increases at an accelerated rate during puberty (1,2,3,4), and more so in males than in females (5). After the age of about 1 yr (6), the normal BP increases more during puberty than probably at any other time in an individual’s lifetime. Much the same holds true for growth (7). How closely related BP is to the accelerated growth could provide new insights into BP regulation and the underpinnings for future risk of hypertension. To date, there have been few studies where BP was measured repeatedly during puberty to allow for an accurate quantification of the rate and time pattern of the increase. Although limited data suggest that the BP spurt (maximal rate of change in BP) roughly coincides with growth spurt (maximal rate of change in height) during puberty, the precise timing of the events remains uncertain (8). Nor is it clear as to the rate at which BP increases before and after the pubertal spurt in growth. For children going through puberty, much of the rise in BP is accompanied by an increase in height (9,10). Because at this age, height is a known correlate of BP (11), we examined the change in BP over time within the context of somatic growth. A detailed description of the temporal patterns for increases in BP, weight, and linear growth could shed light on mechanisms influencing both; time synchronization between BP and growth may suggest the existence of shared regulating factors.
The primary focus of the current study was to describe the rate of BP change for the duration of pubertal growth. In doing so, we were able to examine the time synchronization between physical growth (weight and height) and the increase in BP. To the best of our knowledge, the exact time coordination between BP and somatic growth has not been described previously.
Subjects and Methods
Subjects and study design
The study design and data collection process have been previously described (12). Briefly, healthy normotensive white and African-American children were recruited from local schools to participate in a cohort study. Because the primary objective was to describe BP development during pubertal growth, we excluded those who had entered the study after the age of 10 as well as those who had withdrawn before the age of 17. To ensure the fitting of the subject-specific growth curve models, we also excluded subjects who had fewer than 10 measurements of height. The study protocol was approved by a local Institutional Review Board. All participants (or their parents) provided written informed consent.
BP and height measurements
BP and height data were collected semiannually during the course of follow-up. BP was measured in the right arm with a random zero sphygmomanometer while the subject was in a seated position. Three readings were obtained, and the average of the last two readings was used as the final BP measurement. Height and weight were measured as previously described (13).
Identification of pubertal growth spurt (PGS)
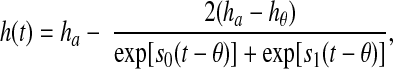
With longitudinally recorded height data, we used the Preece-Baines model to fit subject-specific growth curves (14,15). Pubertal growth spurts, or the point of peak growth velocity, were then identified from the fitted growth curves. Specifically, for a given individual, the model describes the subject’s height at age t, h(t), as follows:
 |
1 |
where s0 and s1 are two rate parameters, ha is the adult height of the subject, θ is the approximate age of PGS, hθ is the subject’s height at age θ. In the current study, we used the last observed height after age 17 as the adult height. Model parameters (θ, hθ, s0, and s1) were estimated using SAS PROC NLMIXED (16). Because the Preece-Baines model is a smooth function, the time of the PGS can be found by maximizing the first derivative of the fitted growth curve. Alternatively, it has been noted that the estimated value of θ can be used as an approximation of the age at which the PGS occurs (15). In this analysis, we used this approximation for computational convenience.
Assessing the rates of BP change and weight increase on the time scale of linear growth
To explore the development of BP and the change in weight in the context of linear growth, we defined a time scale that represents the subject’s age at a specific BP measurement relative to the identified PGS. Specifically, for each measurement, we calculated the difference between the subject’s age at the measurement time and the estimated PGS. Using this time difference as the new time scale, we assessed the BP and weight changes during the pubertal growth process. For convenience, we call this time difference age relative to the PGS, or relative age. The introduction of relative age allowed us to directly examine BP development on the time scale of pubertal growth. For example, the mean systolic BP at relative age of −2 represents the mean systolic BP 2 yr before the PGS.
Plotting the longitudinally measured BP and weight on the relative age time scale, we examined the time patterns of BP development and weight change. Here we modeled the longitudinally measured BP and weight as smooth functions of time using Splus function spline. We then used Splus function predict to obtain the first derivatives of the fitted curves, which represent the rates of BP or weight changes, as functions of time.
Results
Data from a cohort of 182 study subjects were used in this analysis. The mean enrollment age was 8.2 yr (sd = 1.7 yr). On average, the subjects contributed 19 semiannual measurements (sd = 3.9).
Mean PGS ages were 11.3, 11.8, 12.7, and 13.6 yr for African-American girls, white girls, African-American boys, and white boys, respectively. On average, girls reached the PGS earlier than boys (11.5 vs. 13.3 yr; P < 0.0001 per two-sample t test). The difference between African-American and white subjects within each sex group did not reach the level of statistical significance possibly due to the relatively small number of African-American subjects, although point estimates suggested that the African-American subjects tended to reach their PGS slightly earlier than the white subjects.
Smoothing spline estimates for systolic BP (Fig. 1A) showed that at any given age, boys on average had higher BP than girls, and the rise of systolic BP during the pubertal growth period was more salient in boys. At the same age, African-American children tended to have higher BP than white children within each sex group, but on the relative age scale (Fig. 1B), such differences either disappeared or became much reduced, suggesting that the BP difference between African-American and white children seen on the chronological age scale could have been a consequence of an earlier PGS in African-American children. Additionally, BP appeared to increase most rapidly during the 4-yr period surrounding the estimated PGS (Fig. 1B); sexual dimorphism in BP first emerged around the time of PGS. At estimated PGS, boys had noticeably higher mean systolic BP than girls (107.18 vs. 99.2 mm Hg). The bigger separation in systolic BP between boys and girls on the relative age scale might suggest the additive effects of age and growth on BP dimorphism.
Figure 1.

A and B, Smooth spline estimates of mean systolic BP in chronological and relative age scales (WM, white male; WF, white female; BM, black male; BF, black female): A, estimated mean systolic BP curves on the chronological age scale; B, estimated mean systolic BP curves on the scale of age relative to the pubertal growth spurt (PGS). Here the relative age is defined as the difference between the age of a BP observation and the age of the PGS. C and D, Rates of change in systolic BP and height for male and female subjects: C, rates of systolic BP change on the chronological age scale; D, rates of systolic BP change on the relative age scale. D shows that for boys as well as for girls, the peak rates of systolic BP are reached at the time of the estimated pubertal growth spurt (PGS). E, Rates of weight increase on the chronological age scale; F, rates of weight increase on the relative age scale. F shows that for boys as well as for girls, the peak rates of weight increase are reached at the time of the estimated pubertal growth spurt (PGS) and the systolic BP spurt.
We then examined the rate of systolic BP change in boys and girls during the pubertal growth period by taking the derivative of fitted BP curves. We contrasted the rate of BP change on the two different time scales (Fig. 1, C and D). Both plots showed that the rates of systolic BP change were accompanied by more pronounced peaks in boys, explaining the more dramatic systolic increase in boys during the pubertal growth period. We also noted that the peak of BP increase in girls appeared earlier than in boys, although boys were able to reach a much higher rate at a later age (Fig. 1C). The most intriguing observation was that the rate curves for both boys and girls reached their peaks around the time of relative age = 0, i.e. the time of PGS (Fig. 1D). At the PGS, the smoothed estimate of mean systolic BP rate of increase was 3.52 mm Hg/yr in boys and 2.01 mm Hg/yr in girls.
Similar observations were made in the case of weight; the rate at which weight increased peaked precisely at the time of PGS (Fig. 1F). Also observed was the fact that the rate with which boys gained weight at the PGS far exceeded that of girls. At the PGS, the smoothed estimate of the peak rate of weight increase in boys was 7.9 kg/yr, and the smoothed estimate of the peak rate for girls was 4.4 kg/yr.
Discussion
The current study provided the first continuous depiction of the rate of BP change in relation to pubertal growth based on a prospectively followed cohort. The increases in BP and weight were highly synchronized in time with the change of height, which was in keeping with the known association of BP with height in children (17). There were mirroring patterns for peak BP rates of change and growth rates. For boys and for girls, the rates of the increases in systolic BP and weight peaked precisely when linear growth velocity reached its maximum, consistent with the postulate that there exists a common influence behind BP development and somatic growth. The apparent lack of a sex dependency (the pattern was similar in males and females) suggests an influence by something in addition to the increases in gonadal hormones, although interacting with the latter. Somatic growth may be reflective of growth of renal or cardiovascular systems that has been hypothesized as being required for maintaining homeostasis in adulthood and which could also increase BP (4,8). A larger kidney, for example, might raise BP by retaining more sodium.
In summary, we observed a strikingly close relationship between maximally accelerated rates of increase in systolic BP, weight, and height during the period of pubertal growth. The findings give more credence to the hypothesis of an important growth-related influence on BP. Although the emergence of sexual dimorphism of BP during puberty strongly implicates the gonadal hormones, there may be other unrecognized factors or important interactions that affect BP during puberty, thus setting the stage for future levels of BP (18). Puberty could afford a unique opportunity for carrying out studies directed at understanding new influences on BP.
Acknowledgments
We are grateful to Mary Anne Wagner and Beth Deem for coordinating studies and performing careful measurements of subjects and to Dr. Linda A. DiMeglio for providing a helpful review of the paper.
Footnotes
This work was supported by National Institutes of Health Grants RO1-HL35795, RO1-HL095086, and MO1-RR00750 and a Veterans Health Administration Merit Review Grant.
Disclosure Summary: The authors have nothing to disclose.
First Published Online October 22, 2009
Abbreviations: BP, Blood pressure; PGS, pubertal growth spurt.
References
- Harshfield GA, Koelsch DW, Pulliam DA, Alpert BS, Richey PA, Becker JA 1994 Racial differences in the age-related increase in left ventricular mass in youths. Hypertension 24:747–751 [DOI] [PubMed] [Google Scholar]
- Voors AW, Foster TA, Frerichs RR, Webber LS, Berenson GS 1976 Studies of blood pressures in children, ages 5–14 years, in a total biracial community: the Bogalusa heart study. Circulation 54:319–327 [DOI] [PubMed] [Google Scholar]
- Cornoni-Huntley J, Harlan WR, Leaverton PE 1979 Blood pressure in adolescence. The United States Health Examination survey. Hypertension 1:566–571 [DOI] [PubMed] [Google Scholar]
- Lever AF, Harrap SB 1992 Essential hypertension: a disorder of growth with origins in childhood? J Hypertens 10:101–120 [DOI] [PubMed] [Google Scholar]
- Shankar RR, Eckert GJ, Saha C, Tu W, Pratt JH 2005 The change in blood pressure during pubertal growth. J Clin Endocrinol Metab 90:163–167 [DOI] [PubMed] [Google Scholar]
- Tanner JM, Whitehouse RH, Takaishi M 1966 Standards from birth to maturity for height, weight, height velocity, and weight velocity: British children, 1965. II. Arch Dis Child 41:613–635 [DOI] [PMC free article] [PubMed] [Google Scholar]
- U.S. Department of Health and Human Services 2000 CDC Growth Charts for the United States: methods and development. Series Report 11, No. 246. http://www.cdc.gov/GrowthCharts/ [PubMed] [Google Scholar]
- Weder AB, Schork NJ 1994 Adaptation, allometry, and hypertension. Hypertension 24:145–156 [DOI] [PubMed] [Google Scholar]
- Katz SH, Hediger ML, Schall JI, Bowers EJ, Barker WF, Aurand S, Eveleth PB, Gruskin AB, Parks JS 1980 Blood pressure, growth and maturation from childhood through adolescence. Mixed longitudinal analyses of the Philadelphia Blood Pressure Project. Hypertension 2(Pt 2):55–69 [PubMed] [Google Scholar]
- Julius S, Krause L, Schork NJ, Mejia AD, Jones KA, van de Ven C, Johnson EH, Sekkarie MA, Kjeldsen SE, Petrin J 1991 Hyperkinetic borderline hypertension in Tecumseh, Michigan. J Hypertens 9:77–84 [DOI] [PubMed] [Google Scholar]
- Anonymous 1996 Update on the 1987 Task Force Report on High Blood Pressure in Children and Adolescents: a working group report from the National High Blood Pressure Education Program. National High Blood Pressure Education Program Working Group on Hypertension Control in Children and Adolescents. Pediatrics 98:649–658 [PubMed] [Google Scholar]
- Manatunga AK, Jones JJ, Pratt JH 1993 Longitudinal assessment of blood pressures in black and white children. Hypertension 22: 84–89 [DOI] [PubMed] [Google Scholar]
- Pratt JH, Manatunga AK, Wagner MA, Jones JJ, Meaney FJ 1990 Adrenal androgen excretion during the adrenarche. Relation to race and blood pressure. Hypertension 16:462–467 [DOI] [PubMed] [Google Scholar]
- Preece MA, Baines MJ 1978 A new family of mathematical models describing the human growth curve. Ann Hum Biol 5:1–24 [DOI] [PubMed] [Google Scholar]
- Jolicoeur P, Pontier J, Pernin MO, Sempé M 1998 A lifetime asymptotic growth curve for human height. Biometrics 44:995–1003 [PubMed] [Google Scholar]
- Ruppert D, Wand MP, Carroll RJ 2003 Semiparametric regression. Cambridge, UK: Cambridge University Press [Google Scholar]
- 1996 Update on the 1987 Task Force on High Blood Pressure in Children and Adolescents: a Working Group Report from the National High Blood Pressure Education Program. National High Blood Pressure Education Program Working Group on Hypertension Control in Children and Adolescents. Pediatrics 98(4 Pt 1):649–658 [PubMed] [Google Scholar]
- Dasgupta K, O'Loughlin J, Chen S, Karp I, Paradis G, Tremblay J, Hamet P, Pilote L 2006 Emergence of sex differences in prevalence of high systolic blood pressure: analysis of a longitudinal adolescent cohort. Circulation 114:2663–2670 [DOI] [PubMed] [Google Scholar]