

Abstract
The Framingham Heart Study is a well known longitudinal cohort study. In recent years, the community-based Framingham Heart Study has embarked on genome-wide association studies. In this paper, we present a Framingham Heart Study genome-wide analysis for fasting triglycerides trait in the Genetic Analysis Workshop16 Problem 2 using multivariate adaptive splines for the analysis of longitudinal data (MASAL). With MASAL, we are able to perform analysis of genome-wide data with longitudinal phenotypes and covariates, making it possible to identify genes, gene-gene, and gene-environment (including time) interactions associated with the trait of interest. We conducted a permutation test to assess the associations between MASAL selected markers and triglycerides trait and report significant gene-gene and gene-environment interaction effects on the trait of interest.
Background
Current advances in genotyping technologies, such as the Affymetrix 500 k GeneChip, make genome-wide association studies (GWAS) feasible for identifying common variants that underlie complex traits. Some of the recent genetic variants discovered by GWAS include age-related macular degeneration (AMD) [1,2], inflammatory bowel disease [3], and electrocardio-graphic QT interval [4]. Data from the 500 k genome-wide scan of the Framingham Heart Study (FHS) is available for use in the Genetic Analysis Workshop (GAW) 16. The FHS, a community-based cohort study initiated in 1948, aims to identify cardiovascular disease risk factors. FHS provides a collection of data from three generation families who had been followed up every 2 or 4 years over time. This longitudinal feature poses methodological challenges. Applying an efficient approach to analyzing the FHS longitudinal data may help in discovering new genetic variants in GWAS.
Previously, several approaches [5,6] were proposed to analyze the FHS 100 k data set; however, most of these did not directly deal with longitudinal data. These methods require the longitudinal measures to be summarized into one time-point trait by taking the average of several measures or by using the family-based association test (FBAT) principal-components method [6]. It is inevitable that there may be some loss of information by using the summary trait values [7]. Furthermore, when applying the adjustment of FBAT-principal-components method in GWAS, it is difficult to include environment factors such as sex and age.
In our study, we use the multivariate adaptive splines for analysis of longitudinal data (MASAL) presented by Zhang [8] to analyze the FHS longitudinal data. MASAL is a nonparametric regression approach that was developed specifically to handle longitudinal data. MASAL not only accommodates time-varying covariates, but also allows interactions between gene and environmental factors and between time and covariates [9]. Here we demonstrate and apply MASAL to identify genes, gene-gene, and gene-environment interactions in relation to the trait triglyceride (TG) level in GWAS using FHS data in GAW16 Problem 2.
Methods
MASAL
We present a brief review of MASAL and refer to Zhang [8,10] for the details. Let yij, tij, and xk, ij denote the response variable, time-dependent covariate, and kth non-time-dependent-covariates (including both genetic and environmental covariates) for the ith subject at the jth exam, where j = 1, ..., T, i = 1, ..., n, k = 1, ..., p; n is the number of study subjects and Ti is the number of exams for the ith subject. In MASAL, we consider the following nonparametric model:
where f is an unknown smooth function and εij is the error term.
Based on a set of observations, MASAL selects a model using a forward step from the following class of functions:
where βm is the regression coefficient and Bm(x) is a special basis function of the p + 1 covariates x = (x1, ..., xp+1) (m = 1, ..., M), and M is the number of terms. Specifically, Bm(x) is either one of (xk - τ)+ and xk or their product (k = 1, ..., p + 1), and a+ = max(a,0) for any number a and τ is called a knot.
In the forward step, terms are added to minimize the (weighted) sum of squared residuals:  , where
  and
and  is the predicted value of yi, and Wi is the within-subject covariance matrix for
  , i = 1, ..., n. After the forward step, all knots are found and each corresponding basis function will be treated as if it is a given predictor. In the backward step, based on generalized cross-validation (GCV), we delete one least significant term from the large model at a time. The final model we select is the one that yields the smallest
  , where WLSl is the WLS of a reduced model with l terms and λ (usually λ = 4 [10,11]) is the penalizing parameter for model complexity.
GWA analyses with MASAL
In GWAS, we use MASAL to establish the relationship between a trait of interest and genomic markers as well as other non-genetic covariates. MASAL starts with a model that contains only the intercept a α, and it grows the model by adding terms that minimize the WLS in the forward step, and then it selects a final model by deleting one least significant term at a time in the backward step. In general, the final MASAL model is
where  represents terms containing any genetic component (i.e., single-nucleotide polymorphism (SNP), SNP-SNP interaction, or SNP-covariate interaction),
  refers to non-genetic covariate terms, and
  ,
,  is the estimate of the corresponding regression coefficients.
To access associations between the selected SNPs and the trait of interest, we define a Wald statistic to test whether β = 0, where β = (β1, ..., βk)'. The Wald statistic can be written as
where  , and
, and  is the estimated covariance matrix of
  . We use a permutation procedure to establish the null distribution of W The permutation test is done by randomly assigning the phenotype while keeping the set of genotypes intact for each individual and then performing the GWA analysis using MASAL. It is noteworthy that non-genetic covariates go together with the phenotype.
Study design
We perform GWA analyses of TG trait with MASAL. We consider the genotype at every SNP as a covariate in the model in addition to sex and age variables. MASAL has the option of setting the maximum order of interactions in the model. We set it to three in our analyses because it is difficult to interpret interactions higher than the third order. We first use MASAL to perform GWA analyses in the Offspring Cohort, in which the repeated TG values and the familial correlations are properly accounted for in the analysis. Next, we perform GWA analyses with MASAL in the Original Cohort in which the subjects are considered to be independent, whereas the longitudinal trait values are considered to be correlated. Then, we examine significant SNPs, SNP-SNP, and SNP-covariate interactions in the two generation data sets analyzed and compare the level of concordance of significant associations in the two samples.
In the Offspring Cohort, some pedigrees have more than 100 subjects, which cannot be treated as independent individuals. These families with repeated traits induce a large covariance matrix in MASAL and thus markedly limit its efficiency. Therefore, in the analyses of Offspring Cohort, we split all pedigrees into sibship units according to the information from the Original Cohort. We obtained 1,767 sibship units, for which each sibship unit consists of one set of siblings and their spouses from each nuclear family. All subjects included in our study have all TG trait values (Exams 1, 3, 5, and 7) and genotypes. In the Original Cohort, we used 146 individuals who have all TG trait values (Exams 7 and 11) and genotypes. All of these subjects were genotyped for 488,146 SNPs.
Results and discussion
We applied MASAL to analyze the FHS 500 k SNP data set (GAW 16 Problem 2). Before the analysis, TG level values were log-transformed to approximate a normal distribution, although there is no such limitation when using MASAL. Furthermore, in order to minimize false-positive associations due to rarer SNPs and genotyping artifact, we limited our analyses to SNPs with minor allele frequency ≥ 10% and the p-value for testing Hardy-Weinberg equilibrium <0.001. Thus, there were a total of 294,434 SNPs remaining in our analysis.
In the analyses of Offspring Cohort, the fitted model given by MASAL is
where t is the age of exam, s is the indicator for sex, and  is the genotype of the SNP rs number in the cth chromosome. The value of corresponding Wald statistic is 325.73. Similarly, for the analyses of original cohort, the fitted model given by MASAL is
and the value of the corresponding Wald statistic is 359.575.
We attempted to establish the null distributions of the two Wald statistics by using a permutation procedure and calculating the p-values of the two tests. However, the permutation study based on the entire genome is extremely time-consuming. Thus, instead of using the entire genome, we randomly selected a series of subsets of SNPs in 500 increments (e.g., 500, 1000, 1500, ..., 10,000 SNPs) of 500 k SNPs to characterize the pattern of the empirical distribution of W. Based on each subset, we used the above permutation procedure to establish the empirical distribution of Wand calculated 93%, 95%, 97%, and 99% quantiles. In Figure 1, we illustrate the trends of the four quantiles showing the increase in the number of selected SNPs for the Offspring Cohort. The trends of these quantiles for the Original Cohort are similar, so we omitted them in Figure 1 due to the limited space. These results indicate a convergence when the number of selected SNPs is more than 7,000. As a result, we established the null distributions of W based on 10,000 randomly selected SNPs.
Figure 1.
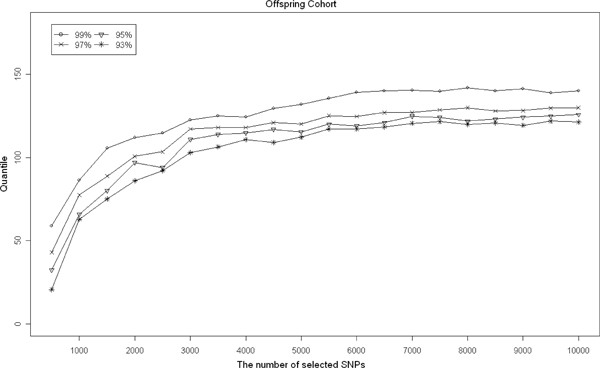
The trends of the quantiles (93%, 95%, 97%, and 99%) with the increase of the number of selected SNPs based on the Offspring Cohort. The vertical axis represents the value of the quantile and the horizontal axis represents the number of selected SNPs in each permutation study.
The adjusted p-value of the Offspring Cohort based association test is less than 0.001, which suggests strong associations between the SNPs selected by the final model and TG trait. In contrast, the adjusted p-value of the Original Cohort based association test is 0.056, which indicates marginally significant associations between the selected SNPs and TG trait. Our results confirm that MASAL can properly take account of the familial correlations in the GWA analysis. MASAL identified 13 significant SNPs for the Offspring Cohort and 6 SNPs for the Original Cohort. Table 1 lists the significant SNPs selected by MASAL, their chromosomal positions, and the nearest gene(s). Although significant associations identified in the two samples do not overlap, the two fitted models exhibit SNP-SNP and SNP-environment interactions. It is not entirely surprising that there is no overlap among the significant SNPs between the two cohorts because for example, the characteristics such as age in the two cohorts are different. It is known that there is a steady increase of TG levels with age [12]. Furthermore, the two MASAL models include the age or SNP-age interaction terms, confirming the age effect. Kooner et al. [12] reported an association between MLXIPL on chromosome 7 and TG; and Kathiresan et al. [13] found five loci on chromosomes 1, 7 (TBL2 and MLXIPL) 8, and 19 to be associated with TG. Our models do not include SNPs in those regions. Further investigation is warranted to confirm our findings. Although MASAL is a unique approach to accommodating correlated phenotypes in genetic studies, its potential has not been fully explored. It is beyond the scope of this short article to compare MASAL with other methods, but it is a highly worthy effort to thorough study the utility of MASAL for longitudinal genetic data.
Table 1.
Significant SNPs selected by MASAL
| Data set | SNP | Locus | Nearest gene(s) |
|---|---|---|---|
| Offspring Cohort | rs4367528 | 8q12 | RLBP1L1 |
| rs16860145 | 3q13.2 | CD200R2 | |
| rs4074863 | 10q26 | FLJ46300, TCERG1L | |
| rs9828013 | 3p25 | WNT7A | |
| rs41442345 | 4q23 | BANK1 | |
| rs11150610 | 16p11.2 | ITGAM | |
| rs5015152 | 3q26.3 | NLGN1 | |
| rs17117113 | 5q33 | KIF4B | |
| rs1361536 | 9q21 | KRT18P24, CHCHD9 | |
| rs17630545 | 8q23 | CSMD3 | |
| rs7204454 | 16q23 | CDH13 | |
| rs1321130 | 1q42 | FAM89A, FLJ30430 | |
| rs2514930 | 11q21 | NAALAD2 | |
| Original Cohort | rs6835031 | 4q22 | TIGD2 |
| rs4984982 | 16p13.3 | LMF1 | |
| rs16995794 | 20q13.2 | RPSAP1 | |
| rs17783132 | 14q24 | BATF | |
| rs11688196 | 2p23 | TRNAL-AAG | |
| rs9643584 | 8q13 | CPA6 |
Conclusion
In this report, we proposed a testing procedure to perform GWAS for longitudinal data, using a nonparametric regression method (MASAL) presented by Zhang [8]. In contrast to other GWA methods, our testing procedure has two novel features. First, it can handle longitudinal data without combining longitudinal measures into a one-time-point measure in GWAS. Second, it can accommodate gene-gene, gene-environment, and time-covariate interactions in GWAS. Using MASAL, we analyzed the FHS 500 k genotype data (GAW 16 Problem 2) using TG as the trait of interest and found some significant gene-gene and gene-environment interaction effects on TG trait. These results indicated that MASAL is useful for exploring gene-gene and gene-environment interactions in the GWAS of longitudinal data.
We used a permutation procedure to establish the null distribution of the Wald statistic and then estimated the significance level. However, the computation time was lengthy, especially for the large pedigree and large number of exams of each subject. Theoretical studies exploring the asymptotic distribution of the involved statistic would be useful.
List of abbreviations used
AMD: Age-related macular degeneration; FBAT: Family-based association test; FHS: Framingham Heart Study; GAW: Genetic Analysis Workshop; GCV: Generalized cross-validation; GWAS: Genome-wide association studies; MASAL: Multivariate adaptive splines for the analysis of longitudinal data; SNP: Single-nucleotide polymorphism; TG: Triglyceride.
Competing interests
The authors declare that they have no competing interests.
Authors' contributions
WZ and HZ designed the study and carried out the data analysis. WZ, KC, and HZ drafted the manuscript. KC, XC, MZ, and MW participated in data analysis.
All authors read and approved the final manuscript.
Contributor Information
Wensheng Zhu, Email: wen-sheng.zhu@yale.edu.
Kelly Cho, Email: kelly.cho@yale.edu.
Xiang Chen, Email: xiang.chen@yale.edu.
Meizhuo Zhang, Email: meizhuo.zhang@yale.edu.
Minghui Wang, Email: minghui.wang@yale.edu.
Heping Zhang, Email: heping.zhang@yale.edu.
Acknowledgements
This research is supported in part by grants K02DA017713, R01DA016750, and T32 MH014235 from the National Institutes of Health. The Framingham Heart Study project is conducted and supported by the National Heart, Lung, and Blood Institute (NHLBI) in collaboration with Boston University (N01 HC25195). The Genetic Analysis Workshop is supported by NIH grant R01 GM031575 from the National Institute of General Medical Sciences. The simulated data was supported by the Washington University Institute of Clinical and Translational Sciences, NIH grant 1U54RR023496. The GAW16 Framingham and simulated data used for the analyses described in this manuscript were obtained through dbGaP (accession numbers). The authors acknowledge the investigators that contributed the phenotype, genotype, and simulated data for this study. This manuscript was not prepared in collaboration with investigators of the Framingham Heart Study and does not necessarily reflect the opinions or views of the Framingham Heart Study, Boston University, or the NHLBI.
This article has been published as part of BMC Proceedings Volume 3 Supplement 7, 2009: Genetic Analysis Workshop 16. The full contents of the supplement are available online at http://www.biomedcentral.com/1753-6561/3?issue=S7.
References
- Klein RJ, Zeiss C, Chew EY, Tsai JY, Sackler RS, Haynes C, Henning AK, SanGiovanni JP, Mane SM, Mayne ST, Bracken MB, Ferris FL, Ott J, Barnstable C, Hoh J. Complement factor H polymorphism in age-related macular degeneration. Science. 2005;308:385–389. doi: 10.1126/science.1109557. [DOI] [PMC free article] [PubMed] [Google Scholar]
- Chen X, Liu CT, Zhang MZ, Zhang HP. A forest-based approach to identifying gene and gene-gene interactions. Proc Natl Acad Sci USA. 2007;104:19199–19203. doi: 10.1073/pnas.0709868104. [DOI] [PMC free article] [PubMed] [Google Scholar]
- Duerr RH, Taylor KD, Brant SR, Rioux JD, Silverberg MS, Daly MJ, Steinhart AH, Abraham C, Regueiro M, Griffiths A, Dassopoulos T, Bitton A, Yang H, Targan S, Datta LW, Kistner EO, Schumm LP, Lee AT, Gregersen PK, Barmada MM, Rotter JI, Nicolae DL, Cho JH. A genome-wide association study identifies IL23R as an inflammatory bowel disease gene. Science. 2006;314:1461–1463. doi: 10.1126/science.1135245. [DOI] [PMC free article] [PubMed] [Google Scholar]
- Arking DE, Pfeufer A, Post W, Kao WH, Newton-Cheh C, Ikeda M, West K, Kashuk C, Akyol M, Perz S, Jalilzadeh S, Illig T, Gieger C, Guo CY, Larson MG, Wichmann HE, Marbán E, O'Donnell CJ, Hirschhorn JN, Kääb S, Spooner PM, Meitinger T, Chakravarti A. A common genetic variant in the NOS1 regulator NOS1AP modulates cardiac repolarization. Nat Genet. 2006;38:644–651. doi: 10.1038/ng1790. [DOI] [PubMed] [Google Scholar]
- Kathiresan S, Manning AK, Demissie S, D'Agostino RB, Surti A, Guiducci C, Gianniny L, Burtt NP, Melander O, Orho-Melander M, Arnett DK, Peloso GM, Ordovas JM, Cupples LA. A genome-wide association study for blood lipid phenotypes in the Framingham Heart Study. BMC Med Genet. 2007;8(suppl 1):S17. doi: 10.1186/1471-2350-8-S1-S17. [DOI] [PMC free article] [PubMed] [Google Scholar]
- Ionita-Laza I, McQueen MB, Laird NM, Lang C. Genomewide weighted hypothesis testing in family-based association studies, with an application to a 100 K scan. Am J Hum Genet. 2007;81:607–614. doi: 10.1086/519748. [DOI] [PMC free article] [PubMed] [Google Scholar]
- Zhang HP, Zhong X. Linkage analysis of longitudinal data and design consideration. BMC Genet. 2006;7:37. doi: 10.1186/1471-2156-7-37. [DOI] [PMC free article] [PubMed] [Google Scholar]
- Zhang HP. Multivariate adaptive splines for analysis of longitudinal data. J Comput Graph Stat. 1997;6:74–91. doi: 10.2307/1390725. [DOI] [Google Scholar]
- Zhang HP. Mixed effects multivariate adaptive splines model for the analysis of longitudinal and growth curve data. Stat Methods Med Res. 2004;13:63–82. doi: 10.1191/0962280204sm353ra. [DOI] [PubMed] [Google Scholar]
- Zhang HP. Analysis of infant growth curves using multivariate adaptive splines. Biometrics. 1999;55:452–459. doi: 10.1111/j.0006-341X.1999.00452.x. [DOI] [PubMed] [Google Scholar]
- Friedman JH. Multivariate adaptive regression splines. Ann Stat. 1991;19:1–141. doi: 10.1214/aos/1176347963. [DOI] [PubMed] [Google Scholar]
- Castelli WP. Epidemiology of triglycerides: a view from Framingham. Am J Cardiol. 1992;70:3H–9H. doi: 10.1016/0002-9149(92)91083-G. [DOI] [PubMed] [Google Scholar]
- Kooner JS, Chambers JC, Aguilar-Salinas CA, Hinds DA, Hyde CL, Warnes GR, Gómez Pérez FJ, Frazer KA, Elliott P, Scott J, Milos PM, Cox DR, Thompson JF. Genome-wide scan identifies variation in MLXIPL associated with plasma triglycerides. Nat Genet. 2008;40:149–151. doi: 10.1038/ng.2007.61. [DOI] [PubMed] [Google Scholar]
- Kathiresan S, Melander O, Guiducci C, Surti A, Burtt NP, Rieder MJ, Cooper GM, Roos C, Voight BF, Havulinna AS, Wahlstrand B, Hedner T, Corella D, Tai ES, Ordovas JM, Berglund G, Vartiainen E, Jousilahti P, Hedblad B, Taskinen MR, Newton-Cheh C, Salomaa V, Peltonen L, Groop L, Altshuler DM, Orho-Melander M. Six new loci associated with blood low-density lipoprotein cholesterol, high-density lipoprotein cholesterol or triglycerides in humans. Nat Genet. 2008;40:189–197. doi: 10.1038/ng.75. [DOI] [PMC free article] [PubMed] [Google Scholar]