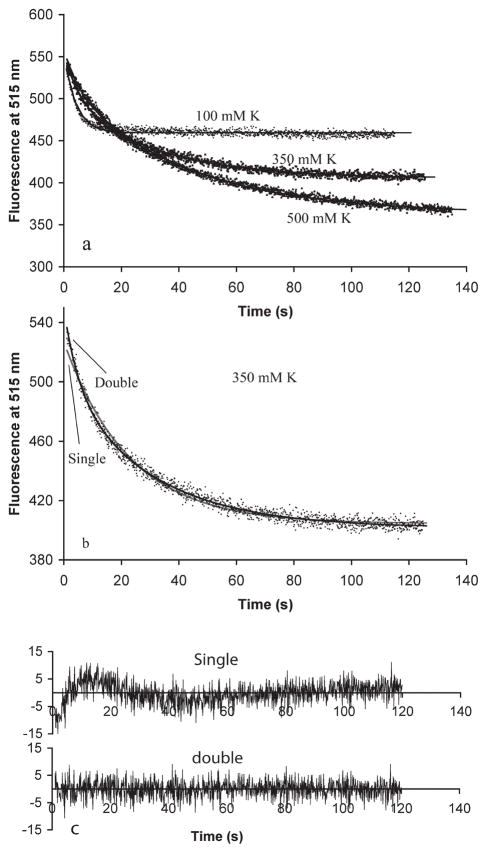
Figure 2.
(a) Subunit exchange following mixing of 10 μM donor and 10 μM acceptor filaments preassembled with 1 mM GTP in 100 mM KAc, 350 mM KAc, or 500 mM KAc buffer (pH 7.7). Exchange is measured by the decrease in donor fluorescence. The curves show the best fit for a single- or double-exponential decay, (b and c) A double-exponential decay gives a better fit for exchange in 350 mM K. The data and fitting curves are shown in panel b and the residuals of the fit in panel c.

