Abstract
We applied mode-decomposition and matched-filtering, both signal processing techniques used to increase the signal-to-noise ratio (SNR), to array CGH data of human meningioma DNA, in order to extract genomic regions of copy-number changes potentially associated with tumor progression. DNA segments from different chromosomes were decomposed into a small number of dominant components (modes), and low-amplitude modes were eliminated. The SNR of the entire segment was increased and it was possible to identify local changes in the data spatial structure, previously indistinguishable due to noise. We applied matched-filtering to the mode-reduced signals, using a normal DNA sequences (averaged over 50 healthy donors) as the template. The residual signals from this process were analyzed to identify disease-related copy number changes. We were able to identify distinct local changes at different chromosomes in patients with recurrent versus primary meningiomas.
I. INTRODUCTION
DNA allelic copy-number variations (CNVs) occur as part of the heterogeneity of normal human genetic variability [14]. However, copy number changes have also been implicated in a wide range of diseases, including tumorigenesis and cancer progression [3][10][13][17]. Characterization of these genetic changes is important for identifying genes involved in cancer progression, as well as for diagnostic purposes and for predicting a patient’s response to treatment.
Array Comparative Genome Hybridization (array CGH) is a high-resolution technology which allows quantitative measurements of relative copy number changes and their mapping onto genome sequences. Chromosomal copy numbers are not directly measurable, so array CGH uses a reference and test DNA sequences, differentially labeled with fluorescent dyes, and hybridized onto an array. The log-ratio of the two fluorescence intensities is then computed and represents the relative copy number between the two hybridized sequences at each sampled locus. However, given the significant heterogeneity of genomic profiles, impurity of the reference sequence, and other biological and experimental factors, the resulting data are noisy and may require substantial pre-processing, including artifact removal and normalization by some data statistic. Nevertheless, array CGH provides high resolution and genomic-scale information on copy number variation and is thus a powerful tool.
Analysis methods of array CGH data include examination of single markers, without accounting for the spatial correlation of neighboring markers [7], segmentation methods and/or Hidden Markov models which are used to identify correlated DNA regions of interest, locations of copy number transitions, and segments of loss or gain [6]. In general, these analysis methods fall into two categories: supervised and unsupervised. Supervised approaches require a a priori specification of copy number events, i.e, gain, loss or no change and target DNA locations of interest. Unsupervised approaches do not rely on such information and are thus appropriate for discovering novel genomic changes associated with disease. Application of signal processing techniques to array CGH data is limited. Yet, these methods are typically unsupervised and naturally account of correlations between neighboring time points, which in the context of array CGH data correspond to spatial correlations between loci.
In this study we applied matched-filtering to array CGH data from patients with primary and recurrent atypical meningiomas, to identify chromosomal regions of significant copy number changes. We first explored the presence of a genome-wide, wave-like artifact in the data, first reported by [6] but consistently identified and extracted in [12]. We applied a mode-decomposition method [8][16] to extract dominant signal modes and remove low-amplitude components with insignificant contributions to the signal. As a result, the signal-to-noise ratio increased significantly across the entire segments of interest. Matched-filtering, which is widely used in pattern recognition, sonar and communications, to extract a known signal (the template) from an observed signal corrupted by noise, was then applied to the mode-reduced data, to identify DNA regions of copy number changes. Template sequences were synthesized from DNA of healthy subjects. Sequences from meningioma DNA were treated as the observed noisy signals.
II. METHODS
A. Array CGH Data
Array CGH data of DNA from primary and recurrent atypical meningiomas, World Health Organization grade II, from 65 patients (35 males and 30 females) were obtained by hybridizing tumor and normal DNA probes on the Agilent Human Genome CGH MicroArray 105. Two reference sequences (male and female) were used in the hybridization. The array has approximately 99,000 probes and average resolution of 15 kb. Reference DNA was obtained from 10 healthy donors to avoid inclusion of polymorphisms. Normal and tumor probes were labeled with fluorescent dyes Cy3 and Cy5, respectively. Following hybridization, the log2 fluorescence intensity ratios (Cy5 to Cy3 fluorescence) were computed. To obtain a robust normal DNA sequence as a template signal, and also assess the inter-sequence variability among healthy donors, we also analyzed 48 normal sequences obtained from The Cancer Genome Atlas(TCGA) [1]. These data were generated using the Agilent Human Genome CGH Microarray 244A, which has approximately 236,000 probes and average resolution of 6.4 kb. In order for the two data sets to be comparable, we down-sampled the TCGA data to the same number of probes as the meningioma array CGH data. All normal sequences where averaged to obtain the template signal.
B. Matched Filtering
Matched filtering is a theoretically optimum detection method for extracting a signal of known waveform from an observed, contaminated by noise signal. If the noise spectrum is white, the matched filter is the time-reversed signal [18]. The filtering operation involves the convolution of the known (template) signal with the unknown signal in order to extract the template from it [2]. Matched-filtering is extensively used in communications, sonar and pattern recognition applications. The matched filter h(t) maximizes the SNR and thus improves the detection of a known signal. It is a waveform-or pattern-specific filter rather than a frequency band-specific filter. The method involves convolving an observed signal y(t) with the filter h(−t) to obtain the matched-filtered signal yMF(t), i.e.,
| (1) |
This process corresponds to signal cross-correlation, which, however, does not involve time-reversal. In this study we used one normal DNA sequence as the template, obtained by averaging over 50 normal sequences, and matched-filtered the meningioma sequences with this template. The signal of interest was the residual from this process, as the matched-filtered signal represents the best match between template and observed data, i.e, increases the SNR in regions where the DNA sequences were normal. Instead we were interested to eliminate these and extract the abnormal residual signal.
C. Mode Decomposition
A time series may be decomposed into a theoretically infinite number of components (modes), which are nevertheless bounded by the sampling frequency. Not all modes contribute equally to the signal. Fourier decomposition of a signal assumes stationarity and sine or cosine mode shapes. Signals are, however, often non-stationary and their mode shapes significantly deviate from sine or cosine functions. In the context of array CGH data, copy-number variation is a non-stationary process. Changes in a cluster of spatially correlated markers corresponds to a high-frequency signal, whereas spatially sparse copy-number variation corresponds to a low-frequency signal. In order to identify the potential contribution of a previously reported wave-like artifact in the array CGH data, we applied a modified mode decomposition technique [16], based on the original Empirical Mode Decomposition (EMD) [8], which does not assume stationarity. Instead, any signal consists of a set of intrinsic mode functions (IMF) which can be sequentially extracted through a sifting process. The local extrema of the signal are first identified and fitted with a cubic spline, to obtain the first IMF c1. The latter is subtracted from the original signal, and the process is repeated until the the variance of the residual signal is very small. The process stops when the normalized squared difference between two successive sifting operations is small, based on an a priori set threshold for σk, where:
| (2) |
All IMFs were examined to ensure that they were zero-mean. The original method was modified to account for potential modal amplitude instabilities at the endpoints [16].
III. Array CGH DATA ANALYSIS
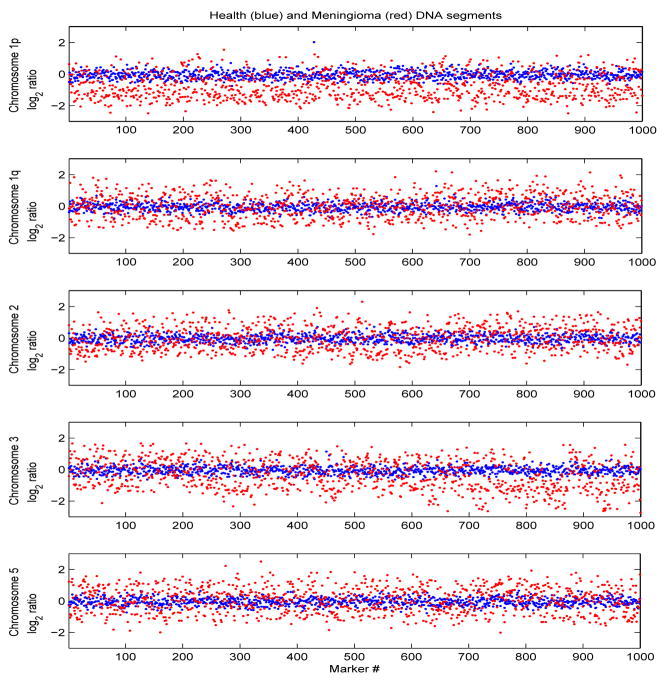
An example of array CGH data, from the reference sequence and one patient with meningioma, respectively are superimposed in Figure 1. The segments are along chromosome arms 1p and 1q, chromosomes 2, 3 and 5. CNVs in these chromosomes have been implicated in progression of brain cancers. Specifically, chromosome arm 1p has been associated with copy number loss and chromosomes 2, 3, 5 and arm 1q with copy number gain [10][17].
Fig. 1.
DNA segments along chromosomes 2, 3, 5 and arms 1p and 1q, from the averaged normal sequence (blue) and from a patient with meningioma(red).
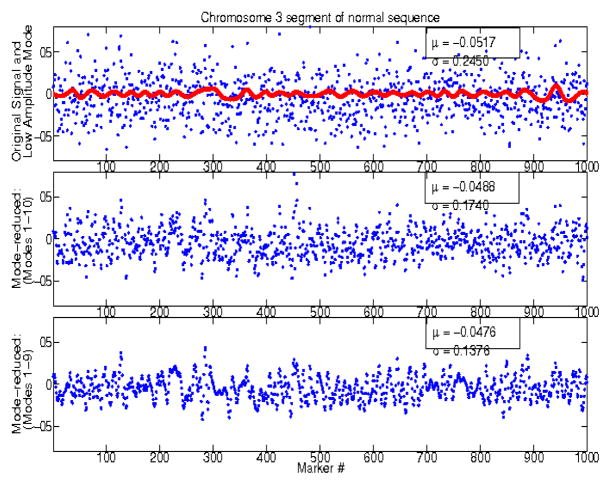
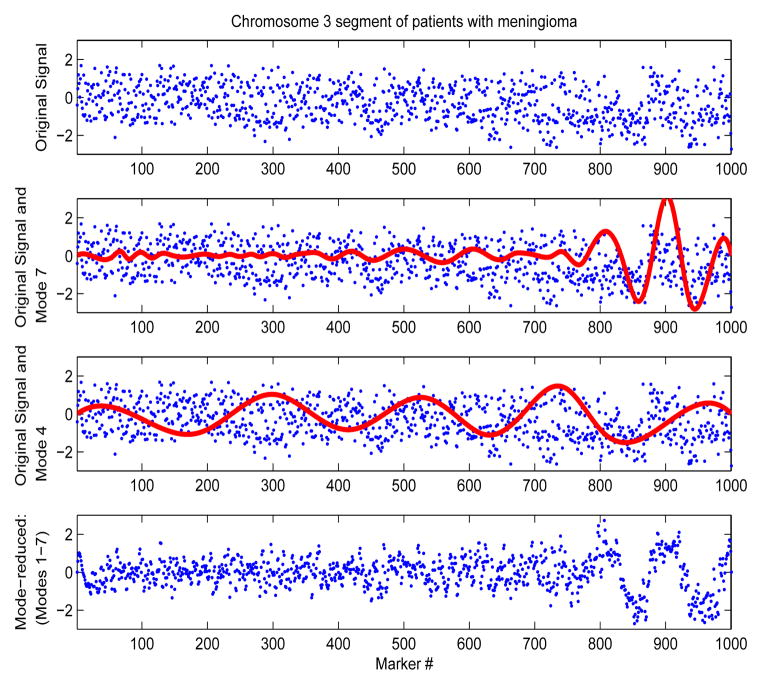
We investigated the ‘low-amplitude’, wave-like artifact identified in [12], using modified empirical mode decomposition, to increase the data SNR. Figures 2 and 3 show examples of original and mode-reduced segments along chromosome 3 of the normal sequence and of one cancer patient, respectively. Signals were decomposed into a small set of components (typically less than 20). Usually, the physics of the system guides the choice of modes that are subsequently chosen. Here, small modal amplitude is the only available other criterion for eliminating modes. Figure 2 shows the effect of progressively eliminating higher order/frequency modes from the normal sequence, resulting in progressively smaller variances. Figure 3 shows the effect of eliminating low-amplitude modes from the meningioma sequences. Thus, this method is adequate for increasing the SNR both in regions of large copy-number gains and losses, and in regions of small copy-number variability, as in the case of normal sequences.
Fig. 2.
DNA segments along chromosomes 3, from the normal sequence. A low amplitude mode is superimposed to the original segment (top). Mode-reduced signals are shown in the middle and bottom plots.
Fig. 3.
DNA segments along chromosomes 3, from a sequence of one patient with meningioma. High and low-amplitude modes are superimposed to the original signal. The mode-reduced signal is shown in the bottom plot.
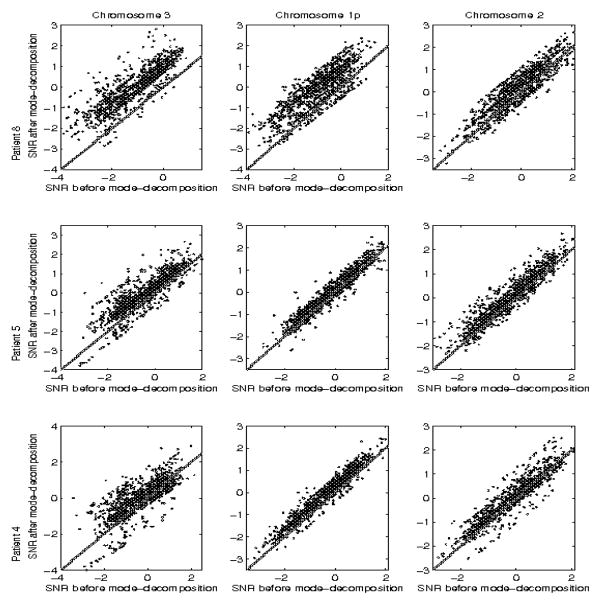
Higher order modes and/or low-amplitude modes were eliminated based on their contribution to the SNR of the sequence, i.e, modes were included as long as the resulting SNR was at or above a threshold, here set to 3 ( ). Sequences were re-synthesized by superimposing only the selected modes. The local structure of the data was more clearly distinguishable in the mode-reduced signals, e.g, in Figure 3 between markers 800–1000. Simultaneously, noise levels were reduced in the first 800 markers, revealing a more heterogeneous data structure than that of the original sequence. We computed the SNR of the data by normalizing them by the standard deviation of the entire chromosomal segment, both pre- and post-mode decomposition, for all patients and chromosomes. Figure 4 compares the two SNR values, for each marker along the segment, for 3 different patients and segments along chromosomes 3, 1, and 2.
Fig. 4.
Comparison of SNR before and after mode decomposition and elimination of low-amplitude modes. Columns correspond to chromosomes, rows to patients.
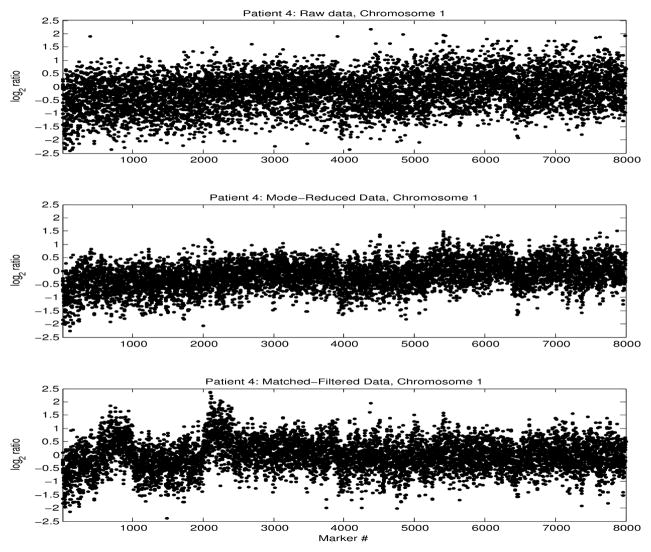
Mode-decomposition and signal re-synthesis based on the reduced number of modes, resulted in higher SNR. Prior to matched-filtering, all data were, therefore, mode-reduced. Filtering was performed using a sliding window of 100 data points (markers), corresponding to DNA segments of length > 1–2 Mb. The effect of window length on the resulting matched-filtered signal was found to be insignificant. The filtered signals were subtracted from the original sequences, and residual signals were further examined for copy number changes, as they represented the copy number deviations from normal CNVs, possibly due to cancer progression. Figure 5 shows the raw (top), mode-reduced (middle) and residual (bottom) signals, for one patient with meningioma.
Fig. 5.
log2 ratios along chromosome 1, of one patient with meningioma. Raw data (top), mode-reduced (middle) and residual (bottom).
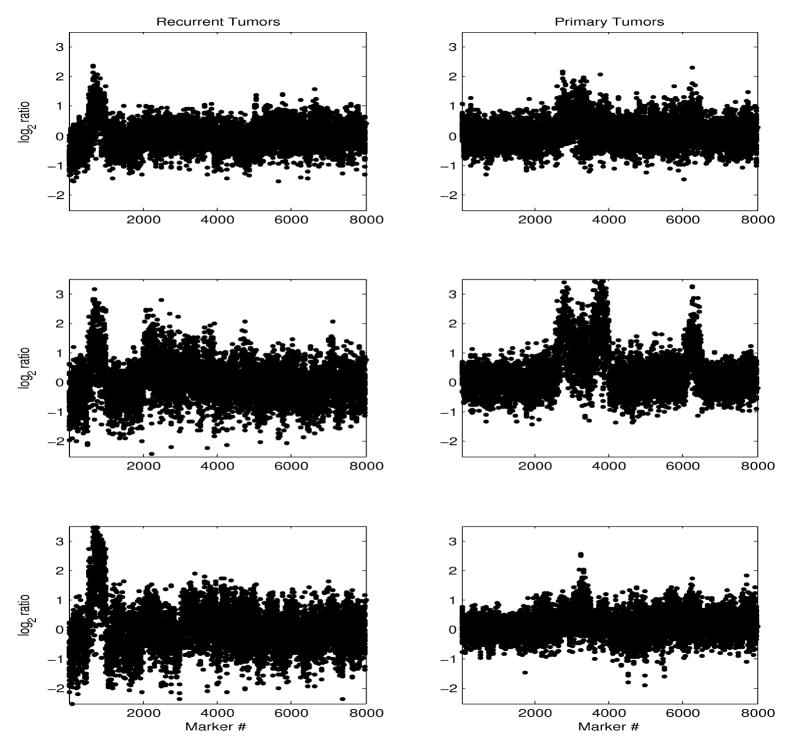
There is a clear noise level reduction in the mode-reduced signal. However, although the general trends of copy number loss in the p arm of chromosome 1 and gain in the q arm are distinguishable even in the raw and mode-reduced signals, it is difficult to identify local copy number changes in these signals. In contrast, the SNR increased locally in the matched-filtered data, reflecting regions of significant relative copy-number changes in comparison to the normal DNA sequence. We examined data from patients with recurrent and primary tumors separately, to identify tumor-type specific copy-number changes. Figure 6 shows an example of the matched-filter chromosome 1 sequence, of 6 patients (3 with recurrent and 3 with primary tumors). For patients with recurrent tumors there were consistent local regions of copy number gain in arm 1p, followed regions of copy number loss, not distinguishable in the raw data. In some patients with primary tumors, a specific gain at the end of arm 1p was also seen, but those data were more heterogeneous.
Fig. 6.
log2 ratios along chromosome 1, of patients with recurrent tumors (left column), and primary tumors (right column), respectively.
IV. DISCUSSION
We have presented preliminary results from the analysis of array CGH data of primary and recurrent human meningiomas, using mode-decomposition, followed by matched- filtering, to increase the SNR of the data, and identify specific chromosomal regions where copy number changes occur, possibly as a result of tumor progression. We have shown that, reducing the number of signal components through mode decomposition increased SNR. Matched-filtering, used to eliminate the normal copy-number variability of the data, resulted in signals where localized CNVs at specific locations along the chromosomes were clearly identifiable. Consistent CNVs for all patients with recurrent meningiomas were seen, at least in the few fully analyzed chromosomes. Thus, signal processing techniques that aim at increasing the SNR may be useful in the analysis of array CGH data, to identify local (small-scale) copy number changes, possibly associated with tumor progression.
Acknowledgments
The authors would like to thank Adam Olshen for his help with the TCGA data.
Contributor Information
Catherine Stamoulis, Email: cstamoul@bidmc.harvard.edu, Department of Neurology, Harvard Medical School, Beth Israel Deaconess Medical Center, Boston MA 02215.
Rebecca A. Betensky, Email: betensky@hsph.harvard.edu, Department of Biostatistics, Harvard School of Public Health, Boston MA 02115
Gayatry Mohapatra, Email: gmohapatra@partners.org, Pathology Service, Massachusetts General Hospital, Boston MA 02114.
David N. Louis, Email: dlouis@partners.org, Pathology Service, Massachusetts General Hospital, Boston MA 02114
References
- 1.The results published here are in part based upon data generated by The Cancer Genome Atlas Pilot Project established by the NCI and NHGRI: http://cancergenome.nih.gov.
- 2.Allen RL, Mills DW. Mills, Signal Analysis: Time, Frequency, Scale and Structure. John Wiley & Sons; 2004. [Google Scholar]
- 3.Albertson DG, Pinkel D. Genomic Microarrays in Human Genetic Disease and Cancer. Hum Mol Genet. 2003;12:R145–R152. doi: 10.1093/hmg/ddg261. [DOI] [PubMed] [Google Scholar]
- 4.Broet P, Richardson S. Detection of Gene Copy Number Changes in CGH Microarrays Using a Spatially Correlated Mixture Model. Bioinformatics. 2006;22(8):911–918. doi: 10.1093/bioinformatics/btl035. [DOI] [PubMed] [Google Scholar]
- 5.Engler DA, Mohapatra G, Louis DN, Betensky RA. A Pseudo-likelihood Approach for Simultaneous Analysis of Array Comparative Genomic Hybridization. Biostatistics. 2006;7(3):399–421. doi: 10.1093/biostatistics/kxj015. [DOI] [PubMed] [Google Scholar]
- 6.Fridlyand J, Snidjers A, Pinkel D, Albertson D, Jain A. Hidden Markov Models Approach to the Analysis of Array CGH Data. Journal of Multivariate Analysis. 2004;90(1):132–153. [Google Scholar]
- 7.Hodgson G, Hager JH, Volik S, Hariono S, Wernick M, et al. Genome Scanning with Array CGH Delineates Regional Alterations in Mouse Islet Carcinomas. Nat Genet. 2001;29(4):459–64. doi: 10.1038/ng771. [DOI] [PubMed] [Google Scholar]
- 8.Huang NE, Shen Z, Long SR, et al. Emprical Mode Decomposition and the Hilbert Spectrum for Non-Linear, Non-Stationary Time Series Analysis. Proc R Soc Lond A. 1998;454:903–995. [Google Scholar]
- 9.Hupe P, Stransky N, Thiery JP, Radvany F, Barillot E. Analysis of Array CGH Data: From Signal Ratio to Gain and Loss of DNA Regions. 2004;20(8):3413–3422. doi: 10.1093/bioinformatics/bth418. [DOI] [PubMed] [Google Scholar]
- 10.Kallioniemi A, Kallioniemi OP, Sudar D, Rutovitz D, Gray JW, et al. Comparative Genomic Hybridization for Molecular Cytogenetic Analysis of Solid Tumors. Science. 1992;258(5083):818–821. doi: 10.1126/science.1359641. [DOI] [PubMed] [Google Scholar]
- 11.Marioni JC, Thorne NP, Tavare S. BioHMM: A Heterogeneous Hidden Markov Model for Segmenting Array CGH Data. Bioinformatics. 2006;22(9):1144–1146. doi: 10.1093/bioinformatics/btl089. [DOI] [PubMed] [Google Scholar]
- 12.Marioni JC, Thorne NP, Valsesia A, Fitzgeraland T, Redon R, et al. Breaking the Waves: Improved Detection of Copy Number Variation From Microarray-Based Comparative Genomic Hybridization. Genome Biology. 2007;8(10):R228. doi: 10.1186/gb-2007-8-10-r228. [DOI] [PMC free article] [PubMed] [Google Scholar]
- 13.Pinkel D, Albertson DG. Array Comparative Hybridization and its Application in Cancer. Nat Genet. 2005;37(Suppl):S11–17. doi: 10.1038/ng1569. [DOI] [PubMed] [Google Scholar]
- 14.Redon R, Ishikawa S, Fitch KV, Feuk L, Perry GH, Andrews TD, Fiegler H, Shapero MH, Carso AR, Chen W, et al. Global Variation in Copy Number in the Human Genome. Nature. 2006;44:444–454. doi: 10.1038/nature05329. [DOI] [PMC free article] [PubMed] [Google Scholar]
- 15.Su SC, Yeh CH, CCJ Structural Analysis of Genomic Sequences with Matched Filtering. Proceedings of the 25th Annual International Conference of the IEEE; 2003. pp. 2893–2896. [Google Scholar]
- 16.Stamoulis C. Analysis of Non-Stationary Biological Signals Using a Mode Decomposition Approach. IEEE; Submitted. [Google Scholar]
- 17.Tirkkonen M, Tanner M, Karhu M, Kallioniemi A, Isora J, Kallioniemi OP. Molecular Cytogenetics of Primary Breast Cancer by CGH. Genes, Chromosomes and Cancer. 1998;21:177–184. [PubMed] [Google Scholar]
- 18.Van Trees HL. Detection, Estimation and Modulation Theory. John Wiley & Sons; 2003. [Google Scholar]


