

Abstract
Classically, the spinothalamic (ST) system has been viewed as the major pathway for transmitting nociceptive and thermoceptive information to the cerebral cortex. There is a long-standing controversy about the cortical targets of this system. We used anterograde transneuronal transport of the H129 strain of herpes simplex virus type 1 in the Cebus monkey to label the cortical areas that receive ST input. We found that the ST system reaches multiple cortical areas located in the contralateral hemisphere. The major targets are granular insular cortex, secondary somatosensory cortex and several cortical areas in the cingulate sulcus. It is noteworthy that comparable cortical regions in humans consistently display activation when subjects are acutely exposed to painful stimuli. We next combined anterograde transneuronal transport of virus with injections of a conventional tracer into the ventral premotor area (PMv). We used the PMv injection to identify the cingulate motor areas on the medial wall of the hemisphere. This combined approach demonstrated that each of the cingulate motor areas receives ST input. Our meta-analysis of imaging studies indicates that the human equivalents of the three cingulate motor areas also correspond to sites of pain-related activation. The cingulate motor areas in the monkey project directly to the primary motor cortex and to the spinal cord. Thus, the substrate exists for the ST system to have an important influence on the cortical control of movement.
Introduction
The spinothalamic (ST) system has long been known to be a major route for transmitting information about pain, temperature and perhaps the state of internal organs to the cerebral cortex (Craig, 2003). It is generally agreed that the ST system is comprised of several components which originate largely from neurons in laminae I, V, and VII of the spinal cord. The axons of these spinal neurons terminate in multiple thalamic nuclei. Past attempts to trace this pathway from the spinal cord through the thalamus and then, to the cerebral cortex have encountered a number of technical and conceptual difficulties. These include, but are not limited to, major disagreements about thalamic nomenclature and thalamic boundaries. As a consequence, the cortical targets of the thalamic neurons which receive ST input have been the subject of continuing controversy (Willis et al., 2002; Craig, 2003).
Here we used anterograde transneuronal transport of the H129 strain of herpes simplex virus type 1 (HSV1) to trace the disynaptic pathway that transmits information from the spinal cord via the thalamus to the cerebral cortex. The H129 strain has been successfully used to reveal a wide variety of multisynaptic circuits including those in the visual system, trigeminal afferent pathways, central viscerosensory pathways, and subcortical pathways involving the basal ganglia and cerebellum (Zemanick et al., 1991; Barnett et al., 1995; Sun et al., 1996; LaVail et al., 1997; Garner and LaVail, 1999; Archin and Atherton, 2002; Kelly and Strick, 2003; Rinaman and Schwartz, 2004). Thus, this strain of HSV1 is uniquely suited for tracing the multiple components of the ST system.
Transneuronal transport of the H129 strain from cervical segments of the spinal cord consistently labeled neurons in multiple cortical areas of the contralateral hemisphere. The major sites containing labeled neurons include granular insular cortex (Ig), secondary somatosensory cortex (S2) and several regions buried within the cingulate sulcus. It is noteworthy that comparable cortical regions in humans consistently display activation when subjects are acutely exposed to painful stimuli. In one animal we used retrograde transport of a conventional tracer from the ventral premotor area (PMv) to identify the motor areas in the cingulate sulcus. Transneuronal transport of H129 from the spinal cord in this animal demonstrated that each of the cingulate motor areas receives ST input. Next, we performed a meta-analysis of imaging studies in humans and compared the sites of pain-related activation on the medial wall of the hemisphere with the sites of movement-related activation in the same region. This analysis demonstrated that the human equivalents of the three cingulate motor areas correspond to sites of pain-related activation. Because the cingulate motor areas project to the primary motor cortex and to the spinal cord, these observations suggest that the neural substrate exists for the ST system to have an important influence on the cortical control of movement.
Materials and Methods
This report is based on observations from three Cebus monkeys (Cebus apella; 2.2–2.7 kg; 2 males, 1 female). In all three animals, we placed multiple injections of the H129 strain of HSV1 into lower cervical segments of the spinal cord. In one animal, we also injected a conventional tracer into the arm area of the PMv before injecting virus into the spinal cord.
As detailed in prior publications, all surgeries were performed under deep general anesthesia (1.5–2.5% isoflurane) using aseptic conditions (Kelly and Strick, 2003; Dum and Strick, 2005). Analgesic (buprenorphine) and antibiotic drugs (ceftriaxone) were given postoperatively in accordance with the Association for Assessment and Accreditation of Laboratory Animal Care (AAALAC) and the National Institutes of Health Guide for the Care and Use of Laboratory Animals. The protocol was approved by the Institutional Animal Care and Use Committee and the Biosafety Committee. Biosafety practices conformed to the Biosafety Level 2 regulations outlined in Biosafety in Microbiological and Biomedical Laboratories (Department of Health and Human Services publication No. 93–8395). Details of the procedures for handling virus and virus-infected animals have been published previously (Kelly and Strick, 2000, 2003).
Spinal cord injections.
A detailed description of our procedures for injecting tracers into the spinal cord has been presented in He et al. (1993). Briefly, we performed a laminectomy to expose the cervical segments of the spinal cord. With the dura open, dorsal root entry zones were used to identify segmental levels. We used a Hamilton syringe (30-gauge needle) to place 13–15 injection tracks into the lower cervical segments (C5-T1). Small amounts of the H129 strain of HSV1 (0.2 μl; 3.2 × 10¹⁰ pfu/ml; supplied by Dr. Richard D. Dix, Georgia State University, Atlanta, GA) were injected at three depths along each track. The three depths targeted the major concentrations of ST neurons in laminae I, V and VII (Apkarian and Hodge, 1989a). After all injections were completed, the spinal cord was covered with artificial dura and the incision was closed in anatomical layers. We set the survival time for virus injections at 4 d. In Cebus monkeys, this survival time is appropriate for anterograde transneuronal transport of virus from the injection site in the spinal cord to the thalamus and then, a second stage of anterograde transneuronal transport from the thalamus to the cerebral cortex (Zemanick et al., 1991; Kelly and Strick, 2003).
PMv injection.
In one animal, we identified the arm representation of the PMv with intracortical stimulation and injected this region with a conventional tracer, diamidino yellow (DY). Because of differences in transport times, the PMv injections were made 11 d before the spinal injections of virus. Our methods for mapping the PMv have been described previously (Dum and Strick, 2005). Briefly, the lateral surface of the cortex was exposed under isoflurane anesthesia. Then, the anesthesia was switched to Telazol (5–7 mg/kg/h) and butorphanol (0.01 mg/kg) for the duration of the intracortical mapping. The exposed cortex was photographed. Trains of stimuli (33 cathodal pulses, 0.2 ms duration, 333 Hz frequency, 1–40 μA intensity) were delivered at a standard depth (1500 μm) with parylene-insulated Elgiloy microelectrodes. The movement evoked at each stimulation site was determined by visual inspection and muscle palpation. We defined the threshold current for each response as the stimulus intensity that evoked movement in ∼50% of the trials. The location of each penetration, the depth of stimulation, the movement evoked and its threshold were entered into a computer program that generated maps of these results.
Once the arm area of the PMv was identified, we used a Hamilton syringe to inject DY (2% in distilled water) into three sites. At each site, we placed small amounts of tracer (0.1–0.3 μl) at two depths (1100 μm, 1500 μm) below the cortical surface. When the injections were completed, the cortical surface was covered with artificial dura and the incision was closed.
Histological procedures.
At the end of the survival period, each animal was deeply anesthetized (ketamine, 20–25 mg/kg, i.m. followed by sodium pentobarbital, 40 mg/kg, i.p.) and was perfused transcardially with a 3 step procedure. The perfusates included: (1) 0.1 m phosphate buffer; (2) 10% buffered formalin; and (3) 10% buffered formalin with 10% glycerol added. After the perfusion the segmental levels of the spinal cord were marked with India ink at the junctions of dorsal root entry zones. The brain and spinal cord were blocked, photographed and stored at 4°C in buffered 10% formalin with 20% glycerol for 5–7 d.
Serial frozen sections (50 μm) of the spinal cord and cerebral cortex were cut in the transverse plane. Every tenth section was stained with cresyl violet to reveal cytoarchitecture. To identify virus-infected neurons, we processed at least every fourth section as free-floating tissue according to the avidin-biotin peroxidase method (Vectastain, Vector Laboratories). We detected HSV1 using a commercially available polyclonal antibody (diluted 1:2000; Dako) (Kelly and Strick, 2003).
Analytic procedures.
Brain and spinal cord sections were examined under the microscope for virus infected neurons using brightfield illumination and for DY labeled neurons using epifluorescence illumination (Olympus filter U-MWBV2). Section outlines, labeled neurons and injection sites were plotted using a computer-based charting system (MD2, Accustage) (Dum and Strick, 1991, 2005). We charted at least every fourth section for virus infected neurons or virus infected and DY labeled neurons. Software written in our laboratory allowed us to construct maps showing the location and density of labeled neurons in the cerebral cortex. The procedures we used to generate unfolded maps of cortical regions have been described in detail previously (Dum and Strick, 1991, 2005). Briefly, for charted sections we marked major morphological features (e.g., surface and depths of sulci) and drew a curved line along the border between cortical layers III and V. Then, our computer program used this information along with the location of labeled neurons to create flattened maps of cortical regions. To examine the density of labeled neurons, the computer program divided labeled regions into 200 μm bins and totaled the number of labeled neurons in each bin. This number was converted to a color code for display.
Images of selected anatomical structures were obtained using a digital camera (RT3 monochrome camera, Diagnostic Instruments) coupled to a personal computer. The images were adjusted for contrast, brightness and intensity using Corel Photopaint. In some instances, multiple images were formed into a composite with the “Stitch” function built into Corel Photopaint. Separate composites were produced from sections processed for virus and from adjacent sections processed for cytoarchitecture. The two composite images were aligned using blood vessels and major morphological features and then digitally merged into a single image.
Analysis of injection sites.
H129 injection sites display concentric central and peripheral zones of immunoreactive labeling (Zemanick et al., 1991; Kelly and Strick, 2003). The central zone, located adjacent to the needle track, is characterized by marked tissue necrosis and dense accumulations of reaction product but no discernible neurons. The peripheral zone contains darkly labeled neurons that can be distinguished from the background staining of the neuropil. We used the central zone of labeling to define the H129 injection sites in the spinal cord. To define the location of the central zone we examined sections of spinal cord at 1 mm intervals through the cervical enlargement.
DY injection sites also display central and peripheral zones of fluorescent labeling. We defined the DY injection site as the central zone containing the injected tracer (Zone 1) and the surrounding region of intense staining of neurons, glia and neuropil (Zone 2) (Huisman et al., 1983; Kuypers and Huisman, 1984; Condé, 1987; He et al., 1993). Based on this definition, we reconstructed the DY injection site and aligned it to the motor map of the PMv using the injection tracks as a guide.
Results
We injected the H129 strain of HSV1 into lower cervical segments of the spinal cord in cebus monkeys. We set the survival time following the virus injections at 4 d to allow for two stages of anterograde transneuronal transport (Zemanick et al., 1991; Kelly and Strick, 2003). In the first stage of transport, virus is taken up by first-order neurons at the injection site and transported in the anterograde direction to the thalamus where it moves trans-synaptically to infect second-order neurons (Fig. 1A). Then, in a second stage, virus is transported in the anterograde direction from second-order neurons in the thalamus to the cerebral cortex where it moves trans-synaptically to infect third-order neurons (Fig. 1).
Figure 1.

Experimental paradigm and cortical labeling. A, Diagram of anterograde transneuronal transport of virus from spinothalamic neurons in laminae I, V, and VII to thalamus and then from thalamus to cerebral cortex. The gray area in the spinal cord represents the virus injection site. B, C, Photomicrographs of third-order neurons labeled in the cingulate sulcus after anterograde transneuronal transport of virus from cervical segments of the spinal cord. The boxed area in B is enlarged in C. CgS, Cingulate sulcus.
Injection sites in the spinal cord
In two animals (DL2, DL3), the injection site included most of the dorsal horn and large portions of the intermediate zone throughout the cervical enlargement (C5-T2) (Fig. 2). In each case, the injection site was confined to the ipsilateral side and involved all the laminae (I, V, VII) in the lower cervical segments that are known to be the origin of spinothalamic neurons (Apkarian and Hodge, 1989a; Willis et al., 1979, 2001). In the third animal (DL7), the injection site was more confined (Fig. 2). It involved fewer segments (C7-T1) and did not completely fill the dorsal horn and intermediate zone. Consequently, DL7 was not included in the quantitative analysis of the distribution of cortical labeling. However, the major cortical areas that contained labeled neurons in DL7 were the same as those in the other two animals.
Figure 2.

Virus injection sites in the spinal cord. Upper left: We divided the gray matter of the spinal cord into eight regions and determined the extent of the spread of virus at the injection site into each region. Upper right and bottom panels, Each panel displays the injection site of a separate animal. Dark gray shading indicates the central zone of virus labeling and light gray indicates the peripheral zone. The injection was considered to be the central zone of labeling (see Materials and Methods for details). The segments sampled are indicated along the abscissa of each chart. We sampled each segment at 1 mm intervals.
Thalamic targets of the ST system
Our analysis of thalamic labeling has been limited to confirming that infected neurons were located at the known sites of termination of spinothalamic input. This is because a survival time sufficient to label third-order neurons in the cerebral cortex, will label not only second-order neurons in the thalamus, but also third-order neurons as well (Zemanick et al., 1991; Kelly and Strick, 2003). In short, we found labeled neurons at all the major sites of spinothalamic termination (Figs. 3, 4) (Ganchrow, 1978; Berkley, 1980; Mantyh, 1983; Apkarian and Hodge, 1989b; Gingold et al., 1991; Stepniewska et al., 2003; Craig, 2004). These included the caudal subdivision of the ventral posterior lateral nucleus (VPLc), the inferior portion of the ventral posterior nucleus (VPI), the posterior-suprageniculate complex (Po-SG), the central lateral nucleus (CL), and caudal portions of the medial dorsal nucleus (MD) (Figs. 3, 4). The region with labeled neurons that we designated as Po-SG is thought to include a subdivision termed the posterior portion of the ventral medial nucleus (VMpo) (Craig, 2004; see also Gingold et al., 1991). We also observed scattered small clusters of labeled neurons in the caudal portion of the oral subdivision of the ventral posterior lateral nucleus (VPLo), the caudal subdivision of the ventral lateral nucleus (VLc), the oral subdivision of the pulvinar (Pul.o) as well as in some midline nuclei (e.g., reuniens, central medial, submedius). Thus, the pattern of thalamic labeling is consistent with transneuronal transport of virus via all components of the spinothalamic system.
Figure 3.

Distribution of virus infected neurons in the thalamus. Photomicrographs show neurons in various nuclei of the thalamus that were infected by anterograde transneuronal transport of virus from the cervical spinal cord. A, B, Nissl stained sections of the thalamus show nuclear borders. Some gliosis is evident in regions where virus infected neurons are located (e.g., VPI in A; MD in B). C, D, Sections reacted to demonstrate virus infected neurons. Section C is near section A; section D is near section B. Black arrows mark distinct patches of labeled neurons. Open arrows in C and D mark blood vessels that are also present in A and B. E, F, Digitally merged photographs of the sections A + C and B + D. The calibration in F applies to all sections. CM, Centromedian nucleus; fr, fasciculus retroflexus; Hb, habenular nucleus; LP, lateral posterior nucleus; Pf, parafasciculus nucleus; VPM, ventral posterior medial nucleus.
Figure 4.
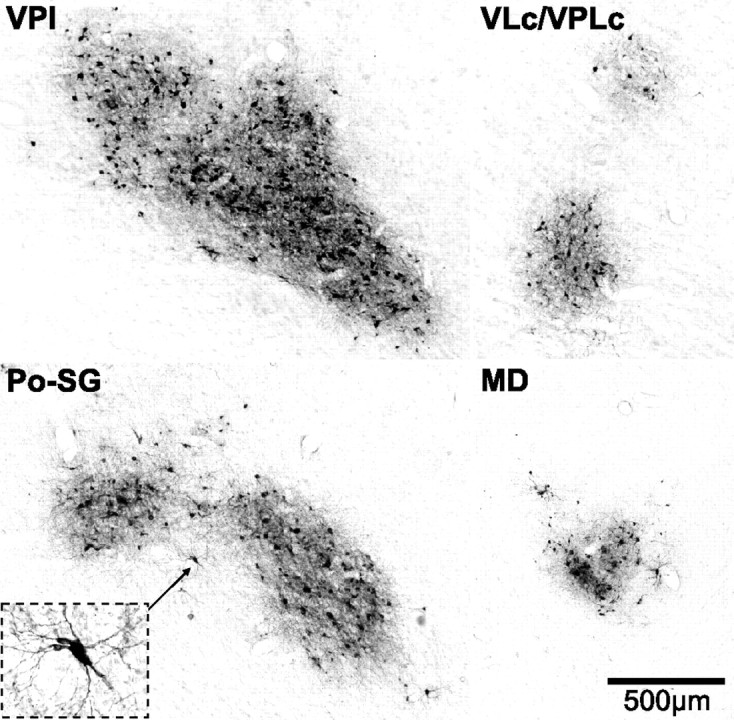
Virus infected neurons in thalamic nuclei. Photomicrographs of virus infected neurons in thalamic nuclei. VPI and VLc/VPLc are taken from the dashed boxes in Figure 3C. Po-SG and MD are taken from the dashed boxes in Figure 3D. The inset in Po-SG displays a higher-magnification view of an infected neuron (marked by the small arrow). The calibration for all sections is shown in MD. Abbreviations as in Figure 3.
Spinal input to other subcortical sites
Although the focus of this report is spinothalamic projections to the cerebral cortex, we also observed labeling at all the subcortical sites known to be the target of spinal input (not illustrated) (Yezierski, 1988; Craig, 1995; Newman et al., 1996; Andrew et al., 2003). For example, we found large numbers of labeled neurons in regions of the brainstem including the parabrachial nuclei, dorsomedial and ventrolateral medullary reticular formation, locus ceruleus, subceruleus, Kölliker-Fuse, solitary nucleus and periaqueductal gray (Yezierski, 1988; Craig, 1995; Andrew et al., 2003). In addition, we observed labeled neurons in basal ganglia and limbic areas known to be the target of spinal input including the globus pallidus, central nucleus of the amygdala, substantia innominata and the hypothalamus (Newman et al., 1996). The presence of infected neurons at these sites raises the possibility that the cortical labeling we observed could be mediated by routes other than a spino-thalamocortical pathway, such as a “postsynaptic dorsal column system” (Hayes and Rustioni, 1981; Al-Chaer et al.,1998, 1999; Al-Chaer et al.,1998, 1999; Willis et al., 1999), a spino-reticular formation-thalamocortical pathway (Yezierski et al., 1987; Craig, 1995; Gauriau and Bernard, 2002), or a spino-parabrachial nucleus-thalamocortical pathway (Pritchard et al., 2000, Gauriau and Bernard, 2002). We can rule out transport to the cortex via these pathways because they require transneuronal transfer through three synapses rather than the two required of the spino-thalamocortical pathway. In other words, the cortical neurons labeled via a spino-reticular formation-thalamocortical pathway would be fourth-order neurons rather than the third-order neurons labeled via the ST system. Only the hypothalamus also has the potential to mediate a disynaptic route from the spinal cord to the cerebral cortex (Kievit and Kuypers, 1975; Burstein et al., 1987; Newman et al., 1996; Rempel-Clower and Barbas, 1998; Barbas et al., 2003). However, we can rule out transport via this structure because the major cortical targets of the hypothalamus, i.e., regions of prefrontal and orbitofrontal cortex (Barbas et al., 2003) lacked labeled neurons in our experiments (see below).
Cortical targets of the ST system
Anterograde transneuronal transport of HSV1 from the spinal cord infected clusters of third-order neurons at multiple sites in the contralateral cerebral cortex (Figs. 5–7). The infected neurons were generally filled with reaction product and showed little or no evidence of cell lysis (Fig. 1B,C). The labeled cells varied in size, and were largely pyramidal-shaped. In regions of dense labeling, infected neurons were most concentrated in layer V with additional populations of labeled neurons in layers III–IV and VI.
Figure 5.
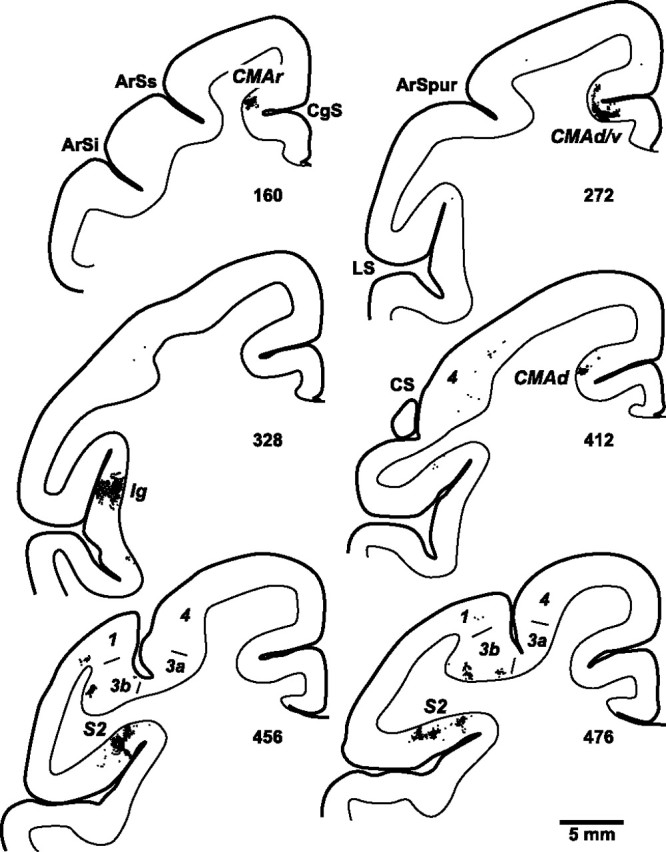
Distribution of cortical neurons labeled by anterograde transneuronal transport of virus from the spinal cord. Charts display dense clusters of labeled neurons (small black dots) found on coronal sections at various levels of the cerebral cortex. The numbers below each section indicate their location (marked in Figs. 6, 7). ArSi, ArSs, Inferior and superior limbs of the arcuate sulcus; ArSpur, spur of the arcuate sulcus; CgS, cingulate sulcus; LS, lateral sulcus; 1, 3a, 3b, 4, cytoarchitectonic areas.
Figure 6.

ST projections to cortical areas in the lateral sulcus. A, Lateral view of the left hemisphere from a cebus monkey. The lateral sulcus is unfolded to show the cortical areas buried in it. The lateral sulcus is unfolded downward from its dorsal edge. The dorsal and ventral edges of the sulcus are represented by solid lines and various bends in the sulcus are represented by dashed lines. Dotted lines enclose S2 on the dorsal bank of the lateral sulcus (LSd) and Ig on the Insula. B, C, Location and density of neurons labeled in the lateral sulcus following anterograde transneuronal transport of virus from the spinal cord (B, animal DL2; C, animal DL3). The density of labeled neurons was determined by counting the number of labeled cells within 200 μm bins along each section. The number of cells per bin was divided into five levels and color coded: white, top 5% of bins (95–100%); yellow, 90–95%; red, 80–90%; large blue squares, 40–80%; 0–40%, omitted. The numbered arrows refer to sections illustrated in Figure 5. AC, Level of the anterior commissure; ArS, arcuate sulcus; CSl, lateral extent of central sulcus; Ia, agranular insular cortex; Id, dysgranular insular cortex; IPS, intraparietal sulcus; LSv, lateral sulcus, ventral bank; PS, principal sulcus; 7op, opercular portion of area 7. Other abbreviations and conventions as in Figures 4 and 5.
Figure 7.

ST projections to cortical areas in the cingulate sulcus. A, Unfolded map of medial wall of the hemisphere. The medial wall is unfolded and reflected upward from the midline. The edges of the cingulate sulcus are represented by solid lines and the fundus is represented by a dashed line. A dotted line encloses the portion of the primary motor cortex that extends onto the medial wall. The numbers and letters in italics indicate the relative location of the various cortical areas that are on the medial wall. B, Location and density of neurons labeled in the cingulate sulcus following anterograde transneuronal transport of virus from the spinal cord (animal DL3). The numbered arrows refer to sections illustrated in Figure 5. ArG, Level of the genu of the arcuate sulcus; CC, corpus callosum; CgSd, dorsal bank of the cingulate sulcus; CgSv, ventral bank of the cingulate sulcus; CgG, cingulate gyrus; CMAd, dorsal cingulate motor area; CMAr, rostral cingulate motor area; CMAv, ventral cingulate motor area; PreSMA, presupplementary motor area; SGm, medial portion of the superior frontal gyrus; SMA, supplementary motor area. Other abbreviations and conventions as in Figures 4–6.
The vast majority (93%) of the neurons labeled by transport from the spinal cord were found in 3 cortical regions (Figs. 5–9) (Table 1). Two of these regions were located in the lateral sulcus and correspond to Ig and S2 (Figs. 5, 6) (Robinson and Burton, 1980a; Mesulam and Mufson, 1982; Burton et al., 1995; Krubitzer et al., 1995). The third region was located in the cingulate sulcus at the level of the cingulate motor areas (Figs. 7, 9) (Dum and Strick, 1991, 2005; He et al., 1995).
Figure 8.

Injection site in the arm representation of the PMv. The arm representation of the PMv was identified using intracortical stimulation. Then, it was injected with a conventional tracer (diamidino yellow). A, Lateral view of the left hemisphere from a cebus monkey. The dashed box on the brain outline indicates the region magnified in B. B, Motor responses and injection site in the PMv (animal DL7). Symbols indicate the movement evoked at each site of intracortical stimulation (see key at lower right). The size of each symbol indicates the threshold (large = <10 μA, medium = 10–20 μA, small = >20 μA). A small “x” indicates each of the 3 sites of tracer injection. The spread of the tracer is indicated by the gray shading. Abbreviations and conventions as in Figures 5 and 6.
Figure 9.
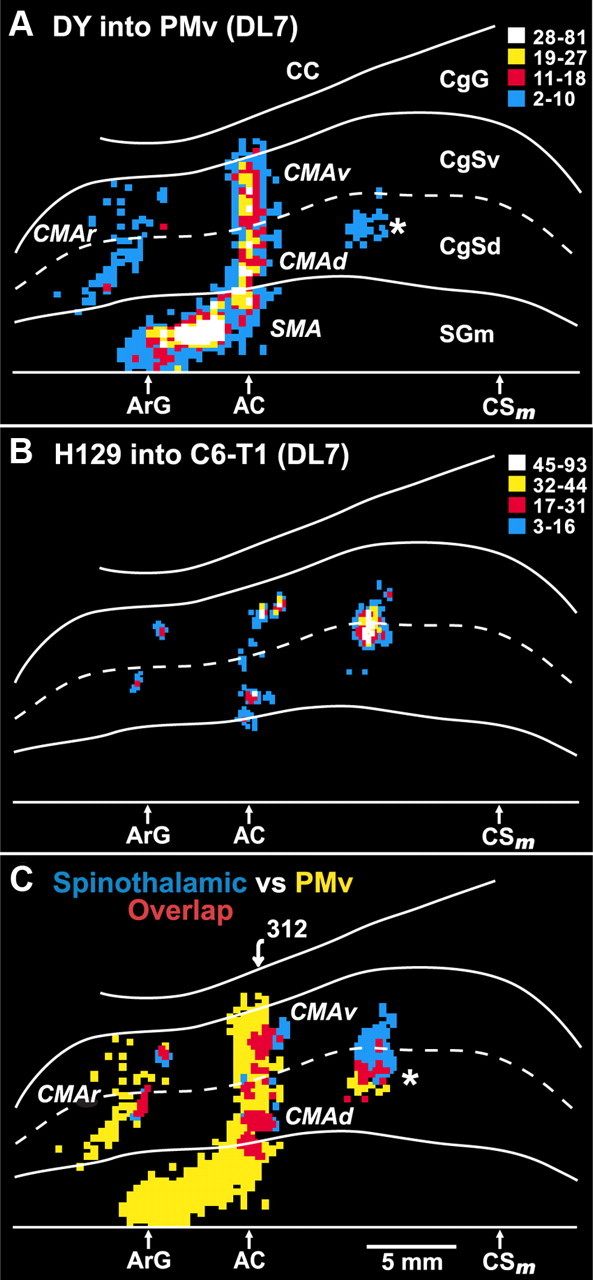
Overlap between ST projections to the cingulate sulcus and the cingulate motor areas. In animal DL7, a conventional tracer (diamidino yellow) was injected into the arm representation of the PMv. In the same animal, the H129 strain of HSV1 was injected into cervical segments of the spinal cord. A, Unfolded map of neurons on the medial wall of the hemisphere that project to the PMv (the injection site is shown in Fig. 8). These neurons are located in each of the cortical motor areas in and adjacent to the cingulate sulcus, i.e., SMA, CMAr, CMAd, CMAv. A separate small patch of labeled neurons (*) is located in the caudal part of the CMAd. B, Location and density of neurons labeled in the cingulate sulcus following anterograde transneuronal transport of virus from the spinal cord. C, Overlap map of the cortical regions that project to the PMv and the cortical regions that are the target of the ST system. Blue bins indicate cortical regions containing only neurons labeled by anterograde transneuronal transport of virus from the spinal cord. Yellow bins indicate cortical regions containing only neurons labeled by retrograde transport of a conventional tracer from the PMv. Red bins indicate cortical regions containing both types of labeled neurons. The numbered arrow marks the location of the section illustrated in Figure 10. Abbreviations and conventions as in Figures 6 and 7.
Table 1.
Cortical targets of the spinothalamic tract
| Expt. | Ig | S2 | CMAd/v | CMAc | CMAr | 3b | 7op | M1 | 1 | 3a | 2/5 | Other | Total cells |
|---|---|---|---|---|---|---|---|---|---|---|---|---|---|
| DL2 | 39.3 | 29.6 | 12.2 | 13.9 | 0 | 1.1 | 0.9 | 1.4 | 0.4 | 0.3 | 0.3 | 0.5 | 2055* |
| DL3 | 43.2 | 27.4 | 15 | 1.6 | 5.8 | 4.2 | 0.7 | 0.2 | 1.1 | 0.3 | 0.2 | 0.3 | 14,708* |
| Ave. | 41.3 | 28.5 | 13.6 | 7.8 | 2.9 | 2.7 | 0.8 | 0.8 | 0.8 | 0.3 | 0.3 | 0.4 |
Numbers = percentage of total labeled neurons in cortex. CMAc, Caudal portion of the dorsal cingulate motor area (see text and asterisk in Fig. 9); Expt., experiment; Ave., average. *Actual cell counts from plotted sections (DL2: every 2nd section; DL3: every 4th section).
Lateral sulcus
Ig contained the highest density and largest number of labeled neurons (41%). These neurons were located in the posterior insula at levels just caudal to the anterior commissure and rostral to the lateral extent of the central sulcus (CS) (Fig. 5, section 328) (Fig. 6B,C). The next largest number of labeled neurons (29%) was located in a mid to rostral region of S2 Figure 6B,C). These labeled neurons were most concentrated on the dorsal bank of the lateral sulcus at levels just caudal to the lateral extent of the CS (Fig. 5, sections 456, 476) (Fig. 6B,C).
Cingulate sulcus
The labeling in the cingulate sulcus comprised 24% of the total number of labeled neurons in the cortex. These neurons were distributed in three separate groupings (Figs. 7B, 9B). A small rostral grouping (3%) was located near the fundus of the cingulate sulcus at levels just rostral to the genu of the arcuate sulcus (Fig. 5, section 160). The middle grouping was the largest (14%) and was located on the dorsal and ventral banks of the cingulate sulcus around the level of the anterior commissure (Fig. 5, section 272). A caudal grouping (8%) was located largely on the dorsal bank near the fundus of the cingulate sulcus at levels 5–6 mm caudal to the anterior commissure (Fig. 5, section 412).
No other cortical areas contained substantial numbers of labeled neurons. We did find a few small isolated patches of labeled neurons in primary somatosensory cortex (S1) (Fig. 5, sections 456, 476). Together, the number of labeled neurons in areas 3a, 3b, 1 and 2 represented ∼4% of the total cortical labeling. We also observed a few isolated single neurons labeled in several other areas (e.g., primary motor cortex, supplementary motor area, opercular area 7 and area 5). The labeling at these sites never amounted to >3 per cent of the total. It is possible that some of these neurons represent weak retrograde transport of the H129 strain (Rinaman and Schwartz, 2004). In the third animal only, a few labeled neurons were found in the ipsilateral hemisphere within the fundus of the cingulate sulcus at levels just rostral to the arcuate genu.
Spinothalamic input to the cingulate motor areas
Our prior studies have shown that the cingulate sulcus contains three distinct cingulate motor areas: rostral, dorsal and ventral (CMAr, CMAd, and CMAv) (Dum and Strick, 1991, 2005, He et al., 1995). Each of these areas projects directly to the spinal cord and to the other cortical motor areas in the frontal lobe including the primary motor cortex (M1), the dorsal premotor area (PMd) and the ventral premotor area (PMv) (Dum and Strick, 2005). Our current results raise an obvious question about the relationship between the cortical targets of the ST pathway in the cingulate sulcus and the cingulate motor areas. To examine this issue we injected the hand representation of the PMv with DY (Fig. 8) and used retrograde transport of this tracer to define the location of the hand representations of the cingulate motor areas. Then, in the same animal, we injected lower cervical segments of the spinal cord with the H129 strain of HSV1 and used anterograde transneuronal transport of the virus to define the cortical targets of the ST pathway.
Using this “double labeling” approach, we found a remarkable correspondence between the cingulate motor areas (Fig. 9A) and the targets of ST input in the cingulate sulcus (Fig. 9B,C). In particular, the small rostral grouping of ST input in the cingulate sulcus overlaps with the CMAr. Likewise, the middle grouping of ST input overlaps with both the CMAd and the CMAv (Figs. 9C, 10). The caudal grouping of ST input overlaps with a small, caudal part of the CMAd (Fig. 9C, asterisk). Our prior studies have consistently shown that this portion of the CMAd projects to both the cervical spinal cord and the hand area of M1 (Dum and Strick, 1991, 2005; He et al., 1995). Thus, the ST input from the cervical cord to the cingulate sulcus targets the arm representation in each of the cingulate motor areas.
Figure 10.

Overlap between ST projections to the cingulate sulcus and the CMAd and CMAv. Neurons labeled by anterograde transneuronal transport from the spinal cord (black dots) and neurons labeled retrograde transport from the PMv (gray dots) are plotted on a single cortical section. Abbreviations and conventions as in Figure 5.
Our observations suggest a functional linkage between the ST system and the cingulate motor areas. This led us to examine whether human studies provide evidence for a similar linkage. We performed a meta-analysis of imaging studies and compared the sites of pain-related activation with the sites of movement-related activation (Fig. 11; Table 2). Our analysis included studies that applied noxious stimuli to the hand/arm and reported significant pain-related activations on or near the midline of the contralateral hemisphere (Fig. 11, red symbols). These “pain” sites were overlapped on a map of the sites of activation associated with the performance of “simple” (blue circles) and “complex” (blue diamonds) movements [Picard and Strick (1996), taken from their Fig. 5]. The summary map (Fig. 11) also includes the outlines of the cingulate motor areas in humans.
Figure 11.

Relationship between pain-related and motor-related activations on the medial wall of the hemisphere in humans. Pain-related activations on or near the midline of the contralateral hemisphere are indicated by red symbols. The numbers in the symbols refer to the references listed in Table 2. These “pain” sites were overlapped on a map of the sites of activation associated with the performance of “simple” (blue circles) and “complex” (blue diamonds) movements [taken from Picard and Strick (1996), their Fig. 5]. The summary map also includes the outlines of the cingulate motor areas in humans (gray shading; Picard and Strick, 1996). CA-CP, Horizontal line passing through the anterior and posterior commissures; CCZ, caudal cingulate zone; RCZa, anterior subdivision of the rostral cingulate zone; RCZp, posterior subdivision of rostral cingulate zone; Vca, vertical line through the anterior commissure; Vcp, vertical line through the posterior commissure.
Table 2.
Medial wall activations associated with pain
| Reference | Method | Atlas | Stimulus | Location | Contrast | Coordinates (x, y, z) |
|---|---|---|---|---|---|---|
| 1. Adler et al., 1997 | PET | T&T 1988 | Contact | Left forearm | Heat pain versus warm | 2, 0, 52 |
| 8, 14, 36 | ||||||
| 2. Bantick et al., 2002 | fMRI | T&T 1988 | Contact | Left hand | Negative interaction with Stroop | 0, −36, 28 |
| 6, −2, 50 | ||||||
| 3. Becerra et al., 1999 | fMRI | T&T 1988 | Contact | Left hand | Heat pain versus warm | 0, 12, 31 |
| 4. Brooks et al., 2002 | fMRI | MNI305 SPM99 | Contact | Right hand | Heat pain versus warm | −8.9, 12.3, 31.6 |
| 5. Büchel et al., 2002 | fMRI | SPM99 (MNI) | Laser | Left hand | Heat pain intensity | 3, 8, 43.8 |
| 3, 7.5, 32.8 | ||||||
| 3, 24.6, 26.4 | ||||||
| 6. Casey et al., 1996 | PET | T&T 1988 | Contact | Left forearm | Heat pain versus warm | 10, 3, 34 |
| Cold pain versus neutral | 6, −10, 45 | |||||
| 7. Casey et al., 2001 | PET | T&T 1988 | Contact | Left forearm | Early phase heat pain | 3, −4, 45 |
| 1, 23, 25 | ||||||
| Late phase heat pain | −6, −1, 38 | |||||
| 8. Coghill et al., 1994 | PET | T&T 1988 | Contact | Left forearm | Heat pain versus neutral | 1, −4, 54 |
| 5, −6, 66 | ||||||
| 1, 1, 42 | ||||||
| 9. Coghill et al., 1999 | PET | MNI305 | Contact | Upper right arm | Pain intensity related | −0.1, 12.8, 32.3 |
| −0.1, 24, 42.8 | ||||||
| 10. Craig et al., 1996 | PET | T&T 1988 | Contact | Right hand | Thermal grill illusion | −10, 7, 38 |
| 11. Derbyshire et al., 1994 | PET | T&T 1988 | Contact | Right hand | Heat pain versus warm | −12, 2, 40 |
| 12. Derbyshire et al., 1997 | PET | T&T 1988 | Laser | Right hand | Heat pain versus warm | 0, 26, 40 |
| 13. Derbyshire and Jones, 1998 | PET | T&T 1988 | Contact | Right hand | Heat pain versus warm | −6, 20, 24 |
| 14. Derbyshire et al., 1998 | PET | T&T 1988 | Contact | Left hand | Heat pain versus warm | 4, 10, 36 |
| 15. Faymonville et al., 2000 | PET | T&T 1988 | Contact | Right hand | Heat pain versus warm | −8, 22, 30 |
| 16. Hofbauer et al., 2001 | PET | MNI | Contact | Left hand | Heat pain versus neutral | 11.9, 0.1, 41.4 |
| 7.9, 4.4, 29.3 | ||||||
| 17. Hsieh et al., 1996 | PET | T&T 1988 | Ethanol | Left arm | Tonic pain | 4, −4, 41 |
| 18. Iadarola et al., 1998 | PET | T&T 1988 | Capsaicin | Left forearm | Heat pain versus warm | 4, 24, 20 |
| 19. Kurata et al., 2002 | fMRI | T&T 1988 | Contact | Right forearm | Heat pain versus neutral | 1, −1, 43 |
| 20. Paulson et al., 1998 | PET | T&T 1988 | Contact | Left forearm | Heat pain versus warm—male | 6, 1, 36 |
| Heat pain versus warm—female | 10, −13, 43 | |||||
| 21. Petrovic et al., 2002 | PET | MNI SPM99 | Contact | Left hand | Heat pain versus warm | 4, −4, 37 |
| 22. Ploghaus et al., 1999 | fMRI | T&T 1988 | Contact | Left hand | Heat pain versus warm | 3, 4, 33 |
| 23. Rainville et al., 1997 | PET | T&T 1988 | Contact | Left hand | Heat pain versus warm | 1, 5, 36 |
| Increased unpleasantness | 3, 20, 30 | |||||
| 24. Svensson et al., 1997 | PET | T&T 1988 | Electrical | Brachio-radialis | Pain versus no pain | −1, 3, 34 |
| 25. Svensson et al., 1998 | PET | MNI 305 | Contact | Right forearm | Tonic heat pain | 0, 40, 2.6 |
| Phasic heat pain versus warm | −5, −2, 37.9 | |||||
| 26. Talbot et al., 1991 | PET | T&T 1988 | Contact | Right forearm | Heat pain versus warm | −15, 1, 33 |
| −5, −17, 39 | ||||||
| 27. Tölle et al., 1999 | PET | T&T 1988 | Contact | Right forearm | Pain unpleasantness | −6, −8, 30 |
| 28. Tracey et al., 2000 | fMRI | T&T 1988 | Contact | Left hand | Heat and cold pain (both) | 0, 0, 46 |
| 29. Vogt et al., 1996 | PET | T&T 1988 | Contact | Left hand | Heat pain versus warm | 2, 4, 40 |
| 6, 20, 24 | ||||||
| 30. Xu et al., 1997 | PET | T&T 1988 | Laser | Left hand | Heat pain versus neutral | 10, 6, 48 |
References that met the following three criteria were selected from the meta-analyses of Peyron et al. (2000) and Vogt (2005): (1) All activations were contralateral or midline with respect to the side of the stimulus, (2) all activations resulted from stimuli located on the hand/arm, and (3) all activations were statistically significant. If a study listed multiple activations with similar locations, we selected those with the highest significance values to prevent single studies from overly biasing the results. We used a non-linear transform to convert Montreal Neurological Institute (MNI) coordinates to Talairach and Tournoux (1988) (T&T 1998) coordinates (http://www.nil.wustl.edu/labs/kevin/man/answers/mnispace.html). Some x-axis coordinates were adjusted so x coordinates for the right hemisphere were assigned positive values. PET, Positron emission tomography; fMRI, functional magnetic resonance imaging.
Approximately half of the pain-related activations (Fig. 11, red circles) cluster near the Vca line and overlap the major group of activations related to simple movements (Fig. 11, blue circles). This region of overlap is within the caudal cingulate zone (CCZ), the proposed homolog of the monkey CMAd (Picard and Strick, 1996). A second, small group of pain-related activations (sites 1, 2, 5, 30) is located ∼0–10 mm rostral to the Vca line and overlaps a small group of activations related to complex movements (Fig. 11, blue diamonds). This region of overlap is within the posterior portion of the rostral cingulate zone (RCZp), the proposed homolog of the monkey CMAv (Picard and Strick, 1996). A third group of pain-related activations is located 20–25 mm rostral to the Vca line and overlaps a larger group of activations related to complex movements (Fig. 11, blue diamonds). This region of overlap is within the anterior portion of the rostral cingulate zone (RCZa), the proposed homolog of the monkey CMAr (Picard and Strick, 1996). Clearly, the human equivalents of the three cingulate motor areas also correspond to sites of pain-related activations. Thus, there is evidence in the human as well as in the monkey for a linkage between nociceptive input and the cortical control of movement. Our monkey experiments add two unique contributions to this story: the results provide (1) an anatomical substrate for the pain-related activations in the cingulate sulcus and (2) a direct demonstration of the linkage between a presumed nociceptive system and the cingulate motor areas.
Discussion
The ST system is recognized as the major route for transmitting nociceptive and thermoceptive information to the cerebral cortex (Craig, 2003). The actual cortical targets of this system have been the subject of considerable controversy (Willis et al., 2002; Craig, 2003). Anterograde transneuronal transport of the H129 strain of HSV1 enabled us to determine the precise location and relative strength of input to each of the cortical targets of the ST system. Our experiments produced two novel results. First, the major cortical targets of the ST system are Ig, S2 and several regions buried in the cingulate sulcus. Second, the ST input to the cingulate sulcus specifically targets the cingulate motor areas. This result is supported by our meta-analysis of imaging which shows that the human equivalents of the three cingulate motor areas correspond to sites of pain-related activation. These new findings have important implications for concepts about the use of ST input at the cortical level.
Insula
Over 40% of the neurons labeled by anterograde transneuronal transport of virus from the spinal cord were located in a single cortical area—Ig in the posterior insula (Fig. 12). This observation, along with prior anatomical, physiological and imaging data, lends support to the hypothesis that Ig is the primary receiving area in the cortex for nociceptive and thermoceptive information (Craig, 2003). Many ST neurons in lamina I (and some in lamina V) terminate in Po-SG (Craig, 2004; Craig and Zhang, 2006), a thalamic region which is thought to project to Ig (Mufson and Mesulam, 1984; Friedman and Murray, 1986). Most of these ST neurons are thought to transmit nociceptive and thermoceptive information (Craig, 2003). In addition, the posterior insula is the cortical region in imaging studies of human subjects that is most consistently activated by stimuli which produce acute pain (Peyron et al., 2000; Apkarian et al., 2005). Furthermore, human subjects report painful sensations following electrical stimulation of the posterior insula (Ostrowsky et al., 2002; Mazzola et al., 2006). However, the hypothesis that Ig in the posterior insula is the primary receiving area for nociceptive information lacks one critical piece of information. There is little or no evidence from physiological recordings that Ig contains a large population of neurons that are specifically sensitive to nociceptive stimuli (Schneider et al., 1993; Zhang et al., 1999). Our map of the ST input to the Ig should enable future studies to determine whether neurons in this region are especially responsive to nociceptive input.
Figure 12.

Major cortical targets of the ST system and their thalamic inputs. The percentage of the total ST input to each cortical area is indicated (“%”). This number is based on the average of two animals (DL2 and DL3, see Results for further details). The thalamic nuclei that are most likely to mediate this input are listed below each cortical area. These thalamic nuclei: (1) receive ST terminations (see Results for references), (2) contain infected neurons in the present study, and (3) are known to project to the relevant cortical area. The following references provide the basis for these thalamocortical linkages: Po-SG to Ig (Mufson and Mesulam, 1984; Friedman and Murray, 1986); VPI to S2 (Friedman and Murray, 1986; Stevens et al., 1993); MDvc to CMA (Hatanaka et al., 2003); VPLc to S1 (Gingold et al., 1991; Jones, 2007). CMA, Cingulate motor areas; MDvc, ventrocaudal portion of medial dorsal nucleus.
Although we have emphasized the potential of the insula to be the target of nociceptive information, there is also evidence that the posterior insula receives of information about temperature, itch, sensual touch, muscular and visceral sensations, vasomotor activity, hunger, thirst, and “air hunger” (Craig, 2003). For example, Olausson et al. (2002) observed activation in the posterior insula in a patient with a large fiber neuropathy when C-fibers responsive to low-threshold tactile stimuli were activated. Craig et al. (2000) found activation in a similar region associated with graded cooling stimuli. These and other observations led Craig to propose that the posterior insula represents the primary receiving area for an interoceptive system which reflects the state of internal organs and is associated with autonomic motor control (Craig, 2003). It is likely that the ST system is a major source of afferent signals for this interoceptive system.
It is important to note that many imaging studies of acute pain have reported activation not only in posterior regions comparable to Ig, but also in anterior portions of the insula (Peyron et al., 2000; Ostrowsky et al., 2002; Henderson et al., 2007). In addition, many of these studies observed bilateral activation in this region. Furthermore, recordings in S2 and Ig have found single neurons that have bilateral receptive fields (Robinson and Burton, 1980a; Schneider et al., 1993; Zhang et al., 1999). Thus, the distribution of ST input to the insula does not explain all of the patterns of activation in this region associated with acute pain. In this regard, it is important to remember that we have set the survival time to limit transneuronal transport of virus to third-order neurons. Single neuron recording and functional activation are not similarly constrained. Thus, much of the discrepancy between our anatomical results and the bilateral patterns of activation may be explained by fourth-order or longer connections.
S2
Almost 30% of the neurons labeled by anterograde transneuronal transport of virus from the spinal cord are located in another area within the lateral sulcus– S2 on the parietal operculum (upper bank of the lateral sulcus) (Fig. 12). Like the insula, S2 receives projections from thalamic nuclei that are the target of input from spinal cord neurons in laminae I and V (Fig. 12) (Friedman and Murray, 1986: Stevens et al., 1993; Craig, 2004, 2006). In meta-analyses of functional imaging studies, S2 is second only to the insula in its probability of activation by stimuli which induce acute pain (Peyron et al., 2000; Apkarian et al., 2005). Furthermore, like the posterior insula, electrical stimulation of S2 in humans can evoke painful sensations (Ostrowsky et al., 2002; Mazzola et al., 2006). Thus, our results support the view that the S2 is a second, distinct cortical site of nociceptive processing (Peyron et al., 2000; Apkarian et al., 2005).
One question raised by these results is whether Ig and S2 make differential contributions to nociceptive processing. Craig has suggested that the ST input to Ig originates largely from nociceptive and thermoceptive neurons in lamina I whereas ST input to S2 originates primarily from wide dynamic range neurons in lamina V (Craig, 2003, 2006; Craig and Zhang, 2006). On the other hand, functional imaging studies in humans have not reported clear differences in the types of stimuli that activate Ig and S2 (Peyron et al., 2000; Apkarian et al., 2005). Furthermore, recording studies in monkeys have failed to discover distinct differences between the response properties of neurons in or near Ig and S2 (Robinson and Burton, 1980b; Dong et al., 1989; Schneider et al., 1993; Zhang et al., 1999). Thus, additional information about the response properties of S2 and Ig neurons to noxious stimuli is required for any further speculation about the differential involvement of S2 and Ig in nociceptive processing.
S1
We confirmed that the various subdivisions of S1 (areas 3a, 3b, 1, 2) receive input from the ST system (Fig. 12) (Willis et al., 2002). However, our data indicate that this input is relatively weak. The number of neurons labeled in S1 by virus injections into the spinal cord is <6% of the number of neurons labeled in the lateral sulcus (Ig and S2). Consequently, our observations do not support the view that S1 is a major target of the ST system (see however, Gingold et al., 1991; Willis et al., 2002). For similar reasons, our data do not support the proposal that insular activation during imaging studies of pain processing is due to a serial flow of information from S1 and S2 to the insula (Willis et al., 2002). Instead, our results favor a direct pathway from the thalamus to the insula as the source of activation in these studies, and relegate S1 to a subordinate role in nociceptive processing.
Cingulate sulcus
The third major target of spinothalamic input (24% of the total) is cortex buried in mid regions of the cingulate sulcus (Fig. 12). This result is consistent with evidence that ST neurons in lamina I terminate in a thalamic region that projects to the cingulate sulcus (i.e., the ventrocaudal part of the medial dorsal nucleus [MDvc]) (Hatanaka et al., 2003; Craig, 2004). Also, regions of mid-cingulate cortex are consistently activated during imaging studies of acute pain (Peyron et al., 2000; Kwan et al., 2000; Büchel et al., 2002; Apkarian et al., 2005; Vogt, 2005) (Fig. 11). Painful laser stimulation evokes cortical potentials simultaneously in mid-cingulate cortex and in the S2/insula region (Frot et al., 2008). In addition, neuronal responses to noxious stimuli have been recorded in the mid-cingulate cortex in both monkeys and humans (Koyama et al., 1998; Hutchison et al., 1999). Thus, there is compelling evidence that regions of mid-cingulate cortex are the recipient of nociceptive information from the ST system.
Classically, the cingulate cortex has been considered to be part of the limbic system and to be involved in processing the affective-motivational aspects of pain (Peyron et al., 2000; Singer et al., 2004) (for review, see Vogt, 2005). Indeed, there is evidence that some activations in anterior cingulate cortex are modulated by pain unpleasantness (affect), whereas activations in somatosensory areas are generally modulated by pain intensity and localization (Rainville et al., 1997; Hofbauer et al., 2001; Kulkarni et al., 2005). On the other hand, we used a double labeling approach in monkeys to demonstrate that the ST input to the cingulate sulcus is directed solely to the cingulate motor areas. Thus, we find substantial overlap between an ascending afferent pathway involved in pain processing and the three cingulate motor areas that project both to the primary motor cortex and to the spinal cord (Dum and Strick, 1991, 1996, 2005; He et al., 1995). Furthermore, our meta-analysis showed that the human equivalents of the three cingulate motor areas correspond to sites of pain-related activation (Fig. 11). These results make it unlikely that the ST input to the cingulate sulcus is solely involved in affective-motivational aspects of pain.
Instead, several features of the cingulate motor areas reinforce the view that they are involved in motor control. The cingulate motor areas are somatotopically organized (Dum and Strick, 1991, 2005; He et al., 1995). Electrical stimulation of them in awake monkeys evokes specific limb movements (Luppino et al., 1991; Hatanaka et al., 2003), and in awake humans does not evoke reports of localized pain or unpleasant sensations (Hutchison et al., 1999). Many neurons in the cingulate motor areas, especially in the CMAd and CMAv, are well related to the preparation and execution of specific limb movements (Shima et al., 1991; Cadoret and Smith, 1997; Russo et al., 2002; Isomura et al., 2003). We have viewed the cingulate motor areas as nodes in a densely interconnected network that contributes to the generation and control of voluntary movement (Dum and Strick, 1991, 1996, 2005; Picard and Strick, 1996). This is especially the case for the CMAd and CMAv which have substantial connections with not only the primary motor cortex, but also with the PMd and PMv (Dum and Strick, 2005). Thus, ST input to the CMAd and CMAv may serve an integrative motor function which is unrelated to processing the experience of pain.
The view that ST input to the CMAd and CMAv is involved in sensorimotor integration fits with the concept that a portion of the ST system conveys information about the state of segmental interneurons involved in motor mechanisms such as spinal reflexes, locomotion and posture (Menétrey et al., 1984; Craig, 2008). Craig (2008) has proposed that a component of the ST system originates from neurons in laminae V and VII and primarily targets M1. However, our results suggest that the ST input to M1 is quite limited (see also Greenan and Strick, 1986; Stepniewska et al., 2003). Instead, the cortical motor areas that are the major target of ST input are the cingulate motor areas. The spinal laminae of origin for this input are unknown. If a component of the ST input to the CMAd and/or the CMAv originates from laminae V and VII, it could provide these areas with a corollary discharge reflecting spinal motor activity. This type of input could be used in a variety of ways including the adjustment of descending commands based on the status of spinal excitability.
The function of ST input to the CMAr may differ from that of the other cingulate motor areas. Some neurons in the CMAr show changes in activity related to attention for action and response selection based on reward value (Shima and Tanji, 1998; Akkal et al., 2002; Isomura et al., 2003; Amiez et al., 2006). The RCZa, the human equivalent of the CMAr, displays activation during tasks that involve a subject's evaluation of the consequences of their actions (Walton et al., 2004; Jocham et al., 2009). In this context, one could view ST input to the CMAr as highly salient feedback that indicates the consequences of an action and promotes adjustments in future behavior. In summary, the ST system targets multiple and diverse cortical areas and is likely to provide unique information to each area.
Footnotes
This work was supported in part by funds from the Office of Research and Development, Medical Research Service, Department of Veterans Affairs, National Institutes of Health Grants R01 NS24328 (P.L.S.), P40 RR018604 (P.L.S.), F30 NS043824 (D.J.L.), and T32 DK063922 (D.J.L.). This project was also funded, in part, under a grant with the Pennsylvania Department of Health. The Department specifically disclaims responsibility for any analyses, interpretations, or conclusions. We thank Dr. R. Dix (Georgia State University, Atlanta, GA) for supplying the H129 strain of HSV1. We also thank M. Page for the development of computer programs, P. Carras, M. O'Malley, and M. Watach for their expert technical assistance, Dr. K. Coffman for assisting in surgery, and Drs. R. Koerber and J. Roppolo for the loan of spinal stereotaxic equipment.
References
- Adler LJ, Gyulai FE, Diehl DJ, Mintun MA, Winter PM, Firestone LL. Regional brain activity changes associated with fentanyl analgesia elucidated by positron emission tomography. Anesth Analg. 1997;84:120–126. doi: 10.1097/00000539-199701000-00023. [DOI] [PubMed] [Google Scholar]
- Akkal D, Bioulac B, Audin J, Burbaud P. Comparison of neuronal activity in the rostral supplementary and cingulate motor areas during a task with cognitive and motor demands. Eur J Neurosci. 2002;15:887–904. doi: 10.1046/j.1460-9568.2002.01920.x. [DOI] [PubMed] [Google Scholar]
- Al-Chaer ED, Feng Y, Willis WD. A role for the dorsal column in nociceptive visceral input into the thalamus of primates. J Neurophysiol. 1998;79:3143–3150. doi: 10.1152/jn.1998.79.6.3143. [DOI] [PubMed] [Google Scholar]
- Al-Chaer ED, Feng Y, Willis WD. Comparative study of viscerosomatic input onto postsynaptic dorsal column and spinothalamic tract neurons in the primate. J Neurophysiol. 1999;82:1876–1882. doi: 10.1152/jn.1999.82.4.1876. [DOI] [PubMed] [Google Scholar]
- Amiez C, Joseph JP, Procyk E. Reward encoding in the monkey anterior cingulate cortex. Cereb Cortex. 2006;16:1040–1055. doi: 10.1093/cercor/bhj046. [DOI] [PMC free article] [PubMed] [Google Scholar]
- Andrew D, Krout KE, Craig AD. Differentiation of lamina I spinomedullary and spinothalamic neurons in the cat. J Comp Neurol. 2003;458:257–271. doi: 10.1002/cne.10592. [DOI] [PubMed] [Google Scholar]
- Apkarian AV, Hodge CJ. Primate spinothalamic pathways: I. A quantitative study of the cells of origin of the spinothalamic pathway. J Comp Neurol. 1989a;288:447–473. doi: 10.1002/cne.902880307. [DOI] [PubMed] [Google Scholar]
- Apkarian AV, Hodge CJ. Primate spinothalamic pathways: III. Thalamic terminations of the dorsolateral and ventral spinothalamic pathways. J Comp Neurol. 1989b;288:493–511. doi: 10.1002/cne.902880309. [DOI] [PubMed] [Google Scholar]
- Apkarian AV, Bushnell MC, Treede RD, Zubieta JK. Human brain mechanisms of pain perception and regulation in health and disease. Eur J Pain. 2005;9:463–484. doi: 10.1016/j.ejpain.2004.11.001. [DOI] [PubMed] [Google Scholar]
- Archin NM, Atherton SS. Rapid spread of a neurovirulent strain of HSV-1 through the CNS of BALB/c mice following anterior chamber inoculation. J Neurovirol. 2002;8:122–135. doi: 10.1080/13550280290049570. [DOI] [PubMed] [Google Scholar]
- Bantick SJ, Wise RG, Ploghaus A, Clare S, Smith SM, Tracey I. Imaging how attention modulates pain in humans using functional MRI. Brain. 2002;125:310–319. doi: 10.1093/brain/awf022. [DOI] [PubMed] [Google Scholar]
- Barbas H, Saha S, Rempel-Clower N, Ghashghaei T. Serial pathways from primate prefrontal cortex to autonomic areas may influence emotional expression. BMC Neurosci. 2003;10:25. doi: 10.1186/1471-2202-4-25. [DOI] [PMC free article] [PubMed] [Google Scholar]
- Barnett EM, Evans GD, Sun N, Perlman S, Cassell MD. Anterograde tracing of trigeminal afferent pathways from the murine tooth pulp to cortex using herpes simplex virus type 1. J Neurosci. 1995;15:2972–2984. doi: 10.1523/JNEUROSCI.15-04-02972.1995. [DOI] [PMC free article] [PubMed] [Google Scholar]
- Becerra LR, Breiter HC, Stojanovic M, Fishman S, Edwards A, Comite AR, Gonzalez RG, Borsook D. Human brain activation under controlled thermal stimulation and habituation to noxious heat: an fMRI study. Magn Reson Med. 1999;41:1044–1057. doi: 10.1002/(sici)1522-2594(199905)41:5<1044::aid-mrm25>3.0.co;2-m. [DOI] [PubMed] [Google Scholar]
- Berkley KJ. Spatial relationships between the terminations of somatic sensory and motor pathways in the rostral brainstem of cats and monkeys. I. Ascending somatic sensory inputs to lateral diencephalon. J Comp Neurol. 1980;193:283–317. doi: 10.1002/cne.901930119. [DOI] [PubMed] [Google Scholar]
- Brooks JC, Nurmikko TJ, Bimson WE, Singh KD, Roberts N. fMRI of thermal pain: effects of stimulus laterality and attention. Neuroimage. 2002;15:293–301. doi: 10.1006/nimg.2001.0974. [DOI] [PubMed] [Google Scholar]
- Büchel C, Bornhovd K, Quante M, Glauche V, Bromm B, Weiller C. Dissociable neural responses related to pain intensity, stimulus intensity, and stimulus awareness within the anterior cingulate cortex: a parametric single-trial laser functional magnetic resonance imaging study. J Neurosci. 2002;22:970–976. doi: 10.1523/JNEUROSCI.22-03-00970.2002. [DOI] [PMC free article] [PubMed] [Google Scholar]
- Burstein R, Cliffer KD, Giesler GJ., Jr Direct somatosensory projections from the spinal cord to the hypothalamus and telencephalon. J Neurosci. 1987;7:4159–4164. doi: 10.1523/JNEUROSCI.07-12-04159.1987. [DOI] [PMC free article] [PubMed] [Google Scholar]
- Burton H, Fabri M, Alloway K. Cortical areas within the lateral sulcus connected to cutaneous representations in areas 3b and 1: a revised interpretation of the second somatosensory area in macaque monkeys. J Comp Neurol. 1995;355:539–562. doi: 10.1002/cne.903550405. [DOI] [PubMed] [Google Scholar]
- Cadoret G, Smith AM. Comparison of the neuronal activity in the SMA and the ventral cingulate cortex during prehension in the monkey. J Neurophysiol. 1997;77:153–166. doi: 10.1152/jn.1997.77.1.153. [DOI] [PubMed] [Google Scholar]
- Casey KL, Minoshima S, Morrow TJ, Koeppe RA. Comparison of human cerebral activation patterns during cutaneous warmth, heat pain and deep cold pain. J Neurophysiol. 1996;76:571–581. doi: 10.1152/jn.1996.76.1.571. [DOI] [PubMed] [Google Scholar]
- Casey KL, Morrow TJ, Lorenz J, Minoshima S. Temporal and spatial dynamics of human forebrain activity during heat pain: analysis by positron emission tomography. J Neurophysiol. 2001;85:951–959. doi: 10.1152/jn.2001.85.2.951. [DOI] [PubMed] [Google Scholar]
- Coghill RC, Talbot JD, Evans AC, Meyer E, Gjedde A, Bushnell MC, Duncan GH. Distributed processing of pain and vibration by the human brain. J Neurosci. 1994;14:4095–4108. doi: 10.1523/JNEUROSCI.14-07-04095.1994. [DOI] [PMC free article] [PubMed] [Google Scholar]
- Coghill RC, Sang CN, Maisog JM, Iadarola MJ. Pain intensity processing within the human brain: a bilateral, distributed mechanism. J Neurophysiol. 1999;82:1934–1943. doi: 10.1152/jn.1999.82.4.1934. [DOI] [PubMed] [Google Scholar]
- Condé F. Further studies on the use of the fluorescent tracers fast blue and diamidino yellow: effective uptake area and cellular storage sites. J Neurosci Methods. 1987;21:31–43. doi: 10.1016/0165-0270(87)90100-2. [DOI] [PubMed] [Google Scholar]
- Craig AD. Distribution of brainstem projections from spinal lamina I neurons in the cat and the monkey. J Comp Neurol. 1995;361:225–248. doi: 10.1002/cne.903610204. [DOI] [PubMed] [Google Scholar]
- Craig AD. Pain mechanisms: labeled lines versus convergence in central processing. Annu Rev Neurosci. 2003;26:1–30. doi: 10.1146/annurev.neuro.26.041002.131022. [DOI] [PubMed] [Google Scholar]
- Craig AD. Distribution of trigeminothalamic and spinothalamic lamina I terminations in the macaque monkey. J Comp Neurol. 2004;477:119–148. doi: 10.1002/cne.20240. [DOI] [PubMed] [Google Scholar]
- Craig AD. Retrograde analyses of spinothalamic projections in the macaque monkey: input to ventral posterior nuclei. J Comp Neurol. 2006;499:965–978. doi: 10.1002/cne.21154. [DOI] [PubMed] [Google Scholar]
- Craig AD. Retrograde analyses of spinothalamic projections in the macaque monkey: input to the ventral lateral nucleus. J Comp Neurol. 2008;508:315–328. doi: 10.1002/cne.21672. [DOI] [PubMed] [Google Scholar]
- Craig AD, Zhang ET. Retrograde analyses of spinothalamic projections in the macaque monkey: input to posterolateral thalamus. J Comp Neurol. 2006;499:953–964. doi: 10.1002/cne.21155. [DOI] [PubMed] [Google Scholar]
- Craig AD, Reiman EM, Evans A, Bushnell MC. Functional imaging of an illusion of pain. Nature. 1996;384:258–260. doi: 10.1038/384258a0. [DOI] [PubMed] [Google Scholar]
- Craig AD, Chen K, Bandy D, Reiman EM. Thermosensory activation of insular cortex. Nat Neurosci. 2000;3:184–190. doi: 10.1038/72131. [DOI] [PubMed] [Google Scholar]
- Derbyshire SW, Jones AK. Cerebral responses to a continual tonic pain stimulus measured using positron emission tomography. Pain. 1998;76:127–135. doi: 10.1016/s0304-3959(98)00034-7. [DOI] [PubMed] [Google Scholar]
- Derbyshire SW, Jones AK, Devani P, Friston KJ, Feinmann C, Harris M, Pearce S, Watson JD, Frackowiak RS. Cerebral responses to pain in patients with atypical facial pain measured by positron emission tomography. J Neurol Neurosurg Psychiatry. 1994;57:1166–1172. doi: 10.1136/jnnp.57.10.1166. [DOI] [PMC free article] [PubMed] [Google Scholar]
- Derbyshire SW, Jones AK, Gyulai F, Clarck S, Townsend D, Firestone LL. Pain processing during three levels of noxious stimulation produces differential patterns of central activity. Pain. 1997;73:431–445. doi: 10.1016/S0304-3959(97)00138-3. [DOI] [PubMed] [Google Scholar]
- Derbyshire SW, Vogt BA, Jones AK. Pain and Stroop interference tasks activate separate processing modules in anterior cingulate cortex. Exp Brain Res. 1998;118:52–60. doi: 10.1007/s002210050254. [DOI] [PubMed] [Google Scholar]
- Dong WK, Salonen LD, Kawakami Y, Shiwaku T, Kaukoranta EM, Martin RF. Nociceptive responses of trigeminal neurons in SII-7b cortex of awake monkeys. Brain Res. 1989;484:314–324. doi: 10.1016/0006-8993(89)90375-2. [DOI] [PubMed] [Google Scholar]
- Dum RP, Strick PL. The origin of corticospinal projections from the premotor areas in the frontal lobe. J Neurosci. 1991;11:667–689. doi: 10.1523/JNEUROSCI.11-03-00667.1991. [DOI] [PMC free article] [PubMed] [Google Scholar]
- Dum RP, Strick PL. Spinal cord terminations of the medial wall motor areas in macaque monkeys. J Neurosci. 1996;16:6513–6525. doi: 10.1523/JNEUROSCI.16-20-06513.1996. [DOI] [PMC free article] [PubMed] [Google Scholar]
- Dum RP, Strick PL. Frontal lobe inputs to the digit representations in the motor areas on the lateral surface of the hemisphere. J Neurosci. 2005;25:1375–1386. doi: 10.1523/JNEUROSCI.3902-04.2005. [DOI] [PMC free article] [PubMed] [Google Scholar]
- Faymonville ME, Laureys S, Degueldre C, DelFiore G, Luxen A, Franck G, Lamy M, Maquet P. Neural mechanisms of antinociceptive effects of hypnosis. Anesthesiology. 2000;92:1257–1267. doi: 10.1097/00000542-200005000-00013. [DOI] [PubMed] [Google Scholar]
- Friedman DP, Murray EA. Thalamic connectivity of the second somatosensory area and neighboring somatosensory fields of the lateral sulcus of the macaque. J Comp Neurol. 1986;252:348–373. doi: 10.1002/cne.902520305. [DOI] [PubMed] [Google Scholar]
- Frot M, Mauguière F, Magnin M, Garcia-Larrea L. Parallel processing of nociceptive A-delta inputs in SII and midcingulate cortex in humans. J Neurosci. 2008;28:944–952. doi: 10.1523/JNEUROSCI.2934-07.2008. [DOI] [PMC free article] [PubMed] [Google Scholar]
- Ganchrow D. Intratrigeminal and thalamic projections of nucleus caudalis in the squirrel monkey (Saimiri sciureus): a degeneration and autoradiographic study. J Comp Neurol. 1978;178:281–312. doi: 10.1002/cne.901780206. [DOI] [PubMed] [Google Scholar]
- Garner JA, LaVail JH. Differential anterograde transport of HSV type 1 viral strains in the murine optic pathway. J Neurovirol. 1999;5:140–150. doi: 10.3109/13550289909021996. [DOI] [PubMed] [Google Scholar]
- Gauriau C, Bernard JF. Pain pathways and parabrachial circuits in the rat. Exp Physiol. 2002;87:251–258. doi: 10.1113/eph8702357. [DOI] [PubMed] [Google Scholar]
- Gingold SI, Greenspan JD, Apkarian AV. Anatomic evidence of nociceptive inputs to primary somatosensory cortex: relationship between spinothalamic terminals and thalamocortical cells in squirrel monkeys. J Comp Neurol. 1991;308:467–490. doi: 10.1002/cne.903080312. [DOI] [PubMed] [Google Scholar]
- Greenan TJ, Strick PL. Do thalamic regions which project to rostral primate motor cortex receive spinothalamic input? Brain Res. 1986;362:384–388. doi: 10.1016/0006-8993(86)90469-5. [DOI] [PubMed] [Google Scholar]
- Hatanaka N, Tokuno H, Hamada I, Inase M, Ito Y, Imanishi M, Hasegawa N, Akazawa T, Nambu A, Takada M. Thalamocortical and intracortical connections of monkey cingulate motor areas. J Comp Neurol. 2003;462:121–138. doi: 10.1002/cne.10720. [DOI] [PubMed] [Google Scholar]
- Hayes NL, Rustioni A. Spinothalamic and spinomedullary neurons in macaques: a single and double retrograde tracer study. Neurosci. 1981;5:861–874. doi: 10.1016/0306-4522(80)90155-4. [DOI] [PubMed] [Google Scholar]
- He SQ, Dum RP, Strick PL. Topographic organization of corticospinal projections from the frontal lobe: motor areas on the lateral surface of the hemisphere. J Neurosci. 1993;13:952–980. doi: 10.1523/JNEUROSCI.13-03-00952.1993. [DOI] [PMC free article] [PubMed] [Google Scholar]
- He SQ, Dum RP, Strick PL. Topographic organization of corticospinal projections from the frontal lobe: motor areas on the medial surface of the hemisphere. J Neurosci. 1995;15:3284–3306. doi: 10.1523/JNEUROSCI.15-05-03284.1995. [DOI] [PMC free article] [PubMed] [Google Scholar]
- Henderson LA, Gandevia SC, Macefield VG. Somatotopic organization of the processing of muscle and cutaneous pain in the left and right insula cortex: a single-trial fMRI study. Pain. 2007;128:20–30. doi: 10.1016/j.pain.2006.08.013. [DOI] [PubMed] [Google Scholar]
- Hofbauer RK, Rainville P, Duncan GH, Bushnell MC. Cortical representation of the sensory dimension of pain. J Neurophysiol. 2001;86:402–411. doi: 10.1152/jn.2001.86.1.402. [DOI] [PubMed] [Google Scholar]
- Hsieh JC, Ståhle-Bäckdahl MS, Hägermark Ö, Stone-Elander S, Rosenquist G, Ingvar M. Traumatic nociceptive pain activates the hypothalamus and the periaqueductal gray: a positron emission tomography study. Pain. 1996;64:303–314. doi: 10.1016/0304-3959(95)00129-8. [DOI] [PubMed] [Google Scholar]
- Huisman AM, Kuypers HG, Condé F, Keizer K. Collaterals of rubrospinal neurons to the cerebellum in rat. A retrograde fluorescent double labeling study. Brain Res. 1983;264:181–196. doi: 10.1016/0006-8993(83)90816-8. [DOI] [PubMed] [Google Scholar]
- Hutchison WD, Davis KD, Lozano AM, Tasker RR, Dostrovsky JO. Pain-related neurons in the human cingulate cortex. Nat Neurosci. 1999;2:403–405. doi: 10.1038/8065. [DOI] [PubMed] [Google Scholar]
- Iadarola MJ, Berman KF, Zeffiro TA, Byas-Smith MG, Gracely RH, Max MB, Bennett GJ. Neural activation during acute capsaicin-evoked pain and allodynia assessed with PET. Brain. 1998;121:931–947. doi: 10.1093/brain/121.5.931. [DOI] [PubMed] [Google Scholar]
- Isomura Y, Ito Y, Akazawa T, Nambu A, Takada M. Neural coding of “attention for action” and “response selection” in primate anterior cingulate cortex. J Neurosci. 2003;23:8002–8012. doi: 10.1523/JNEUROSCI.23-22-08002.2003. [DOI] [PMC free article] [PubMed] [Google Scholar]
- Jocham G, Neumann J, Klein TA, Danielmeier C, Ullsperger M. Adaptive coding of action values in the human rostral cingulate zone. J Neurosci. 2009;29:7489–7496. doi: 10.1523/JNEUROSCI.0349-09.2009. [DOI] [PMC free article] [PubMed] [Google Scholar]
- Jones EG. Ed 2. New York: Cambridge UP; 2007. The thalamus; p. 1708. [Google Scholar]
- Kelly RM, Strick PL. Rabies as a transneuronal tracer of circuits in the central nervous system. J Neurosci Methods. 2000;103:63–71. doi: 10.1016/s0165-0270(00)00296-x. [DOI] [PubMed] [Google Scholar]
- Kelly RM, Strick PL. Cerebellar ‘loops’ with motor cortex and prefrontal cortex of a non-human primate. J Neurosci. 2003;23:8432–8444. doi: 10.1523/JNEUROSCI.23-23-08432.2003. [DOI] [PMC free article] [PubMed] [Google Scholar]
- Kievit J, Kuypers HG. Basal forebrain and hypothalamic connection to frontal and parietal cortex in the Rhesus monkey. Science. 1975;187:660–662. doi: 10.1126/science.1114317. [DOI] [PubMed] [Google Scholar]
- Koyama T, Tanaka YZ, Mikami A. Nociceptive neurons in the macaque anterior cingulate activate during anticipation of pain. Neuroreport. 1998;9:2663–2667. doi: 10.1097/00001756-199808030-00044. [DOI] [PubMed] [Google Scholar]
- Krubitzer L, Clarey J, Tweedale R, Elston G, Calford M. A redefinition of somatosensory areas in the lateral sulcus of macaque monkeys. J Neurosci. 1995;15:3821–3839. doi: 10.1523/JNEUROSCI.15-05-03821.1995. [DOI] [PMC free article] [PubMed] [Google Scholar]
- Kulkarni B, Bentley DE, Elliott R, Youell P, Watson A, Derbyshire SW, Frackowiak RS, Friston KJ, Jones AK. Attention to pain localization and unpleasantness discriminates the functions of the medial and lateral pain systems. Eur J Neurosci. 2005;21:3133–3142. doi: 10.1111/j.1460-9568.2005.04098.x. [DOI] [PubMed] [Google Scholar]
- Kurata J, Thulborn KR, Gyulai FE, Firestone LL. Early decay of pain-related cerebral activation in functional magnetic resonance imaging. Anesthesiology. 2002;96:35–44. doi: 10.1097/00000542-200201000-00012. [DOI] [PubMed] [Google Scholar]
- Kuypers HGJM, Huisman AM. Fluorescent neuronal tracers. Adv Cell Neurobiol. 1984;5:307–340. [Google Scholar]
- Kwan CL, Crawley AP, Mikulis DJ, Davis KD. An fMRI study of the anterior cingulate cortex and surrounding medial wall activations evoked by noxious cutaneous heat and cold stimuli. Pain. 2000;85:359–374. doi: 10.1016/S0304-3959(99)00287-0. [DOI] [PubMed] [Google Scholar]
- LaVail JH, Topp KS, Giblin PA, Garner JA. Factors that contribute to the transneuronal spread of herpes simplex virus. J Neurosci Res. 1997;49:485–496. [PubMed] [Google Scholar]
- Luppino G, Matelli M, Camarda RM, Gallese V, Rizzolatti G. Multiple representations of body movements in mesial area 6 and adjacent cingulate cortex: an intracortical microstimulation study in the macaque monkey. J Comp Neurol. 1991;311:463–482. doi: 10.1002/cne.903110403. [DOI] [PubMed] [Google Scholar]
- Mantyh PW. The spinothalamic tract in the primate: a re-examination using wheatgerm agglutinin conjugated to horseradish peroxidase. Neuroscience. 1983;9:847–862. doi: 10.1016/0306-4522(83)90273-7. [DOI] [PubMed] [Google Scholar]
- Mazzola L, Isnard J, Mauguière F. Somatosensory and pain responses to stimulation of the second somatosensory area (SII) in humans. A comparison with SI and insular responses. Cereb Cortex. 2006;16:960–968. doi: 10.1093/cercor/bhj038. [DOI] [PubMed] [Google Scholar]
- Menétrey D, de Pommery J, Roudier F. Properties of deep spinothalamic tract cells in the rat, with special reference to ventromedial zone of lumbar dorsal horn. J Neurophysiol. 1984;52:612–624. doi: 10.1152/jn.1984.52.4.612. [DOI] [PubMed] [Google Scholar]
- Mesulam MM, Mufson EJ. Insula of the old world monkey. I. Architectonics in the insulo-orbito-temporal component of the paralimbic brain. J Comp Neurol. 1982;212:1–22. doi: 10.1002/cne.902120102. [DOI] [PubMed] [Google Scholar]
- Mufson EJ, Mesulam MM. Thalamic connections of the insula in the rhesus monkey and comments on the paralimbic connectivity of the medial pulvinar nucleus. J Comp Neurol. 1984;227:109–120. doi: 10.1002/cne.902270112. [DOI] [PubMed] [Google Scholar]
- Newman HM, Stevens RT, Apkarian AV. Direct spinal projections to limbic and striatal areas: anterograde transport studies from the upper cervical spinal cord and the cervical enlargement in squirrel monkey and rat. J Comp Neurol. 1996;365:640–658. doi: 10.1002/(SICI)1096-9861(19960219)365:4<640::AID-CNE10>3.0.CO;2-L. [DOI] [PubMed] [Google Scholar]
- Olausson H, Lamarre Y, Backlund H, Morin C, Wallin BG, Starck G, Ekholm S, Strigo I, Worsley K, Vallbo AB, Bushnell MC. Unmyelinated tactile afferents signal touch and project to insular cortex. Nat Neurosci. 2002;5:900–904. doi: 10.1038/nn896. [DOI] [PubMed] [Google Scholar]
- Ostrowsky K, Magnin M, Ryvlin P, Isnard J, Guenot M, Mauguière F. Representation of pain and somatic sensation in the human insula: a study of responses to direct electrical cortical stimulation. Cereb Cortex. 2002;12:376–385. doi: 10.1093/cercor/12.4.376. [DOI] [PubMed] [Google Scholar]
- Paulson PE, Minoshima S, Morrow TJ, Casey KL. Gender differences in pain perception and patterns of cerebral activation during noxious heat stimulation in humans. Pain. 1998;76:223–229. doi: 10.1016/s0304-3959(98)00048-7. [DOI] [PMC free article] [PubMed] [Google Scholar]
- Petrovic P, Kalso E, Petersson KM, Ingvar M. Placebo and opioid analgesia—imaging a shared neuronal network. Science. 2002;295:1737–1740. doi: 10.1126/science.1067176. [DOI] [PubMed] [Google Scholar]
- Peyron R, Laurent B, García-Larrea L. Functional imaging of brain responses to pain. A review and meta-analysis. Neurophysiol Clin. 2000;30:263–288. doi: 10.1016/s0987-7053(00)00227-6. [DOI] [PubMed] [Google Scholar]
- Picard N, Strick PL. Motor areas of the medial wall: a review of location and functional activation. Cereb Cortex. 1996;6:342–353. doi: 10.1093/cercor/6.3.342. [DOI] [PubMed] [Google Scholar]
- Ploghaus A, Tracey I, Gati JS, Clare S, Menon RS, Matthews PM, Nicholas J, Rawlins JN. Dissociating pain from its anticipation in the human brain. Science. 1999;284:1979–1981. doi: 10.1126/science.284.5422.1979. [DOI] [PubMed] [Google Scholar]
- Pritchard TC, Hamilton RB, Norgren R. Projections of the parabrachial nucleus in the old world monkey. Exp Neurol. 2000;165:101–117. doi: 10.1006/exnr.2000.7450. [DOI] [PubMed] [Google Scholar]
- Rainville P, Duncan GH, Price DD, Carrier B, Bushnell MC. Pain affect encoded in human anterior cingulate but not somatosensory cortex. Science. 1997;277:968–971. doi: 10.1126/science.277.5328.968. [DOI] [PubMed] [Google Scholar]
- Rempel-Clower NL, Barbas H. Topographic organization of connections between the hypothalamus and prefrontal cortex in the rhesus monkey. J Comp Neurol. 1998;398:393–419. doi: 10.1002/(sici)1096-9861(19980831)398:3<393::aid-cne7>3.0.co;2-v. [DOI] [PubMed] [Google Scholar]
- Rinaman L, Schwartz G. Anterograde transneuronal viral tracing of central viscerosensory pathways in rats. J Neurosci. 2004;24:2782–2786. doi: 10.1523/JNEUROSCI.5329-03.2004. [DOI] [PMC free article] [PubMed] [Google Scholar]
- Robinson CJ, Burton H. Somatotopographic organization in the second somatosensory area of M. fascicularis. J Comp Neurol. 1980a;192:43–67. doi: 10.1002/cne.901920104. [DOI] [PubMed] [Google Scholar]
- Robinson CJ, Burton H. Somatic submodality distribution within the second somatosensory (SII), 7b, retroinsular, postauditory, and granular insular cortical areas of M. fascicularis. J Comp Neurol. 1980b;192:93–108. doi: 10.1002/cne.901920106. [DOI] [PubMed] [Google Scholar]
- Russo GS, Backus DA, Ye S, Crutcher MD. Neural activity in monkey dorsal and ventral cingulate motor areas: comparison with the supplementary motor area. J Neurophysiol. 2002;88:2612–2629. doi: 10.1152/jn.00306.2002. [DOI] [PubMed] [Google Scholar]
- Schneider RJ, Friedman DP, Mishkin M. A modality-specific somatosensory area within the insula of the rhesus monkey. Brain Res. 1993;621:116–120. doi: 10.1016/0006-8993(93)90305-7. [DOI] [PubMed] [Google Scholar]
- Shima K, Tanji J. Role for cingulate motor area cells in voluntary movement selection based on reward. Science. 1998;282:1335–1338. doi: 10.1126/science.282.5392.1335. [DOI] [PubMed] [Google Scholar]
- Shima K, Aya K, Mushiake H, Inase M, Aizawa H, Tanji J. Two movement-related foci in the primate cingulate cortex observed in signal-triggered and self-paced forelimb movements. J Neurophysiol. 1991;65:188–202. doi: 10.1152/jn.1991.65.2.188. [DOI] [PubMed] [Google Scholar]
- Singer T, Seymour B, O'Doherty J, Kaube H, Dolan RJ, Frith CD. Empathy for pain involves the affective but not sensory components of pain. Science. 2004;303:1157–1162. doi: 10.1126/science.1093535. [DOI] [PubMed] [Google Scholar]
- Stepniewska I, Sakai ST, Qi HX, Kaas JH. Somatosensory input to the ventrolateral thalamic region in the macaque monkey: potential substrate for parkinsonian tremor. J Comp Neurol. 2003;455:378–395. doi: 10.1002/cne.10499. [DOI] [PubMed] [Google Scholar]
- Stevens RT, London SM, Apkarian AV. Spinothalamocortical projections to the secondary somatosensory cortex (SII) in squirrel monkey. Brain Res. 1993;631:241–246. doi: 10.1016/0006-8993(93)91541-y. [DOI] [PubMed] [Google Scholar]
- Sun N, Cassell MD, Perlman S. Anterograde, transneuronal transport of herpes simplex virus type 1 strain H129 in the murine visual system. J Virol. 1996;70:5405–5413. doi: 10.1128/jvi.70.8.5405-5413.1996. [DOI] [PMC free article] [PubMed] [Google Scholar]
- Svensson P, Minoshima S, Beydoun A, Morrow TJ, Casey KL. Cerebral processing of acute skin and muscle pain in humans. J Neurophysiol. 1997;78:450–460. doi: 10.1152/jn.1997.78.1.450. [DOI] [PubMed] [Google Scholar]
- Svensson P, Johannsen P, Jensen TS, Arendt-Nielsen L, Nielsen J, Stødkilde-Jørgensen H, Gee AD, Baarsgaard Hansen S, Gjedde A. Cerebral blood-flow changes evoked by two levels of painful heat stimulation: a positron emission tomography study in humans. Eur J Pain. 1998;2:95–107. doi: 10.1016/s1090-3801(98)90001-5. [DOI] [PubMed] [Google Scholar]
- Talairach J, Tournoux P. Stuttgart: Thieme; 1988. Coplanar stereotaxic atlas of the human brain. [Google Scholar]
- Talbot JD, Marrett S, Evans AC, Meyer E, Bushnell MC, Duncan GH. Multiple representations of pain in human cerebral cortex. Science. 1991;251:1355–1358. doi: 10.1126/science.2003220. [DOI] [PubMed] [Google Scholar]
- Tölle TR, Kaufmann T, Siessmeier T, Lautenbacher S, Berthele A, Munz F, Zieglgänsberger W, Willoch F, Schwaiger M, Conrad B, Bartenstein P. Region-specific encoding of sensory and affective components of pain in the human brain: a positron emission tomography correlation analysis. Ann Neurol. 1999;45:40–47. doi: 10.1002/1531-8249(199901)45:1<40::aid-art8>3.0.co;2-l. [DOI] [PubMed] [Google Scholar]
- Tracey I, Becerra L, Chang I, Breiter H, Jenkins L, Borsook D, González RG. Noxious hot and cold stimulation produce common patterns of brain activation in humans: a functional magnetic resonance imaging study. Neurosci Lett. 2000;288:159–162. doi: 10.1016/s0304-3940(00)01224-6. [DOI] [PubMed] [Google Scholar]
- Vogt BA. Pain and emotion interactions in subregions of the cingulate gyrus. Nat Rev Neurosci. 2005;6:533–544. doi: 10.1038/nrn1704. [DOI] [PMC free article] [PubMed] [Google Scholar]
- Vogt BA, Derbyshire S, Jones AK. Pain processing in four regions of human cingulate cortex localized with co-registered PET and MR imaging. Eur J Neurosci. 1996;8:1461–1473. doi: 10.1111/j.1460-9568.1996.tb01608.x. [DOI] [PubMed] [Google Scholar]
- Walton ME, Devlin JT, Rushworth MF. Interactions between decision making and performance monitoring within prefrontal cortex. Nat Neurosci. 2004;7:1259–1265. doi: 10.1038/nn1339. [DOI] [PubMed] [Google Scholar]
- Willis WD, Kenshalo DR, Jr, Leonard RB. The cells of origin of the primate spinothalamic tract. J Comp Neurol. 1979;188:543–573. doi: 10.1002/cne.901880404. [DOI] [PubMed] [Google Scholar]
- Willis WD, Al-Chaer ED, Quast MJ, Westlund KN. A visceral pain pathway in the dorsal column of the spinal cord. Proc Natl Acad Sci U S A. 1999;96:7675–7679. doi: 10.1073/pnas.96.14.7675. [DOI] [PMC free article] [PubMed] [Google Scholar]
- Willis WD, Jr, Zhang X, Honda CN, Giesler GJ., Jr Projections from the marginal zone and deep dorsal horn to the ventrobasal nuclei of the primate thalamus. Pain. 2001;92:267–276. doi: 10.1016/s0304-3959(01)00268-8. [DOI] [PubMed] [Google Scholar]
- Willis WD, Zhang X, Honda CN, Giesler GJ. A critical review of the role of the proposed VMpo nucleus in pain. J Pain. 2002;3:79–94. doi: 10.1054/jpai.2002.122949. [DOI] [PubMed] [Google Scholar]
- Xu X, Fukuyama H, Yazawa S, Mima T, Hanakawa T, Magata Y, Kanda M, Fujiwara N, Shindo K, Nagamine T, Shibasaki H. Functional localization of pain perception in the human brain studied by PET. Neuroreport. 1997;8:555–559. doi: 10.1097/00001756-199701200-00035. [DOI] [PubMed] [Google Scholar]
- Yezierski RP. Spinomesencephalic tract: projections from the lumbosacral spinal cord of the rat, cat, and monkey. J Comp Neurol. 1988;267:131–146. doi: 10.1002/cne.902670109. [DOI] [PubMed] [Google Scholar]
- Yezierski RP, Sorkin LS, Willis WD. Response properties of spinal neurons projecting to midbrain or midbrain-thalamus in the monkey. Brain Res. 1987;437:165–170. doi: 10.1016/0006-8993(87)91539-3. [DOI] [PubMed] [Google Scholar]
- Zemanick MC, Strick PL, Dix RD. Direction of transneuronal transport of herpes simplex virus 1 in the primate motor system is strain-dependent. Proc Natl Acad Sci U S A. 1991;88:8048–8051. doi: 10.1073/pnas.88.18.8048. [DOI] [PMC free article] [PubMed] [Google Scholar]
- Zhang ZH, Dougherty PM, Oppenheimer SM. Monkey insular cortex neurons respond to baroreceptive and somatosensory convergent inputs. Neuroscience. 1999;94:351–360. doi: 10.1016/s0306-4522(99)00339-5. [DOI] [PubMed] [Google Scholar]