Abstract
The elementary Ca2+ release events underlying voltage activated myoplasmic Ca2+ transients in mammalian muscle still remain elusive. Here we looked for such events in confocal line-scan (x,t) images of fluo-3 fluorescence taken from isolated adult mouse skeletal muscle fibers held under voltage-clamp conditions. In response to step depolarizations spatially segregated fluorescence signals could be detected that were riding on a global increase in fluorescence. These discrete signals were separated using digital filtering in the spatial domain; mean values for their spatial half-width and amplitude were 1.99 ± 0.09 μm and 0.16 ± 0.005 ΔF/F0 (n=151), respectively. Under control conditions, the duration of the events was limited by the pulse duration, In contrast, in the presence of maurocalcine, a scorpion toxin suspected to disrupt the process of repolarization-induced ryanodine receptor closure, events uninterrupted by the end of the pulse were readily detected. Overall results establish these voltage-activated low amplitude local Ca2+ signals as inherent components of the physiological Ca2+ release process of mammalian muscle and suggest that they result from the opening of either one ryanodine receptor or of a coherently operating group of RyRs, under the control of the plasma membrane polarization.
Keywords: Animals; Calcium; metabolism; Electrophysiology; methods; Mice; Microscopy, Confocal; Muscle Contraction; physiology; Muscle Fibers, Skeletal; metabolism; physiology; Ryanodine Receptor Calcium Release Channel; physiology; Time Factors
Keywords: Excitation-contraction coupling, mammalian skeletal muscle, voltage-clamp, intracellular Ca2+, confocal imaging.dihydropyridine receptor, ryanodine receptor
INTRODUCTION
In skeletal muscle, contractile activation is triggered by an increase in myoplasmic Ca2+ concentration due to a Ca2+ flux from the sarcoplasmic reticulum (SR), through the ryanodine receptor Ca2+ release channels. This flux is activated upon depolarization of the plasma membrane through interactions between the voltage-sensing dihydropyridine receptors (DHPRs) and the ryanodine receptors (RyRs). Within the past decade the advent of confocal imaging technology has allowed the detection of the elementary activity of intracellular Ca2+ release channels in living cells, which revolutionized our perception and understanding of the physiological properties and function of these proteins (see for instance Berridge, 2006). Indeed, the possibility to detect such elementary signals is of highest interest because it provides a unique access to the unitary properties of the channels in their native environment. In this regard, the elementary voltage-activated Ca2+ release events from the SR of skeletal muscle were rapidly identified in isolated frog muscle fibers using a combination of intracellular [Ca2+] detection under confocal microscopy together with voltage-clamp (Tsugorka et al., 1995; Klein et al., 1996). In this preparation the global myoplasmic Ca2+ transient builds up as an accumulation of stereotyped discrete Ca2+ release events, the Ca2+ sparks, which, since then, have been extensively characterized (see for recent reviews Baylor, 2005; Klein and Schneider, 2006; Csernoch, 2007). Unexpectedly the situation in mammalian muscle came out to be somewhat more complicated and confusing: in rat fibers, voltage-activated elementary Ca2+ release events were first thought to be unresolvable (Shirokova et al., 1998) and then a class of local fluorescence signals yielding very different properties from the amphibian Ca2+ sparks were suggested to correspond to the unitary events in this preparation (Csernoch et al., 2004). The difference between the frog and the rat may be due to a different composition in RyR isoforms (see for instance Pouvreau et al., 2007) but also to other still misunderstood discrepancies in the mechanisms that control the gating of the RyRs in the two preparations. Further investigation of the properties of the elementary calcium release events in mammalian muscle is certainly a key to the comprehension of these differences but also to a full understanding of skeletal muscle function under normal and pathological conditions. The present study aimed at characterizing the properties of the elementary Ca2+ release events in intact mouse skeletal muscle fibers. We show that, in this preparation, signals having the properties of the previously described “embers” (Gonzalez et al., 2000; Zhou et al., 2003) are activated by membrane depolarization and interrupted by membrane repolarization. A characterization of the properties of these events should be inherent to future studies concerning the in vivo function and regulation of the RyR in mammalian muscle. A part of this work has been presented to the Biophysical Society (Csernoch et al., 2006).
MATERIALS AND METHODS
Isolation of the muscle fibers
Most of the experiments were performed on single skeletal fibers isolated from the flexor digitorum brevis muscles of wild-type (Swiss-OF1) male mice. A specific subset of measurements was achieved on fibers isolated from frog toe muscles. All experiments were performed in accordance with the guidelines of the French Ministry of Agriculture (87/848) and of the European Community (86/609/EEC). In brief, mice were killed by cervical dislocation after halothane anesthesia. The muscles were removed and treated with collagenase (Sigma type 1, Sigma-Aldrich, Saint Quentin Fallavier, France) for 60–75 min at 37°C in the presence of Tyrode as external solution. Single fibers were then obtained by triturating the muscles within the experimental chamber. Frog toe muscles were dissected and treated with collagenase using identical procedures.
Preparation of skinned muscle fibers
Single fibers, isolated as detailed above, were mounted into a petri-dish with a glass cover-slip bottom. Fibers were bathed in the presence of a relaxing solution (see Solutions) containing 0.002% saponin for 2–3 min. Permeabilization of the surface membrane was monitored by imaging the fluorescence of fluo-3 present at a concentration of 50 μM into the solution. This solution was then replaced by a K2SO4-based internal solution containing 100 μM fluo-3 (see Solutions).
Preparation of intact muscle fibers
Details of procedures for partial insulation of isolated fibers with silicone grease were as described previously (Jacquemond, 1997; Collet et al., 1999). In brief, the major part of a single fiber was electrically insulated with silicone grease so that whole-cell voltage clamp could be achieved on a short portion (50- to 100 μm long) of the fiber extremity. A solution containing 1 mM fluo-3 diluted in an intracellular-like solution was then pressure microinjected into the silicone insulated portion of the fiber. A minimum delay of 20 min was then allowed before voltage-clamping the fibers. Under these conditions the dye was assumed to reach a final concentration within the 100 μM range following intracellular equilibration. In some experiments the injected solution also contained maurocalcine at a concentration of 0.5 mM. All experiments were performed at room temperature (20–22°C), in the presence of a tetraethylammonium (TEA)-containing solution as extracellular medium (see Solutions). The sarcomere length of the fibers was typically 1.9 μm.
Electrophysiology
An RK-400 patch-clamp amplifier (Bio-Logic, Claix, France) was used in whole-cell configuration. Command voltage pulse generation was done with an SMP 300 programmable stimulator (Bio-Logic). Voltage-clamp was performed with a microelectrode filled with the internal-like solution (see Solutions). Analog compensation was systematically used to decrease the effective series resistance. Microelectrode resistance was within 1–3 MΩ. The tip of the microelectrode was inserted through the silicone, within the insulated part of the fiber. Membrane depolarizations were applied from a holding command potential of −80 mV to values typically ranging between −60 and −40 mV (with ΔV increments of 5 mV).
Confocal detection of fluo-3 fluorescence and image analysis
Unless otherwise specified, imaging was achieved on the Zeiss LSM 510 laser scanning confocal microscope available at the Centre Technologique des Microstructures of University Lyon 1. The microscope was equipped with a 63x oil immersion objective (NA=1.4). Fluo-3 was excited with the 488-nm line of an argon ion laser and the emitted fluorescent light was measured at wavelengths >505 nm. The point spread function was determined with 100 nm wide fluorescent beads, which gave a full width at half amplitude (FWHM) of 0.3 μm in the x and y direction and of 0.8 μm in the z direction. Line-scan images (512/1024 pixels) were taken with a time resolution of 1.54 ms/line, corresponding to 73.1 μm and 1.58 s. These (x,t) images were normalized to baseline fluorescence (F0 [x]). The line was always oriented along the longitudinal axis of the fibers. Images taken under voltage-clamp conditions that yielded contractile artifacts were discarded from the analysis.
Elementary Ca2+release events in line-scan images taken from skinned fibers were captured using an automatic computer detection method based on previously published algorithms (Cheng et al., 1999), as described earlier (Szentesi et al., 2004). In brief, the program identified elementary events as regions with fluorescence above a relative threshold, calculated from the noise in the image and having amplitude > 0.3 ΔF/F0 units. The program also determined the parameters of the identified events: amplitude, spatial half-width measured at the time of the peak (full width at half-maximum, FWHM) and duration. FWHM was obtained from fitting a Gaussian function to the spatial distribution obtained by averaging three lines at the peak of the events.
The line-scan images taken from mouse intact fibers stimulated by voltage-clamp depolarizations were normalized to the baseline fluorescence measured before the pulse. In practice, 10–30 line-scan images were usually taken in a given fiber. In order to remove the background fluorescence during the depolarizing pulse (see Results) the images were high-pass filtered in the space domain using the built-in fast Fourier-transform (FFT) function of Microcal Origin (Microcal Software Inc., Northampton, MA) software: the steady level and three lowest frequency components were removed and an inverse Fourier transform was used to obtain an image devoid of the background increase in fluorescence (this approach assumes that the background increase is present everywhere and thus is represented with low frequencies while an event is restricted in space and thus is represented by high frequencies). Filtered images were then subjected to an event-detecting routine also based on the Cheng et al. (1999) algorithms. For each event the following parameters were determined: amplitude, latency, FWHM. For this, three adjacent lines in the space domain, centered at the peak of the event, were averaged and smoothed 10 times. The x positions of the first and of the last maximum, within the time course of the event, were then determined by eye. The amplitude of the event was then calculated as the average value of all points sitting between the first point in the event that reached 90 % of the first peak and the last point in the event that reached 90 % of the last peak. Only events with amplitude of ΔF/F0 ≥ 0.1 were then kept for the analysis. The latency was determined at the first point along the time course that had a value equal to 10 % the average amplitude. The duration of the event was taken as the time between the latency and the last point in the event that reached 90 % of the last peak. The FWHM was obtained from a Gaussian fit to the average of all lines in the space domain over the same time interval used for calculation of the amplitude.
The line-scan images taken from frog intact fibers stimulated by voltage-clamp depolarizations were normalized to the baseline fluorescence measured before the pulse. Sparks were identified using the same event detecting routine as the one used in mouse intact fibers. The amplitude, latency and FWHM of the voltage-activated Ca2+ sparks were also measured using similar procedures and criteria as for the images from the mouse intact fibers. Only, the amplitude of a spark was calculated as the average value of points sitting between the first and the last that reached 90 % of the spark central peak amplitude. When the FFT filter procedure was applied on a spark-containing line-scan image from a frog fiber, the amplitude and spatial spread of the sparks were slightly reduced whereas their time course remained unaffected (not illustrated).
Solutions
Tyrode solution contained (in mM): 140 NaCl, 5 KCl, 2.5 CaCl2, 2 MgCl2, and 10 HEPES adjusted to pH 7.20 with NaOH. For the skinned fiber experiments the relaxing solution and the K2SO4-based internal solution contained (mM) 125 K-glutamate, 10 HEPES, 1 EGTA, 6 MgCl2, 5 Na2-ATP, 10 Na-phosphocreatine, 10 glucose, 0.13 CaCl2 and 95 K2SO4, 10 HEPES, 1 EGTA, 6 MgCl2, 5 Na2-ATP, 10 Na-phosphocreatine, 10 glucose, 0.13 CaCl2, respectively. Both solutions also contained 8% dextran.
For voltage-clamp experiments the external solution contained (in mM) 140 TEA- methanesulfonate, 2.5 CaCl2, 2 MgCl2, 10 TEA-HEPES and 0.002 tetrodotoxin, pH 7.20. The internal-like solution contained (in mM): 120 K-glutamate, 5 Na2-ATP, 5.5 MgCl2, 5 Na2- phosphocreatine, and 5 HEPES adjusted to pH 7.20 with K-OH.
Statistics
Least-squares fits were performed using a Marquardt-Levenberg algorithm routine included in Microcal Origin. Unless otherwise specified, data values are presented as means ± SE. Statistical significance was determined using a Student’s t-test assuming significance for p < 0.05.
RESULTS
Fig. 1 shows strips from baseline corrected line-scan (x, t) images of fluo-3 fluorescence taken from mouse and frog skeletal muscle fibers under different conditions. The image in Fig. 1 A was obtained from a chemically skinned mouse muscle fiber equilibrated with fluo-3. As originally reported by Kirsch et al. (2001) in mammalian muscle fibers, these conditions favor the occurrence of Ca2+ spark-like events. The first row in Table I gives mean values for standard parameters measured from 201 such events collected from 7 mouse fibers under these conditions. Values are in agreement with those reported previously by Kirsh et al. (2001), Zhou et al. (2003) and Szentesi et al. (2004) in chemically skinned mammalian muscle fibers. Fig. 1 B is simply presented as an illustrative example of the fact that qualitatively similar events can be recorded from skinned frog muscle fibers under these same conditions. Fig. 1 C and D were obtained from a mouse skeletal muscle fiber under silicone voltage-clamp conditions; the fiber was depolarized by a 500 ms long step to −45 mV (C) and to −40 mV (D), starting 200 ms after the beginning of the line-scan. As previously observed in either mechanically dissected (Shirokova et al., 1998) or enzymatically dissociated (Csernoch et al., 2004) rat muscle fibers under vaseline-gap voltage-clamp conditions, the depolarization induced a diffuse increase in fluorescence, out of which there was no sign of spark-like Ca2+ release events. Conversely, when such measurements were achieved on frog muscle fibers, membrane depolarization elicited unmistakable Ca2+ sparks, the frequency of which increased with the amplitude of the pulse, as illustrated in Fig. 1 E–F. Mean values for parameters measured from such voltage-activated sparks in 5 frog fibers under these conditions are given in the third row of Table I; they fit reasonably well within the range of parameters reported by others in frog muscle fibers voltage-clamped with the vaseline-gap technique (see e.g. Table 2 from Baylor, 2005). When compared to the values from the sparks detected here in skinned mouse fibers, voltage-activated sparks from frog fibers yielded a definitely shorter duration whereas their amplitude and FWHM were very similar to the values in the skinned mouse fibers. Overall, these data establish the reliability of our system and conditions in regard to the possibility of detecting elementary Ca2+ release events in isolated skeletal muscle fibers.
Figure 1. Spontaneous and voltage activated Ca2 release events in skinned and intact skeletal muscle fibers, respectively.
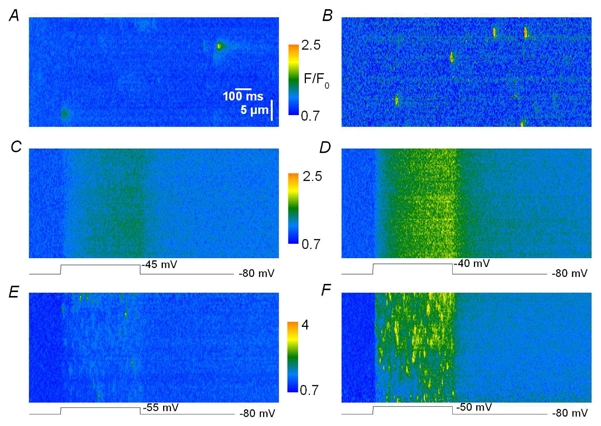
A, B, strips of fluo-3 fluorescence line-scan images taken from a chemically skinned skeletal muscle fiber isolated from a mouse and from a frog, respectively. The frog image was from measurements performed in the Department of Physiology at University of Debrecen under the conditions described in Szentesi et al. (2004). C, D, strips of line-scan images from a voltage-clamped intact mouse skeletal muscle fiber depolarized by a 500 ms long pulse to −45 and −40 mV, respectively. E, F strips of line-scan images from a voltage-clamped intact frog skeletal muscle fiber depolarized by a 500 ms long pulse to −55 and −50 mV, respectively.
TABLE I.
Average properties of calcium release events
| Amplitude | Full duration | FWHM | ||
|---|---|---|---|---|
| (ΔF/F0) | (ms) | (μm) | ||
| mouse | skinned (n=201) | 0.93 ± 0.02 | 64.1 ± 4.2 | 0.98 ± 0.04 |
| voltage-activateda(n=123) | 0.16 ± 0.005 | 383.8 ± 18.1 | 1.93 ± 0.1 | |
| frog | voltage-activated*(n=115) | 1.00 ± 0.05 | 13.4 ± 0.53 | 0.90 ± 0.02 |
Voltage-evoked events were detected using 500 ms long depolarizing pulses
Our goal then was to track elementary events within the images collected from intact voltage-clamped mouse muscle fibers. The images in Fig. 2 illustrate the strategy that was used. Fig. 2 A shows a raw line-scan image of the fluo-3 fluorescence obtained in response to a 500 ms long depolarization to −50 mV. The image was baseline corrected (Fig. 2 B) and filtered in the spatial domain (Fig. 2 C) as described in Methods. Notice that the time course of the spatially averaged global F/F0 signal is shown at the bottom of Fig. 2 B. The filtering procedure removed the diffuse continuous increase in fluorescence, clearly revealing the presence of local stripes of elevated fluorescence intensity within the depolarization interval. Fig. 2 D shows the corresponding created binary image in which all pixels with values lower than the threshold level were set to zero while other pixel values were set to unity. The threshold was set to twice the standard deviation of the background signal. This procedure highlighted two main regions (a and b) within the image, at x locations pointed by an arrow. The time course of the corresponding signals is shown superimposed on the image in Fig. 2 C. Notice that in this example these regions were already quite well discernible within the initial raw image, which was not always the case. Within the present study, such supra-threshold local signals were detected in 99 out of 204 images analyzed from 23 fibers. The areas containing the local signals were excised from the filtered image shown in Fig. 2 C and then analyzed separately to determine their morphological properties. Fig. 3 shows examples of three such identified events within another processed line-scan image. Fig. 3 A shows the baseline corrected image and Fig. 3 B the corresponding filtered image. The time course of each event is shown superimposed on the image in Fig. 3 B with an arrow pointing to its corresponding location. The amplitude of these local fluorescence changes was small, around 0.2 F0. Their time course was either quite simple, roughly corresponding to a step-like change in fluorescence (as for the event in the middle of the image) or appeared more complex with features that may be thought to reflect the presence of amplitude sub-levels or closures and re-openings (see also Fig. 4). However, within the present study, events were defined and quantitatively characterized in the simplest way (see Methods) and no attempt was done to apprehend any further intrinsic complexity. It should also be stressed that under our conditions the large majority of the detected events occurred during the depolarization interval. In some rare cases, however, we could also observe local signals likely to result from the re-opening of the channel (or group of channels) responsible for this type of activity after the end of the depolarization, as shown in Fig. 4 A–B. Six such post-pulse events were detected in the 99 total number of images where events activated during a depolarization were identified. These events were not included in the analysis. In Fig. 3, the inset on the right shows the spatial profile of the event with the time course shown in the middle of the image. The profile was well fitted by a Gaussian function, the result of which is shown superimposed on the data points. Mean values for the amplitude, duration and FWHM obtained from events identified in (x, t) images collected under these conditions (that is in response to 500 ms long depolarizing pulses irrespective of the depolarization level) are reported in Table I, while corresponding distribution histograms are presented in Fig. 5. The spatio-temporal properties of these events are very different from those of both the spontaneous Ca2+ sparks from skinned mouse fibers and the voltage-activated Ca2+sparks in frog fibers: the mean values for amplitude and FWHM of the voltage-activated mouse events were about one fifth and twice the corresponding values from the Ca2+ sparks, respectively. The mean duration of the voltage-activated mouse events was much larger than that of both types of Ca2+ sparks; furthermore, as shown in Fig. 5 C, the distribution of event duration was broad and yielded a peak for duration values close to 500 ms which corresponds to the duration of the voltage clamp depolarization. Very few events of longer duration could be detected under these conditions, suggesting that events tended to be terminated by membrane repolarization. This was confirmed by examining the duration of events triggered by membrane depolarization of 200 ms and 800 ms duration. Fig. 6 A–C presents pairs of corresponding baseline corrected- (left) and processed- (right) line-scan images taken while a voltage-clamp depolarization of 200 ms, 500 ms and 800 ms duration was applied, respectively. The time course of a detected event is shown superimposed to each processed image. There was a clear dependence of the event duration upon the length of the pulse as also quantitatively illustrated in Fig. 6 D where the mean values for the event duration are plotted versus the pulse duration. In order to highlight the variability of the event duration the error bars in Fig. 6 D correspond to the standard deviation of the mean values.
Figure 2. Identification of voltage-activated calcium release events.
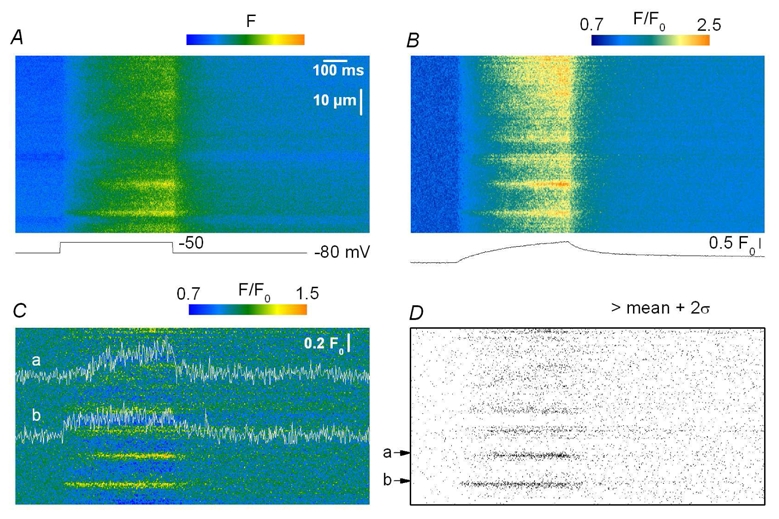
A, raw fluo-3 fluorescence line-scan image from a mouse skeletal muscle fiber. B, corresponding image after correction for baseline fluorescence (F/F0). F0(x) was obtained by averaging the fluorescence in the time domain during the baseline period (200 ms). The trace below the image shows the corresponding spatially averaged global F/F0 signal. C, corresponding F/F0 image after high-pass FFT filtering (see Methods). D, Ca2+ release events identified by the detection routine; the time course of the corresponding events is shown superimposed on the image in Fig. 2 C; it was obtained by averaging three neighboring lines in the space domain positioned at the center of the events.
Figure 3. Time course and spatial spread of voltage-evoked Ca2+ release events.
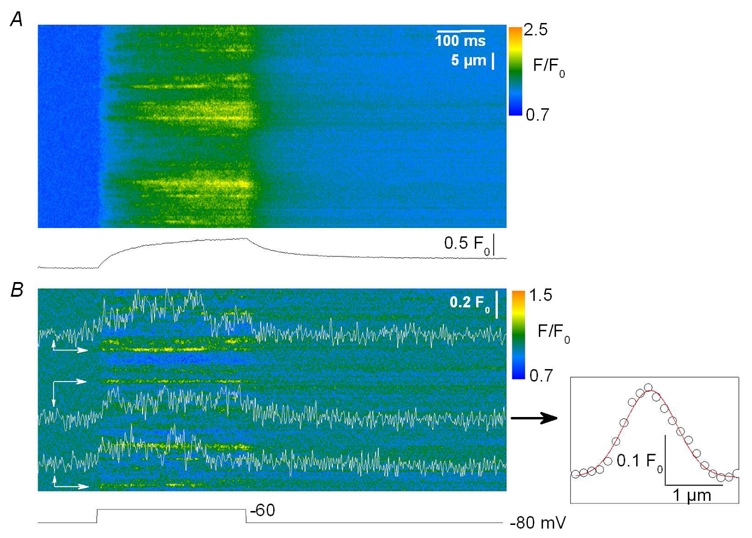
A, baseline corrected fluo-3 fluorescence line-scan image from a mouse skeletal muscle fiber depolarized by a 500 ms long depolarization to −60 mV. The bottom trace shows the corresponding spatially averaged global F/F0 signal. B, corresponding F/F0 image after high- pass FFT filtering. Identified Ca2+ release events (as described in Fig. 2) were further analyzed by averaging three neighboring lines in the space domain, positioned at the center of the events (marked by arrows) to obtain their time course. The inset on the right shows the spatial spread of the event on the left in the line-scan image; the superimposed line corresponds to the result from fitting a Gaussian function to estimate FWHM.
Figure 4. Rarely observed non-standard events.
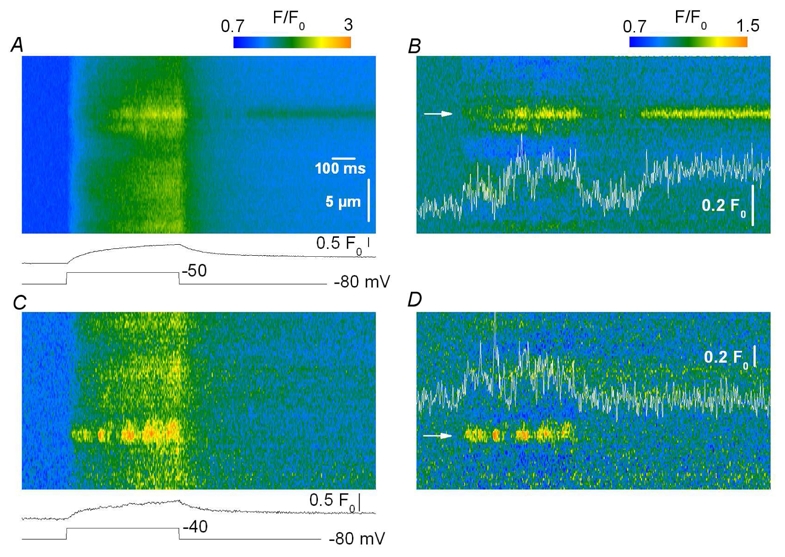
Strips of fluo-3 fluorescence line-scan images from two distinct mouse skeletal muscle fibers depolarized by a 500 ms long pulse. A and C show the baseline corrected fluorescence images; the corresponding spatially averaged global F/F0 signal is shown at the bottom. B and D show the corresponding filtered images. Fluorescence events suggesting RyR channels closure followed by re-opening were occasionally detected after (A, B) and during a depolarizing pulse (C, D). Such complex events were seen in 4 and 11 images, respectively, out of the total of 99 images where events were detected and analyzed.
Figure 5. Properties of voltage-evoked Ca2+ release events in mouse skeletal muscle fibers.
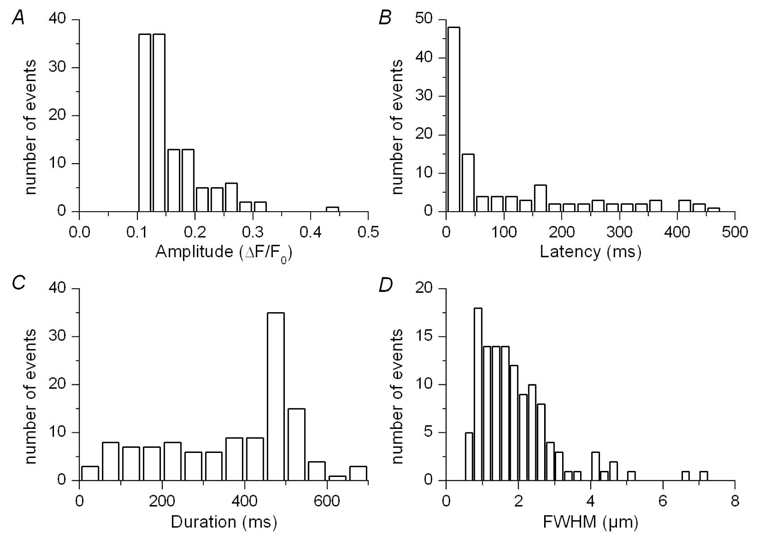
Event amplitude (A), latency (B), duration (C) and FWHM (D) are presented as distribution histograms.
Figure 6. Ca2+ release events for various durations of membrane depolarization.
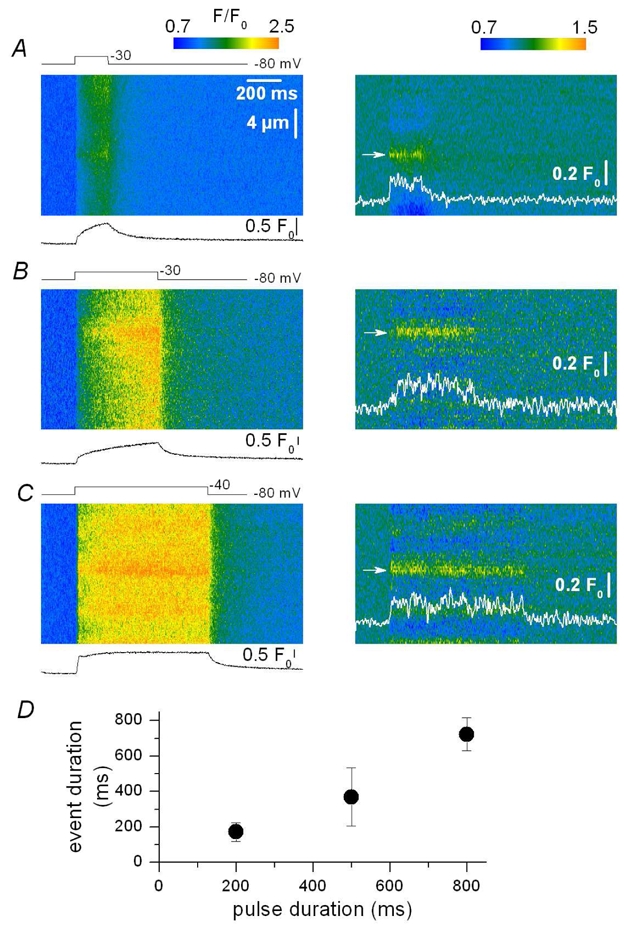
A–C, baseline corrected (F/F0) line-scan images of fluo-3 fluorescence (left) and corresponding filtered images (right, see Methods) from three distinct mouse skeletal muscle fibers depolarized by voltage-clamp pulses, In A, B and C the fiber was depolarized by a 200-, 500- and 800 ms-long pulse from −80 mV to −30, −30 and −40 mV, respectively; the trace below each image corresponds to the spatially averaged global F/F0 signal. In the right panels the traces show the time course of an identified Ca2+ release event (arrow) within each corresponding image. D, dependence of the mean event duration upon the length of the pulse; data are from 13, 121 and 15 events for pulses of 200, 500 and 800 ms duration, respectively. Error bars correspond to the standard deviation.
Assuming that the discrete fluorescence signals detected here correspond to voltage-activated elementary Ca2+ release events, we attempted to reconstruct the corresponding time course of global Ca2+ influx into the myoplasm from the distribution of the events amplitude and duration shown in Fig. 5. This calculation is based on the simple concept that, for a Ca2+ influx to be operating, a Ca2+ channel needs to be open and to have not yet closed. The time-course of the probability for channels to be open is given by the cumulative distribution of latencies of the events (Fig. 7 A) whereas the time course of the probability that a channel gets closed is derived from the cumulative distribution of duration of the events (Fig. 7 B). The resulting time course of global Ca2+ influx, calculated as the product of the two, is shown in Fig. 7 C. Interestingly this time course resembles the one that one can calculate from the average macroscopic fluo-3 fluorescence transient obtained from the same images, using a modeling approach taking into account the known properties of the myoplasmic Ca2+ removal processes in this preparation (Szentesi et al., 2001). The two methods provided a Ca2+ flux that rose to a somewhat steady level and exhibited no, or very small early peak.
Figure 7. Reconstruction of the SR Ca2+ release flux.
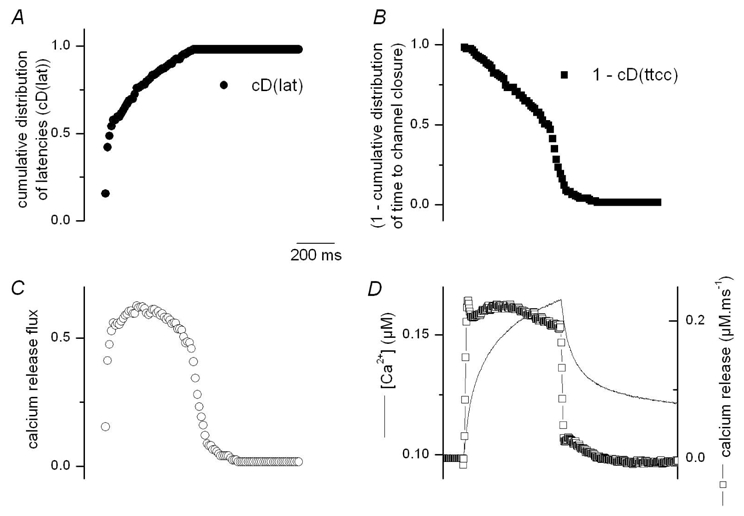
A, B, cumulative distribution of latencies (cD(lat)) and of time to channel closure (cD(ttcc)) from Ca2+ release events elicited by 500 ms long depolarizations. C, time course of SR permeability calculated as cD(lat).(1-cD(ttcc)). D, Ca2+ release flux (open squares) estimated from the global calcium transient obtained from averaging the F/F0 images in the spatial domain (thin line). Global Ca2+ release was calculated using a removal model (see Szentesi et al., 2004).
In order to further establish the importance of membrane repolarization in the termination of the discrete fluorescence signals detected here line-scan images were recorded in voltage-clamped fibers pressure-micro-injected with the scorpion toxin maurocalcine. In an earlier study we demonstrated that this toxin affects the voltage-activated global Ca2+ transient in a way suggesting that it binds to Ca2+ release channels opened by the membrane depolarization and prevents them from closing upon membrane repolarization (Pouvreau et al., 2006). Fig. 8 A–B shows (x, t) fluo-3 fluorescence images taken from two separate mouse muscle fibers injected with maurocalcine and depolarized by a 200 ms long pulse. The figure shows both the baseline corrected images (left) and the corresponding processed images (right). The trace below each baseline corrected image shows the corresponding spatially averaged global F/F0 signal. The images contained discrete fluorescence events that started during the depolarization and ran all the way through the recording period. The time course of two such events is shown superimposed on the filtered images. They yielded an amplitude similar to that of events detected under control conditions. A total of 15 (x, t) images containing suprathreshold events were collected from 7 voltage-clamped fibers injected with maurocalcine. Both non-ending events resembling those shown in Fig. 8 A–B and events similar to those observed in control fibers could be detected. The graph in Fig. 8 C presents the dependence of the individual values for the duration of the detected events in maurocalcine-injected fibers (open circles) versus the length of the pulse. Events that did not end over the recorded period were arbitrarily assumed to have stopped at the end of the record (1.38 s following the beginning of the pulse). The mean values obtained from control fibers (filled circles, Fig. 6 D) are also shown for comparison. In the presence of maurocalcine 11 suprathreshold non-ending events were detected. Corresponding mean values for spatial half- width and amplitude were 1.47 ± 0.09 μm and 0.15 ± 0.02 ΔF/F0, respectively. Fig. 9 shows mean values for the average amplitude and FWHM of these 11 events when measured during the depolarizing pulse (during step) and after the pulse (after step). Overall, the amplitude and FWHM were not significantly affected by membrane repolarization.
Figure 8. Voltage-activated Ca2+ release events in the presence of Maurocalcine.
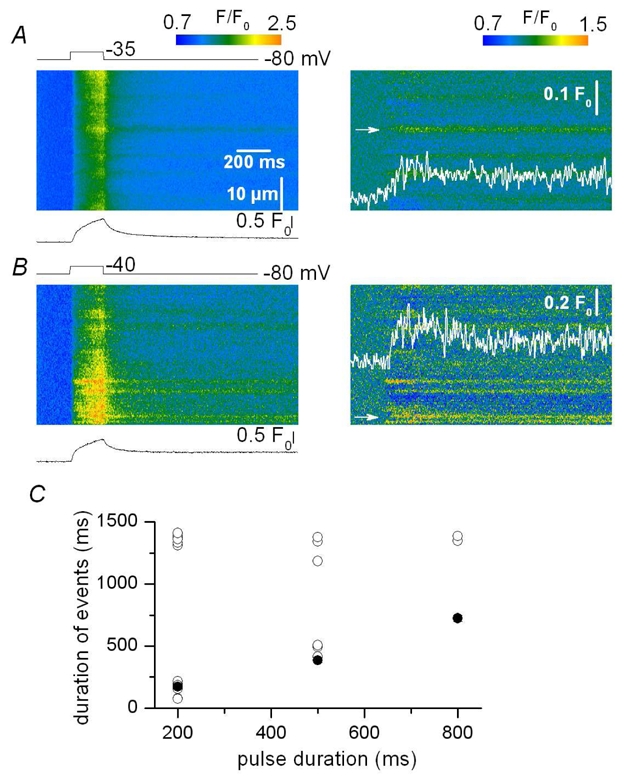
A–B, baseline corrected (F/F0) line-scan images of fluo-3 fluorescence (left) and corresponding filtered images (right, see Methods) from two distinct mouse skeletal muscle fibers depolarized by 200 ms long voltage-clamp pulses to −35 mV and −40 mV, respectively. The two fibers were injected with a solution containing 0.5 mM maurocalcine (see Methods). C, dependence of the values for the duration of the events in maurocalcine-injected fibers (open circles) versus the length of the pulse; filled circles correspond to the mean values in control fibers (see text for details).
Figure 9. Amplitude and duration of the Ca2+ release events non-interrupted by membrane repolarization in the presence of Maurocalcine.
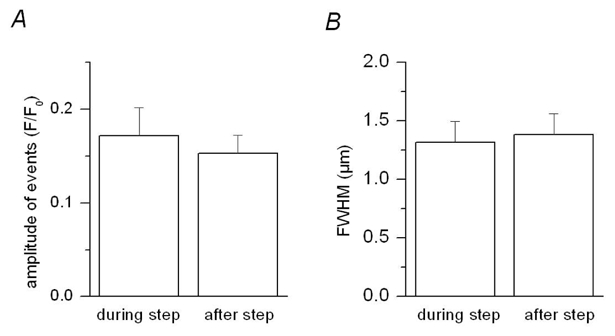
A, B, mean values for the amplitude and FWHM of the events during and after the end of the depolarization (n=11).
DISCUSSION
The search for the elementary components that build up the global cytoplasmic Ca2+ transient responsible for the contraction of mammalian skeletal muscle fibers is on. While in frog fibers the voltage-activated elementary SR Ca2+ release events (the Ca2+ sparks) have been extensively characterized, detection of the corresponding events in mammalian muscle fibers is proving to be a much more challenging task. Indeed, irrespective of the experimental system used, it seems that frog muscle fibers always produce Ca2+ sparks in response to membrane depolarization (see for review Baylor, 2005). On the contrary and unexpectedly, the first voltage-clamped mammalian muscle fibers (rat cut fibers handled with the vaseline-gap technique) that were reported to be held under a confocal microscope proved incapable of generating such events (Shirokova et al., 1998). This definitely highlighted the possibility for major differences in the physiological mechanisms that control SR Ca2+ release between the two species.
We demonstrate here that this difference also holds true between intact enzymatically isolated frog and mouse muscle fibers held under silicone voltage-clamp conditions. In our hands, frog fibers generate Ca2+ sparks in response to membrane depolarization, with properties similar to those described in previous studies, while mouse fibers are endowed with a diffuse increase in the calcium-dye fluorescence devoid of typical sparks. This latter observation is thus consistent with the data obtained in rat cut fibers by Shirokova et al. (Shirokova et al., 1998). Using the vaseline-gap technique Csernoch et al. (2004) showed that spatially restricted discrete fluorescence signals of smaller amplitude and longer duration than sparks, could be detected in the rat fibers during voltage-clamp depolarizations. These signals yielded morphological properties similar to the so-called “embers” originally described by Gonzalez et al. (2000) in amphibian and by Kirsch et al. (2001) in skinned mammalian muscle fibers, and believed to result from the activity of either one or of a restricted number of highly synchronized RyRs (see Zhou et al., 2003; Szentesi et al., 2004). Here we also demonstrate that discrete local elevations of fluorescence can also be identified within the diffuse fluo-3 fluorescence increase triggered by a voltage-clamp depolarization in intact mouse muscle fibers. These signals also exhibit morphological properties close to those of embers. If compared to those observed in rat cut fibers by Csernoch et al (2004), the present events yield a somewhat smaller average amplitude (0.16 versus 0.19) and larger spatial half-width (2 μm versus 1.3 μm). Given, however, the numerous differences between the two studies including the species and muscle type and the use of cut versus intact fibers we believe that the two sets of data agree remarkably well. Our results thus definitely establish these voltage-activated low amplitude long-lasting events as inherent components of the excitation-contraction coupling process of mammalian muscle. It should be stressed that, due in particular to their very low amplitude and to the presence of a concomitant diffuse increase in fluorescence, the study of these events proved to be much more difficult than that of voltage-activated Ca2+ release events (the sparks) in frog muscle. For instance, we have so far been unable to derive a voltage-dependence for the parameters of these events because of two main limitations. For once, fibers were injected with a solution that did not contain EGTA, or any other calcium buffer, apart from the dye itself; therefore, increasing the level of step depolarization rapidly tended to initiate the contraction of the fiber, resulting in the distortion of the images and rendering a reliable analysis impossible. In addition, the larger the level of depolarization the greater was the increase in the background fluorescence, which inescapably made the detection of the events ever more difficult. Nonetheless, in an attempt to crudely explore the voltage dependence, events measured at the most negative and positive membrane depolarization levels were grouped and the characteristic parameters for each group were determined. There was no difference in the mean amplitude of the events (0.152 ±0.010 versus 0.154 ± 0.010; n = 19) between the two groups whereas there was a slight, but statistically not significant, decrease in the latency for events detected at the largest depolarization levels (109 ± 32 versus 81 ± 31 ms), in line with the expectations. The fact that the change in latency did not prove to be significant most likely results from the fact that measurements at different voltages were conducted, due to the above mentioned reasons, on different fibers. The inability to reliably detect events for large depolarizing levels led to another somewhat frustrating issue that we could not demonstrate a statistically significant increase in the frequency of events versus voltage, as was also the case in the preceding study on rat fibers under vaseline-gap voltage-clamp conditions (Csernoch et al., 2004). Although this is a critical aspect of the problem, it is quite clear that the conditions for triggering and/or detecting these events will need to be improved before their voltage dependence can be explored in detail. Along this line, we did make attempts to improve the detection by testing other experimental conditions including the use of a high concentration of EGTA in the fibers or the use of the calcium dye fluo-4 in place of fluo-3 (not illustrated). These conditions did not provide sufficient improvement to help unravel the voltage dependence of the event frequency.
In any case we demonstrate that for a given depolarizing pulse length, the distribution of the duration of these events exhibits a clear peak at values which correspond to the time of repolarization of the membrane. This suggests that the channel activity underlying these events tends to be shut by membrane repolarization. This is also confirmed by the strong dependence of the mean event duration upon the depolarizing pulse length. This makes these events good candidates to represent at least one class of voltage-activated SR Ca2+ release events. Taken together these observations also indicate that the DHPR in its resting state, i.e. when the T-tubular membrane potential is at its resting (−80 to −90 mV) value, exerts a tonic inhibitory effect on the RyR. This would explain why intact mammalian fibers hardly produce spontaneous events (Conklin et al., 1999; Chun et al., 2003; Zhou et al., 2003) whereas fibers with disrupted surface- and T-tubular membranes do so (Kirsch et al., 2001; Zhou et al., 2003; Isaeva et al., 2005). This concept is also in line with earlier findings on cultured mammalian myotubes where a spatially segregated voltage-controlled Ca2+ release devoid of discrete events and spontaneous Ca2+ release in the form of Ca2+ sparks, was demonstrated (Shirokova et al., 1999) and attributed later to the presence or absence of properly developed T-tubules and DHPR-RyR interactions (Zhou et al., 2006). It should be stressed, however, that the picture for the control of elementary calcium release events in mammals is far from being so clear. In the above framework any intervention that removes the inhibition exerted by the DHPR should favor the appearance of spontaneous events. This is clearly questioned, since neither chronic depolarization nor the presence of dihydropyridines, both favoring the transition to the inactivated state of the DHPR, provokes such events (Szappanos et al., 2005 and unpublished data), unless the inactivated state of the DHPR is also associated with a tonic inhibitory interaction between the voltage sensor and the calcium release channel.
We also found that the re-construction of the global Ca2+ release waveform from the elementary properties of these events was very much consistent with the waveform calculated from the average macroscopic change in fluo-3 fluorescence using a classical model of intracellular Ca2+ redistribution. Noticeably, both approaches provided a time course that rose monotonically and which did not display an early peak, suggesting that calcium-dependent inactivation did not play an important role at these low levels of activation. Future investigation of the properties of the events under conditions allowing application of more depolarized voltages will certainly provide further insights into this aspect of the regulation of the Ca2+ release channels.
Finally, we demonstrate that in the presence of maurocalcine, a specific sub-set of events could be detected that had a similar amplitude and spatial profile as those in control, but were not terminated by membrane repolarization and had durations exceeding 1 s. Such events were never observed under control conditions and should not be confused with the rare examples of post-pulse events illustrated in Fig. 4 A–B which are likely to witness a channel re-opening after the end of the pulse. Since maurocalcine was reported to induce long-lasting subconductance states on isolated RyRs incorporated into lipid bilayers (Fajloun et al., 2000; Esteve et al., 2003) and to evoke ember-like Ca2+ release events with long duration (Szappanos et al., 2005), the events captured here should also correspond to channels modified by the peptide. In addition, using global Ca2+ measurements we previously provided data suggesting that, within the physiological functional frame of e-c coupling, maurocalcine binds to RyR channels that open during membrane depolarization and that maurocalcine-modified channels fail to close upon membrane repolarization (Pouvreau et al., 2006). We believe that the non-ending events observed here provide a remarkable correlate for this scheme, at the elementary level. Such events are indeed more than likely to correspond to the activity of a single maurocalcine-bound RyR that is maintained open despite membrane repolarization. It should be stressed that the possibility of two release channels binding maurocalcine either at the same time or in close succession, has to be extremely low. The observation that the parameters of the events are independent of whether they are measured during or after the pulse also strongly argues in favor of the same channel being responsible for the entire event. This, together with the fact that these events do not dramatically differ in size from those measured under control conditions, render the possibility that the control events are also generated by a single calcium release channel extremely likely. One should, however, stress that if a group of channels, due to allosteric interactions, always gates synchronously (as proposed by Marx et al., 1998), the present method would recognize them as a single entity. Nevertheless, further in depth study of this effect of maurocalcine should provide interesting clues regarding the control of the RyR channel activity.
Overall the present results provide definite additional insights into the in vivo function of the SR Ca2+ release channels in mammalian muscle. Although there is still a number of questions open, including for instance the mechanism underlying the diffuse increase in fluo-3 fluorescence observed during a depolarizing pulse, the present approach should prove useful to further characterize SR Ca2+ release under normal and stress or diseased conditions in mammalian muscle.
Acknowledgments
This work was supported by grants from CNRS, University Claude Bernard Lyon 1, Association Française contre les Myopathies, the Hungarian National Science Fund (OTKA T049151) and the French-Hungarian Balaton program.
References
- Baylor SM. Calcium sparks in skeletal muscle fibres. Cell Calcium. 2005;37:513–530. doi: 10.1016/j.ceca.2005.01.002. [DOI] [PubMed] [Google Scholar]
- Berridge MJ. Calcium microdomains: organization and function. Cell Calcium. 2006;40:405–412. doi: 10.1016/j.ceca.2006.09.002. [DOI] [PubMed] [Google Scholar]
- Cheng H, Song LS, Shirokova N, Gonzalez A, Lakatta EG, Rios E, Stern MD. Amplitude distribution of calcium sparks in confocal images: theory and studies with an automatic detection method. Biophys J. 1999;76:606–617. doi: 10.1016/S0006-3495(99)77229-2. [DOI] [PMC free article] [PubMed] [Google Scholar]
- Chun LG, Ward CW, Schneider MF. Ca2+ sparks are initiated by Ca2+ entry in embryonic mouse skeletal muscle and decrease in frequency postnatally. Am J Physiol Cell Physiol. 2003;285:C686–C697. doi: 10.1152/ajpcell.00072.2003. [DOI] [PubMed] [Google Scholar]
- Collet C, Allard B, Tourneur Y, Jacquemond V. Intracellular calcium signals measured with indo-1 in isolated skeletal muscle fibres from control and mdx mice. J Physiol. 1999;520:417–429. doi: 10.1111/j.1469-7793.1999.00417.x. [DOI] [PMC free article] [PubMed] [Google Scholar]
- Conklin MW, Barone V, Sorrentino V, Coronado R. Contribution of ryanodine receptor type 3 to Ca2+ sparks in embryonic mouse skeletal muscle. Biophys J. 1999;77:1394–1403. doi: 10.1016/S0006-3495(99)76988-2. [DOI] [PMC free article] [PubMed] [Google Scholar]
- Csernoch L. Sparks and embers of skeletal muscle: the exciting events of contractile activation. Pflugers Arch. 2007;454:869–878. doi: 10.1007/s00424-007-0244-0. [DOI] [PubMed] [Google Scholar]
- Csernoch L, Pouvreau S, Jacquemond V. Voltage activated calcium release events in mouse skeletal muscle fibers. Biophys J. 2006;90:326a. doi: 10.1007/s00232-008-9138-0. [DOI] [PMC free article] [PubMed] [Google Scholar]
- Csernoch L, Zhou J, Stern MD, Brum G, Rios E. The elementary events of Ca2+ release elicited by membrane depolarization in mammalian muscle. J Physiol. 2004;557:43–58. doi: 10.1113/jphysiol.2003.059154. [DOI] [PMC free article] [PubMed] [Google Scholar]
- Estève E, Smida-Rezgui S, Sarkozi S, Szegedi C, Regaya I, Chen L, Altafaj X, Rochat H, Allen P, Pessah IN, Marty I, Sabatier JM, Jona I, DeWaard M, Ronjat M. Critical amino acid residues determine the binding affinity and the Ca2+ release efficacy of maurocalcine in skeletal muscle cells. J Biol Chem. 2003;278:37823–37831. doi: 10.1074/jbc.M305798200. [DOI] [PubMed] [Google Scholar]
- Fajloun Z, Kharrat R, Chen L, Lecomte C, Di Luccio E, Bichet D, El Ayeb M, Rochat H, Allen PD, Pessah IN, DeWaard M, Sabatier JM. Chemical synthesis and characterization of maurocalcine, a scorpion toxin that activates Ca2+ release channel/ryanodine receptors. FEBS Lett. 2000;469:179–185. doi: 10.1016/s0014-5793(00)01239-4. [DOI] [PubMed] [Google Scholar]
- Gonzalez A, Kirsch WG, Shirokova N, Pizarro G, Stern MD, Rios E. The spark and its ember: separately gated local components of Ca2+ release in skeletal muscle. J Gen Physiol. 2000;115:139–158. doi: 10.1085/jgp.115.2.139. [DOI] [PMC free article] [PubMed] [Google Scholar]
- Isaeva EV, Shkry VM, Shirokova N. Mitochondrial redox state and Ca2+ sparks in permeabilized mammalian skeletal muscle. J Physiol. 2005;565:855–872. doi: 10.1113/jphysiol.2005.086280. [DOI] [PMC free article] [PubMed] [Google Scholar]
- Jacquemond V. Indo-1 fluorescence signals elicited by membrane depolarization in enzymatically isolated mouse skeletal muscle fibers. Biophys J. 1997;73:920–928. doi: 10.1016/S0006-3495(97)78124-4. [DOI] [PMC free article] [PubMed] [Google Scholar]
- Kirsch WG, Uttenweiler D, Fink RH. Spark- and ember-like elementary Ca2+ release events in skinned fibres of adult mammalian skeletal muscle. J Physiol. 2001;537:379–389. doi: 10.1111/j.1469-7793.2001.00379.x. [DOI] [PMC free article] [PubMed] [Google Scholar]
- Klein MG, Cheng H, Santana LF, Jiang YH, Lederer WJ, Schneider MF. Two mechanisms of quantized calcium release in skeletal muscle. Nature. 1996;379:455–458. doi: 10.1038/379455a0. [DOI] [PubMed] [Google Scholar]
- Klein MG, Schneider MF. Ca2+ sparks in skeletal muscle. Prog Biophys Mol Biol. 2006;92:308–332. doi: 10.1016/j.pbiomolbio.2005.05.016. [DOI] [PubMed] [Google Scholar]
- Marx SO, Ondrias K, Marks AR. Coupled gating between individual muscle Ca2+ release channels (ryanodine receptors) Science. 1998;281:818–821. doi: 10.1126/science.281.5378.818. [DOI] [PubMed] [Google Scholar]
- Pouvreau S, Csernoch L, Allard B, Sabatier JM, De Waard M, Ronjat M, Jacquemond V. Transient loss of voltage control of Ca2+ release in the presence of maurocalcine in skeletal muscle. Biophys J. 2006;91:2206–2215. doi: 10.1529/biophysj.105.078089. [DOI] [PMC free article] [PubMed] [Google Scholar]
- Pouvreau S, Royer L, Yi J, Brum G, Meissner G, Rios E, Zhou J. Ca2+ sparks operated by membrane depolarization require isoform 3 ryanodine receptor channels in skeletal muscle. Proc Natl Acad Sci USA. 2007;104:5235–5240. doi: 10.1073/pnas.0700748104. [DOI] [PMC free article] [PubMed] [Google Scholar]
- Shirokova N, Garcia J, Rios E. Local calcium release in mammalian skeletal muscle. J Physiol. 1998;512:377–384. doi: 10.1111/j.1469-7793.1998.377be.x. [DOI] [PMC free article] [PubMed] [Google Scholar]
- Shirokova N, Shirokov R, Rossi D, Gonzalez A, Kirsch WG, Garcia J, Sorrentino V, Rios E. Spatially segregated control of Ca2+ release in developing skeletal muscle of mice. J Physiol. 1999;521:483–495. doi: 10.1111/j.1469-7793.1999.00483.x. [DOI] [PMC free article] [PubMed] [Google Scholar]
- Szentesi P, Collet C, Sarközi S, Szegedi C, Jona I, Jacquemond V, Kovacs L, Csernoch L. Effects of dantrolene on steps of excitation-contraction coupling in mammalian skeletal muscle fibers. J Gen Physiol. 2001;118:355–375. doi: 10.1085/jgp.118.4.355. [DOI] [PMC free article] [PubMed] [Google Scholar]
- Szentesi P, Szappanos H, Szegedi C, Gönczi M, Jona I, Cseri J, Kovacs L, Csernoch L. Altered elementary calcium release events and enhanced calcium release by thymol in rat skeletal muscle. Biophys J. 2004;86:1436–1453. doi: 10.1016/S0006-3495(04)74213-7. [DOI] [PMC free article] [PubMed] [Google Scholar]
- Szappanos H, Smida-Rezgui S, Cseri J, Simut C, Sabatier JM, De Waard M, Kovács L, Csernoch L, Ronjat M. Differential effects of maurocalcine on Ca2+ release events and depolarization-induced Ca2+ release in rat skeletal muscle. J Physiol. 2005;565:843–853. doi: 10.1113/jphysiol.2005.086074. [DOI] [PMC free article] [PubMed] [Google Scholar]
- Tsugorka A, Rios E, Blatter LA. Imaging elementary events of calcium release in skeletal muscle cells. Science. 1995;269:1723–1726. doi: 10.1126/science.7569901. [DOI] [PubMed] [Google Scholar]
- Zhou J, Brum G, Gonzalez A, Launikonis BS, Stern MD, Rios E. Ca2+ sparks and embers of mammalian muscle. Properties of the sources. J Gen Physiol. 2003;122:95–114. doi: 10.1085/jgp.200308796. [DOI] [PMC free article] [PubMed] [Google Scholar]
- Zhou J, Yi J, Royer L, Launikonis BS, Gonzalez A, Garcia J, Rios E. A probable role of dihydropyridine receptors in repression of Ca2+ sparks demonstrated in cultured mammalian muscle. Am J Physiol Cell Physiol. 2006;290:C539–C553. doi: 10.1152/ajpcell.00592.2004. [DOI] [PubMed] [Google Scholar]


