

Abstract
Objective
To assess the impact of the Children's Health Insurance Program (CHIP) on the distribution of health insurance coverage for low-income children.
Data Source
The primary data for the study were from the 1997, 1999, and 2002 National Survey of America's Families (NSAF), which includes a total sample of 62,497 children across all 3 years, supplemented with data from other data sources.
Study Design
The study uses quasi-experimental designs and tests the sensitivity of the results to using instrumental variable and difference-in-difference approaches. A detailed Medicaid and CHIP eligibility model was developed for this study. Balanced repeated replicate weights were used to account for the complex sample of the NSAF. Descriptive and multivariate analyses were conducted.
Principle Findings
The results varied depending on the approach utilized but indicated that the CHIP program led to significant increases in public coverage (14–20 percentage points); and declines in employer-sponsored coverage (6–7 percentage points) and in uninsurance (7–12 percentage points). The estimated share of CHIP enrollment attributable to crowd-out ranged from 33 to 44 percent. Smaller crowd-out effects were found for Medicaid-eligible children.
Conclusions
Implementation of the CHIP program resulted in large increases in public coverage with estimates of crowd-out consistent with initial projections made by the Congressional Budget Office. This paper demonstrates that public health insurance expansions can lead to substantial reductions in uninsurance without causing a large-scale erosion of employer coverage.
Keywords: CHIP, insurance, children
The Children's Health Insurance Program (CHIP) was enacted in August 1997 with the goal of expanding health insurance coverage for low-income uninsured children. In contrast to previous expansions in public coverage, the CHIP legislation explicitly sought to target the program to the uninsured and, because of the higher federal matching rate, to ensure that states maintained their level of effort under the Medicaid program. This focus led to legislative requirements that states implement mechanisms to prevent the substitution of public coverage for private coverage and that states maintain their Medicaid eligibility thresholds at pre-CHIP levels and not cover those children under CHIP.
Ultimately, all states expanded eligibility for children under Title XXI: 43 states chose eligibility levels of 200 percent of the federal poverty level (FPL) or above. While before CHIP, states could expand coverage under Medicaid, only six states had Medicaid coverage for children at or above 200 percent of the federal poverty level in 1997. Under CHIP, North Dakota has the lowest eligibility threshold, at 140 percent of the federal poverty level and New Jersey has the highest threshold, at 350 percent of the federal poverty level. Accompanying the eligibility expansions under CHIP were unprecedented efforts aimed at reaching and enrolling uninsured children in public coverage, which had spillover effects on Medicaid programs—most states simplified their Medicaid enrollment processes for children and adopted broad-based outreach efforts.
To date a number of published econometric studies have attempted to estimate the extent to which CHIP has contributed to declines in uninsurance and employer-sponsored coverage (Lo Sasso and Buchmueller 2004; Davidoff, Kenney, and Dubay 2005; Hudson, Selden, and Banthin 2005; Bansak and Raphael 2006; Gruber and Simon 2007;).1 These studies have used different data sets and different approaches to control for other possibly confounding changes occurring over the same period as the CHIP expansions. The estimates of the extent to which CHIP coverage has substituted for employer-sponsored coverage are highly variable across the studies that were reviewed in 2004, ranging from 10 to 70 percent (Davidson, Blewett, and Call 2004).
In this paper, we use data from three rounds of the National Survey of America's Families (NSAF) to examine the impacts of the CHIP program and the enhanced efforts to reach and enroll children in Medicaid and CHIP on insurance coverage for children. Our paper attempts to improve on the previous literature by accounting for concurrent trends related to increases in the costs of private coverage, which we treat as endogenous, that may be correlated with changes in public health insurance programs, by employing a richer set of control variables for family- and county-specific work patterns in addition to state and time-fixed effects, and by using a low-income comparison group for each of our analyses to establish a counterfactual for what would have happened in the absence of the CHIP program. The more unique contribution of this paper is that we estimate the percentage decline in employer coverage and uninsurance that occurred overall and among the target population as a result of CHIP.
CONCEPTUAL FRAMEWORK AND EMPIRICAL MODEL
The conceptual framework for assessing the impact of the CHIP program on insurance coverage builds on a model of health insurance choice, which assumes that parents assess the tradeoffs associated with the different health insurance options available to them in making an insurance choice on behalf of their children. Specifically, the price of health insurance, family income and preferences, and the health endowments of children are each hypothesized to affect the insurance choice.
The expansions in eligibility for public coverage under CHIP affects the money cost of health insurance by making more individuals eligible to receive fully or partially subsidized public coverage. We expect that, other things equal, increases in eligibility will lead to increases in public health insurance coverage among children made newly eligible. In addition, the enrollment simplifications and outreach efforts that occurred with implementation of the CHIP should reduce the time costs associated with obtaining public health insurance coverage more broadly, which in turn should increase enrollment among children who were already eligible for Medicaid before the CHIP expansion.
To the extent that public coverage increases as a consequence of the expansion in eligibility under CHIP and the concurrent outreach and enrollment simplification efforts, uninsurance, and possibly employer-sponsored and private nongroup coverage, may decline. In this paper, we estimate the extent to which CHIP led to increases in public coverage and to reductions in uninsurance and each type of private coverage.
A number of estimation issues arise when modeling the effects of CHIP on insurance coverage. First, the policy lever used under CHIP is to increase eligibility for public insurance programs, but eligibility may not be exogenous. For example, families who find the public program beneficial may keep their incomes within a certain range in order to remain eligible. In addition, eligibility is likely associated with a number of unobserved variables that are negatively correlated with employer-sponsored insurance coverage and positively correlated with public coverage and uninsurance, potentially biasing estimates of the impact of CHIP on coverage.
Second, both eligibility and insurance coverage are measured with error. In order to determine eligibility, we rely on respondents' reports of income in the past month. In addition to reporting error, in many states continuous eligibility is granted for 6 months or more and income in the past month may not track with the family's income level at the time that eligibility was determined. Moreover, there is a large body of evidence that suggests that Medicaid coverage is underreported on surveys relative to administrative data (Bennefield 1996; Lewis, Ellwood, and Czajka 1998; Blumberg and Cynamon 2001; Call et al. 2001;).
Third, the implementation of federal welfare reform, an unprecedented economic boom, as well as an economic downturn and dramatic increases in heath care costs all occurred during our analysis period. As a result, we cannot estimate impacts without accounting for concurrent trends that also affect our outcomes of interest.
We estimate the impact of CHIP on insurance coverage using both a difference-in-differences (DD) approach and an instrumental variables (IV) approach. The DD approach, in contrast to the IV approach, allows us to estimate separate impacts for those made eligible for CHIP and those who were already eligible. However, measurement error can be particularly problematic in the DD context (Kaestner 2000; Yazici and Kaestner 2000; Kaestner, Dubay, and Kenney 2005;), although IV estimates may be biased upwards (Frazis and Loewenstein 2003). In addition, the DD method does not fully address issues of endogeneity, whereas the IV approach offers the potential to address both endogeneity issues and measurement error provided valid instruments can be identified that are uncorrelated with the measurement error in our outcomes (Currie and Gruber 1996).
In both the DD and IV approaches we attempt to control for concurrent trends that are correlated with changes in eligibility and insurance coverage through the use of multivariate controls including state and time-fixed effects and the inclusion of children not treated by the CHIP program but with incomes near the CHIP eligibility threshold. We attempt to address the potentially confounding effects of welfare reform by excluding children eligible for Medicaid due to their eligibility under the pre-TANF welfare rules in our DD model.
DD Approach
Like Banthin and Selden (2003) and Davidoff, Kenney, and Dubay (2005), we use a detailed eligibility simulation model (described in the subsequent section) to identify two treatment groups: (1) children eligible for Medicaid under the poverty-related expansions (the previously eligible group); and (2) children who would have been eligible for CHIP had the eligibility rules prevailing in July 2002 been in place at the time of the survey (i.e., the newly eligible group). Our comparison group consists of children: with family incomes that are 50–100 percentage points of the FPL higher than the CHIP eligibility threshold in a given state (the near eligible group).2 We use the experience of the comparison group to net out secular trends in insurance coverage that were occurring as CHIP was being implemented. Importantly, the assumption explicit in this approach is that changes in insurance coverage for this higher income group are a good stand in for what would have happened to the treatment groups in the absence of the new program.
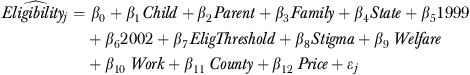
Specifically, we estimate:
 |
where insurance is defined as the child's coverage at the time of the survey (e.g., employer-sponsored coverage, Medicaid/CHIP coverage, nongroup, uninsured); child is a vector of child characteristics; parent is a vector of parent characteristics; family is a vector of family characteristics; work represents a vector of variables that describe the work status, firm size, and industry of the parent(s); county reflects the distribution of workers in the county with respect to firm size and industry; stigma includes parent's perspectives on stigma associated with welfare programs; welfare indicates the family's recent experience with the welfare system; price reflects the price of private insurance coverage for families which is instrumented as described below; state is a vector of dummy variables indicating the state in which the child resides; 1999 and 2002 indicate survey years; and Medicaid and CHIP are dummy variables indicating whether the child is eligible for Medicaid under the poverty-related expansions or whether the child could have been eligible for CHIP under the eligibility rules that were in effect as of July 2002. β17 represents the change in insurance status that occurred among CHIP-eligible children as a result of CHIP, net of changes that would have occurred in the absence of the program. In addition, β14 represents the spillover effects on the Medicaid population that occurred as a result of CHIP. Price reflects the money cost of private coverage to families. We expect that families facing higher costs for private coverage will be less likely to choose private coverage for their children, which in turn will increase public coverage and/or uninsurance (Chernew, Frick, and McLaughlin 1997; Blumberg, Nichols, and Banthin 2001; Hadley et al. 2006–2007;). Because of concerns about the potential endogeneity of this variable with respect to insurance coverage status given evidence that employers may alter their behavior as a result of the expansion in public coverage by increasing the employee share of premiums or by ceasing to offer coverage (Buchmueller et al. 2005), we use a two-stage least squares (2SLS) approach for estimating the insurance coverage equations, which is described below.3
IVs Approach
In the IV approach we explicitly limit the estimation sample to children with family incomes under 300 percent of the federal poverty level, following Lo Sasso and Buchmueller (2004) and Hudson et al. (2005). We estimate the following model:
 |
where variables are as defined above and  represents predicted eligibility and β12 represents the impact estimate. We treat eligibility as endogenous and use an IV approach to estimate the effect of eligibility on insurance coverage. Consistent with the work by Cutler and Gruber (1996), we use the age-specific eligibility thresholds for public coverage in each state that the child resides as our instrument and estimate the following model of eligibility:
 |
where EligThreshold is the instrument and the other variables are as defined above. Price is also treated as endogenous in this model.4
Using both approaches we compute the crowd-out rate—that is, the change in employer coverage that occurs as a result of the expansion in eligibility relative to the change in public coverage. We calculated the crowd-out rate as the ratio of the estimated change in employer-sponsored coverage due to CHIP relative to the estimated change in public coverage due to CHIP. We do not include changes in private nongroup coverage in this estimate because Section 2102 b(3) of the CHIP statute indicated that the substitution of CHIP coverage for private nongroup coverage would not be considered crowd-out. We also estimate the extent to which employer-sponsored coverage declined, estimated as the ratio of the change in employer-sponsored coverage attributable to CHIP to the pre-CHIP rate of employer coverage. Take-up rates among the uninsured were calculated similarly.
DATA
The 1997, 1999, and 2002 rounds of the NSAF constitute the primary data source for this analysis. The NSAF is a nationally representative household survey that oversamples low-income families in 13 states, collecting information in all 3 years on family structure, demographics, income, insurance coverage, access to health care and use of services, and non-health-related information about child and family well-being (Kenney et al. 1999; Safir, Scheuren, and Wang 2001;). Up to two children were sampled per household; the survey respondent was the adult in the household who was most knowledgeable about the health care of the sampled child. Weights are used to account for differential sampling rates, undercoverage, nonresponse, and other sample design issues. Standard errors are calculated using balanced repeated replications that take into account the complex survey design.
Insurance Coverage
We categorize children by whether they had employer-sponsored coverage, had Medicaid/CHIP coverage, had private nongroup coverage, or were uninsured at the time of the survey. We combine Medicaid and CHIP coverage into a single category because parents cannot effectively distinguish between them. Children who report having both employer-sponsored and Medicaid or CHIP coverage are classified as having Medicaid/CHIP.5
Eligibility for Medicaid and CHIP
The analysis relies on a detailed Medicaid and CHIP eligibility simulation model that mimics the eligibility determination process faced by families in each state.6,7 The model creates two key eligibility variables. The first indicates whether the child is eligible for Medicaid or CHIP based on the rules in place 6 months before the survey interview date to build in lags in implementation and outreach about the program. This variable is used to model eligibility under the IV approach where it serves as both a dependent variable and an endogenous explanatory variable. The second indicates whether the child would have been eligible for Medicaid or CHIP had the July 2002 rules been in place in the prior years. This variable is used to identify children in the treatment and the comparison groups in the DD models. In addition, this variable is used to exclude children eligible for Medicaid under the pre-TANF welfare-related rules. While the impact estimates were robust to the inclusion of this very low-income group of children, we excluded them from our analysis because of concerns that welfare reform may have introduced confounding effects on insurance coverage that could not be disentangled.
The instrument for eligibility in the IV models is the state-age-specific income threshold for eligibility as a percentage of poverty. Medicaid and CHIP eligibility thresholds were obtained from a number of published sources including the 1999 and 2001 Annual CHIP Enrollment Reports on the Center for Medicare and Medicaid Services (CMS) website, Bruen and Ullman (1998), and Ullman, Hill, and Almeida (1999).8
Child, Parent, and Family Characteristics
Child characteristics include each child's age, race and ethnicity, health status, and whether the child has any activity limitation. Parent characteristics include health status, age, and level of education of parents and whether either parent is foreign born. Family characteristics include the number of children in the family, an indicator of family income as a percentage of poverty, and indicators of the state of residence.
Stigma and Welfare Participation
We include a proxy for the degree of stigma that the respondent feels is associated with welfare-related programs. Stigma was measured according to responses to the following statements: (1) “Welfare makes people work less than they would if there wasn't a welfare system”; (2) “Welfare helps people get on their feet when facing difficult situations such as unemployment, a divorce, or a death in the family”; and (3) “Welfare encourages young women to have babies before marriage.” Those who strongly agree or agree with statements 1 and 3 and disagree or strongly disagree with question 2 are considered to have a high level of stigma; those with the opposite pattern are considered to have a low level of stigma; and the remaining patterns are classified as having a medium level of stigma. We also include a variable indicating that the family has not received welfare in the past 2 years.
Work
To account for changes in the type of jobs held by parents, we include variables that indicate whether the head of the family (defined as the spouse of the respondent or in the case where there is no spouse, the respondents themselves) works full time, part time, or not at all, the size of the firm in which the head works, the industry in which the head works and interactions between work status and firm size, and work status and industry.
County
We account for changes in county business patterns by including variables indicating the share of workers in the county by firm size and by industry based on County Business Pattern data for 1996, 1998, and 2001 from the Census Bureau website.9 In addition, the models included county-specific unemployment rates for 1996, 1998, and 2001 obtained from the Area Resource File.
Price of Private Coverage
We derive an estimate of the price of private insurance for each family using data available on premiums and contributions for family coverage by firm size, state, and year; the distribution of workers by firm size at the county level; and whether the family has an employer offer of coverage. For children in families with an offer of employer-sponsored coverage, the price variable reflects the weighted average employee contribution for family coverage in the county. Ideally, for children in families without an offer of employer-sponsored coverage, we would use the cost of purchasing coverage in the nongroup market as an indicator of the price they face; however, these data are not available. Consequently, we use the weighted average premium for employer coverage in the county as a proxy for what it would cost the family to purchase coverage in the nongroup market, which may understate the cost for those without an offer. We estimate the weighted average price for family coverage in the county by weighting state and firm size-specific premiums and contributions by the distribution of workers by firm size in the county. Data on premiums and contributions are obtained from the MEPS insurance component tables.10 As indicated above, because of concerns that the price of insurance may be endogenous with respect to CHIP expansions, we use a 2SLS approach, estimating a first-stage model of the price of private insurance coverage, including two IVs in the first stage: the Medicare's Average Adjusted Per Capita Costs (AAPCC) index and the weighted average price for family coverage in the county.11
RESULTS
Changes in Eligibility
The expansions in eligibility thresholds undertaken by states following the creation of CHIP translated into substantial increases in eligibility for public programs among children between 1997 and 2002. In 1997, 34 percent of all children were eligible for public coverage under the Medicaid program and no children were eligible for CHIP (Table 1). By 1999, 46 percent were eligible for public coverage—32 percent for Medicaid and 14 percent for CHIP. Finally, by 2002, 48 percent were eligible for public coverage—32 percent for Medicaid and 16 percent for CHIP coverage. Among children with family incomes below 300 percent of the FPL, eligibility increases were more dramatic. In 1997, 51 percent of children in this income group were eligible for public coverage. By 2002, eligibility for public coverage had increased to 75 percent.
Table 1.
Share of 18 and under Eligible for Medicaid and CHIP
| 1997 (%) | 1999 (%) | 2002 (%) | |
|---|---|---|---|
| All children | |||
| Medicaid | 34 | 32 | 32 |
| CHIP | 0 | 14 | 16 |
| Total | 34 | 46 | 48 |
| Children under 300% of the FPL | |||
| Medicaid | 51 | 49 | 51 |
| CHIP | 0 | 20 | 24 |
| Total | 51 | 69 | 75 |
Source: 1997, 1999, and 2002 rounds of the National Survey for America's Families.
CHIP, Children's Health Insurance Program; FPL, federal poverty level.
Descriptive Results
While most of the expansion in eligibility for CHIP had occurred by 1999, CHIP programs were quite new in 1999 and many states had not yet invested heavily in outreach and enrollment simplification by this point. Therefore, effects of the eligibility expansions were not expected to be felt fully by 1999. In addition, while eligibility under the poverty-related expansions did not change over this time period, as indicated earlier, children eligible for Medicaid before CHIP were “treated” by all the outreach and enrollment simplification, most of which occurred after 1999. These patterns can be seen clearly in Table 2.
Table 2.
Insurance Coverage for Children
| 1997 | 1999 | 2002 | |
|---|---|---|---|
| Children under 300% of the FPL | |||
| Medicaid/CHIP | 28.3% | 28.9% | 40.4% |
| (0.008) | (0.007) | (0.006) | |
| Employer | 50.6% | 49.1% | 43.0% |
| (0.009) | (0.008) | (0.007) | |
| Private | 3.3% | 3.2% | 2.4% |
| (0.002) | (0.003) | (0.002) | |
| Uninsured | 17.9% | 18.8% | 14.2% |
| (0.006) | (0.007) | (0.007) | |
| Eligible for Medicaid under poverty-related expansions | |||
| Medicaid/CHIP | 32.7% | 36.9% | 48.4% |
| (0.012) | (0.012) | (0.011) | |
| Employer | 41.4% | 37.3% | 32.6% |
| (0.012) | (0.013) | (0.010) | |
| Private | 3.4% | 3.4% | 2.5% |
| (0.004) | (0.004) | (0.003) | |
| Uninsured | 22.5% | 22.4% | 16.6% |
| (0.011) | (0.012) | (0.010) | |
| Newly eligible for CHIP | |||
| Medicaid/CHIP | 7.1% | 14.2% | 26.5% |
| (0.006) | (0.009) | (0.010) | |
| Employer | 70.3% | 63.3% | 53.9% |
| (0.013) | (0.013) | (0.012) | |
| Private | 4.0% | 3.2% | 3.9% |
| (0.005) | (0.004) | (0.005) | |
| Uninsured | 18.6% | 19.4% | 15.8% |
| (0.009) | (0.011) | (0.009) | |
| Near-eligible comparison group | |||
| Medicaid/CHIP | 2.1% | 2.6% | 7.3% |
| (0.005) | (0.005) | (0.011) | |
| Employer | 90.5% | 88.4% | 83.3% |
| (0.011) | (0.014) | (0.015) | |
| Private | 3.8% | 4.1% | 3.6% |
| (0.010) | (0.008) | (0.006) | |
| Uninsured | 3.7% | 4.9% | 5.7% |
| (0.008) | (0.011) | (0.009) | |
Note: Estimates of insurance presented as percentages; standard errors are in parentheses and not presented as percentages.
Source: 1997, 1999, and 2002 rounds of the National Survey for America's Families.
CHIP, Children's Health Insurance Program; FPL, federal poverty level.
Table 2 presents data on changes in insurance coverage separately for children previously eligible for Medicaid, children made eligible by the CHIP program, and near-eligible children who constitute the comparison group. Mirroring the patterns for all children under 300 percent of the FPL, the simple descriptive statistics indicate that public coverage, through either Medicaid or CHIP, increased for both Medicaid poverty-related and CHIP-eligible children and that the largest gains occurred between 1999 and 2002. The fact that 7 percent of children in the income group that subsequently became eligible for CHIP reported some type of public coverage in 1997 reflects measurement error associated with simulating eligibility for public coverage. Likewise, public coverage is reported for the so-called near-eligible children in the comparison group and their rates of public coverage increase over the analysis period. This pattern implies that some of the children in the comparison group should have been included in the treatment group. Overall, 2 percent of the children in the near-eligible group were reported to have public coverage in 1997 and 1999, respectively; that share rose to 7 percent in 2002. The measurement error associated with assigning children to the treatment and the comparison groups should introduce downward bias in the general impact estimates.
Accompanying the increases in public coverage in the treatment groups were declines in uninsured rates, particularly between 1999 and 2002 while the comparison group actually experienced a small increase in the uninsured rate over that period. Rates of employer-sponsored coverage declined for the treatment groups and for the comparison group, but larger declines in employer coverage were observed within the treatment groups. The declines in employer-sponsored coverage were not statistically significant.
Multivariate Results—DD Approach
Table 3 presents the multivariate results from both the DD and IV approaches. Using the DD approach, we estimate that the CHIP program resulted in a 14.1 percentage-point increase in public coverage among children in the CHIP-eligible income group.12 Accompanying this increase in public coverage was a 6.2 percentage-point decline in employer-sponsored coverage and a 7.1 percentage-point decline in the probability of being uninsured. Among those eligible for Medicaid, implementation of CHIP resulted in a 12.7 percentage-point increase in Medicaid coverage and a 9.5 percentage-point reduction in uninsurance. The 2.0 percentage-point decline in employer-sponsored coverage was not statistically significant.
Table 3.
Estimates of Impact of CHIP on Coverage Using Difference-in-Difference and Instrumental Variable Approach
| Difference-in-Difference Approach |
Instrumental Variable Approach |
||||||||
|---|---|---|---|---|---|---|---|---|---|
| CHIP Eligible |
Medicaid Eligible |
Eligible for Public Coverage |
|||||||
| Insurance Coverage | Coefficient | Standard Error | p>t | Coefficient | Standard Error | p>t | Coefficient | Standard Error | p>t |
| Employer | −0.062 | 0.022 | 0.008 | −0.020 | 0.024 | 0.394 | −0.065 | 0.042 | 0.126 |
| Medicaid/CHIP | 0.141 | 0.017 | 0.000 | 0.127 | 0.020 | 0.000 | 0.198 | 0.041 | 0.000 |
| Private | 0.000 | 0.013 | 1.000 | −0.009 | 0.014 | 0.512 | 0.007 | 0.016 | 0.963 |
| Uninsured | −0.071 | 0.016 | 0.000 | −0.095 | 0.021 | 0.000 | −0.123 | 0.033 | 0.000 |
Source: 1997, 1999, and 2002 rounds of the National Survey for America's families.
CHIP, Children's Health Insurance Program.
Multivariate Results—IV Approach
The second panel of Table 3 presents results from models that used an IV approach, which suggest that CHIP had larger impacts on both public coverage and uninsured rates relative to the DD approach.13 These larger impacts may be due, in part, to the downward bias that can result from measurement error in the DD approach. Estimates from the IV approach suggest that being made eligible for the CHIP program was associated with a 19.8 percentage-point increase in the probability of coverage under CHIP a 12.3 percentage-point decline in uninsurance, and a nonsignificant decline of 6.5 percentage points in employer-sponsored coverage.
Estimates of Crowd-out, Declines in Employer Coverage, and Take-up among the Uninsured
Using the results from the regressions and data on coverage in the pre-CHIP period, we estimate the extent to which the increased public coverage is attributable to crowd-out; the share of those with employer-sponsored coverage in 1997 that dropped or lost coverage due to CHIP; and take-up among the uninsured (see Table 4). Using the DD approach, we find that crowd-out is 43.7 percent among CHIP-eligible children and 16.2 percent among Medicaid-eligible children, respectively. In contrast, the IV estimates indicate a crowd-out rate under CHIP of 32.6 percent.
Table 4.
Estimates of Crowd-Out, Declines in Employer Coverage, and Declines in Uninsurance
| Crowd-Out |
Decline in Employer Coverage |
Decline in Uninsured |
|||||||
|---|---|---|---|---|---|---|---|---|---|
| Percent | Standard Error | p | Percent | Standard Error | p | Percent | Standard Error | p | |
| Difference-in-Difference Approach | |||||||||
| CHIP eligible | 43.7 | 0.136 | 0.002 | 8.8 | 0.032 | 0.007 | 38.4 | 0.082 | 0.001 |
| Medicaid eligible | 16.2 | 0.182 | 0.377 | 5.0 | 0.058 | 0.394 | 42.5 | 0.087 | 0.001 |
| Instrumental variable approach | |||||||||
| Eligible for public coverage | 32.6 | 0.184 | 0.8 | 12.9 | 0.083 | 0.128 | 69.2 | 0.185 | 0.001 |
The results from both the IV and the DD analyses suggest that the expansion in CHIP led to about a 10 percent reduction in employer-sponsored coverage among newly and previously eligible children between 1997 and 2002, which translates into a 2 percent reduction in ESI overall (data not shown). The implied reduction in uninsurance among newly eligible children is much larger: ranging from 38.4 percent using the DD approach to 69.2 percent using the IV approach. While these estimates appear high relative to rates of uninsurance among all eligible children after implementation of CHIP, it is important to recognize that they reflect the reduction in uninsurance due to CHIP that would have occurred in the absence of other changes in the environment. In fact, uninsurance was rising significantly for other populations during the later part of the study period (Holahan and Wang 2004).
CONCLUSIONS
Assessing the impacts of CHIP on the insurance coverage of children is critical for informing state and federal policy choices in the future. The recent reauthorization of the program in the Child Health Improvement Reauthorization Act of 2009 provides states with additional federal funding to maintain and expand their programs and gives them new tools and incentives aimed at increasing participation among the uninsured children who are eligible for both Medicaid and CHIP. At the same time, states are facing large state budget deficits that may make them reluctant to expand enrollment in Medicaid and CHIP.
This paper provides new evidence on the impact of public coverage expansions and attendant investments in outreach and enrollment simplification on insurance coverage for children. Our study suggests that CHIP resulted in a 14–20 percentage-point increase in public coverage, a decline in ESI of 7 percentage points or less; and a decline in uninsurance of between 7 and 13 percentage points. The results, from the different estimation approaches we use, are consistent with one another in direction and the point estimates are not significantly different from each another.
Our estimates of crowd-out range from 33 to 43 percent for CHIP, which is in line with those produced by the IV models that focus on children under 300 percent of poverty in Hudson et al. (2005) and analogous estimates found in Gruber and Simon (2007). Thus, our estimates, when considered with the other published literature, lend support to the conclusion reached by CBO that crowd-out under CHIP was likely between 25 and 50 percent. The high end of our range of crowd-out estimates is consistent with the 40 percent estimate assumed by the Congressional Budget Office when it assessed the program at the outset in 1997, while the low end is consistent with studies of CHIP enrollees that indicate that very few drop employer-sponsored coverage to enroll in public programs and that few have access to employer insurance that cover their parents (Kenney and Cook 2007; Sommers et al. 2007;).
A new contribution of this paper is our investigation of the impact of CHIP on private coverage and on uninsurance rates. Our analysis suggests that CHIP was responsible for a 10 percent decline in ESI among the target population and a reduction of between 38 and 69 percent in the uninsured rate among the target population.
Importantly, this study indicates that the implementation of CHIP expansions and accompanying investments in outreach and enrollment simplification had impacts on children who were already eligible for Medicaid under the poverty-related expansions. Our findings suggest that implementation of CHIP resulted in a 13-percentage-point increase in Medicaid coverage and a 10-percentage-point decline in uninsurance among those previously eligible for Medicaid, with no significant decline in private insurance coverage. These results are consistent with what was experienced under the Medicaid expansions for children occurring almost a decade before CHIP wherein children who were eligible for Aid to Families with Dependent Children experienced large increases in Medicaid take-up when the expansions were implemented (Thorpe and Florence 1998–1999; Blumberg, Dubay, and Norton 2000; Yazici and Kaestner 2000; Dubay and Kenney 2001;). Our findings of larger estimates of crowd-out for CHIP-eligible as opposed to Medicaid-eligible children is also consistent with other research (Dubay and Kenney 1996; Hudson et al. 2005;) and the fact that access to employer coverage is lower among poorer families (Clemans-Cope, Garrett, and Hoffman 2006).
Given that many CHIP-eligible children remain uninsured (Hudson and Selden 2007), there is clear scope for additional take-up of public coverage among those children. Indeed, despite the increase in enrollment in public programs, over 5 million children remain uninsured even though they are eligible for coverage under Medicaid and CHIP (Dubay et al. 2007). Uninsured children are substantially less likely than their publicly covered counterparts to receive primary care services (Newacheck, Hughes, and Hung 2000; Dubay and Kenney 2001; Davidoff, Kenney, and Dubay 2005; Selden and Hudson 2006;). Their parents are also much more likely to lack confidence that they will be able to meet their family's health care needs (Dubay and Kenney 2001). To the extent that states can enroll more uninsured children in Medicaid and CHIP, access gains would accrue to even more children.
Acknowledgments
Joint Acknowledgments/Disclosure Statement: This research was conducted as part of the Assessing the New Federalism Project at the Urban Institute, with financial support from the Robert Wood Johnson Foundation. The authors are grateful to Fred Blavin, Justin Yee, and John Graves who provided expert research assistance over the course of this project; to Austin Nichols, Tom Selden, Tim Waidmann, and Doug Wissoker for expert econometric advice; and to the editors of Health Services Research for guidance on previous drafts.
Disclosures: None.
Disclaimers: The views expressed in this article are those of the authors and do not reflect those of the Urban Institute or its funders.
NOTES
Davidoff et al. (2005) include only insurance impacts for children with chronic health care problems.
Similar to Davidoff et al. (2005), we chose to use a threshold that was 50 percentage points above the CHIP threshold as the lower income bound for our comparison group because comparison groups based lower income thresholds showed higher levels of public coverage than was expected, indicating measurement error in our eligibility simulation. Using the higher income threshold allowed us to identify a group of children that was less contaminated by the treatment.
When we tested for the endogeneity of the private insurance price variable with respect to insurance coverage, we found that we could not reject the null that it was exogenous in our DD models but that we could reject the null in our IV approach. To be consistent across the two approaches, we present estimates that treat price as endogenous. The OLS results for the DD model are very similar to the 2SLS results presented here (results available on request from the authors).
Tests of whether eligibility and price were exogenous with respect to insurance coverage were rejected at the p<.10 level or smaller in each insurance equation.
Two percent of all children report having public coverage and employer-sponsored coverage. This translates into 9 percent of all children with Medicaid coverage and 2 percent of all children with employer-sponsored coverage.
For a more complete description of the simulation model, see Dubay and Kenney (2006).
It is important to note that the NSAF does not collect sufficient information to determine whether children who are not citizens are eligible for Medicaid and CHIP. To address this issue, we conduct sensitivity analyses that limit the sample to only citizen children and find no important differences in our results.
See http://www.cms.hhs.gov/CHIP/enrollment/enroll99.pdf and http://www.cms.hhs.gov/CHIP/enrollment/CHIP01.pdf
The AAPCC is designed to reflect the relative costs of care across the country and over time.
The test for weak identification in the DD model produced a Wald's F-test of 113.27. Based on Hansen's j-tests for overidentification using clustered data, we could not reject the null hypothesis for any of the insurance equations.
The test for weak identification in the IV model produced a Wald's F-test of 77.65. Based on Hansen's j-tests for overidentification using clustered data, we could not reject the null hypothesis for any of the insurance equations.
Supporting Information
Additional supporting information may be found in the online version of this article:
Appendix SA1: Author Matrix.
Please note: Wiley-Blackwell is not responsible for the content or functionality of any supporting materials supplied by the authors. Any queries (other than missing material) should be directed to the corresponding author for the article.
REFERENCES
- Bansak C, Raphael S. The Effects of State Policy Design Features on Take-up and Crowd-out Rates for the State Children's Health Insurance Program. Journal of Policy Analysis and Management. 2006;26(1):149–75. doi: 10.1002/pam.20231. [DOI] [PubMed] [Google Scholar]
- Banthin J, Selden T. The ABCs of Children's Health Care: How the Medicaid Expansions Affected Access, Burdens, and Coverage between 1987 and 1996. Inquiry. 2003;40(2):133–45. doi: 10.5034/inquiryjrnl_40.2.133. [DOI] [PubMed] [Google Scholar]
- Bennefield RL. A Comparative Analysis of Health Insurance Coverage Estimates: Data from CPS and SIPP. Paper presented at the Joint Statistical Meetings, American Statistical Association, Chicago, IL.
- Blumberg L, Dubay L, Norton S. Did the Medicaid Expansions for Children Displace Private Insurance? An Analysis Using the SIPP. Journal of Health Economics. 2000;19(1):1–32. doi: 10.1016/s0167-6296(99)00020-x. [DOI] [PubMed] [Google Scholar]
- Blumberg L, Nichols LM, Banthin JS. Workers Decision to Purchase Health Insurance. International Journal of Health Care Finance and Economics. 2001;1(3–4):305–26. doi: 10.1023/a:1013771719760. [DOI] [PubMed] [Google Scholar]
- Blumberg SJ, Cynamon ML. Misreporting Medicaid Enrollment: Results of Three Studies Linking Telephone Surveys to State Administrative Records. In: Cynamon M, Kulka R, editors. Seventh Conference on Health Survey Research Methods. Hyattsville, MD: National Center for Health Statistics; 2001. pp. 189–95. [Google Scholar]
- Bruen B, Ullman F. Children's Health Insurance Programs: Where States Are, Where They Are Headed. Assessing the New Federalism, New Federalism: Issues and Options for States Number A-20. Washington, DC: The Urban Institute.
- Buchmueller T, Cooper P, Simon K, Vistnes J. The Effect of CHIP Expansions on Health Insurance Decisions by Employers. Inquiry. 2005;42(3):218–31. doi: 10.5034/inquiryjrnl_42.3.218. [DOI] [PubMed] [Google Scholar]
- Call KT, Davidson G, Sommers AS, Feldman R, Farseth P, Rockwood T. Uncovering the Missing Medicaid Cases and Assessing Their Bias for Estimates of the Uninsured. Inquiry. 2001;38(4):396–408. doi: 10.5034/inquiryjrnl_38.4.396. [DOI] [PubMed] [Google Scholar]
- Chernew M, Frick K, McLaughlin CG. The Demand for Health Insurance Coverage by Low-Income Workers: Can Reduced Premiums Achieve Full Coverage? Health Services Research. 1997;32(4):453–70. [PMC free article] [PubMed] [Google Scholar]
- Clemans-Cope L, Garrett AB, Hoffman C. Changes in Employees' Health Insurance Coverage, 2001–2005. Issue Paper. Washington, DC: Kaiser Family Foundation; 2006. [Google Scholar]
- Currie J, Gruber J. Health Insurance Eligibility, Utilization of Medical Care, and Child Health. The Quarterly Journal of Economics. 1996;111(2):431–66. [Google Scholar]
- Cutler D, Gruber J. Does Public Insurance Crowd-out Private Insurance. Quarterly Journal of Economics. 1996;111(2):291–340. [Google Scholar]
- Davidoff A, Kenney G, Dubay L. Effects of the State Children's Health Insurance Program Expansions on Children with Chronic Health Conditions. Pediatrics. 2005;116(1):e34–42. doi: 10.1542/peds.2004-2297. [DOI] [PubMed] [Google Scholar]
- Davidson G, Blewett LA, Call KT. Public Program Crowd-out of Private Coverage: What Are the Issues? The Synthesis Project Research Synthesis Report No. 5. Princeton, NJ: Robert Wood Johnson Foundation. [PubMed]
- Dubay L, Guyer J, Mann C, Odeh M. Medicaid at the Ten-Year Anniversary of CHIP: Looking Back and Moving Forward. Health Affairs. 2007;26(2):370–81. doi: 10.1377/hlthaff.26.2.370. [DOI] [PubMed] [Google Scholar]
- Dubay L, Kenney G. Revisiting the Issues: The Effects of Medicaid Expansions on Insurance Coverage of Children. The Future of Children. 1996;6(1):152–61. [PubMed] [Google Scholar]
- Dubay L. Health Care Access and Use among Low-Income Children: Who Fares Best? Health Affairs. 2001;20(1):112–21. doi: 10.1377/hlthaff.20.1.112. [DOI] [PubMed] [Google Scholar]
- Dubay L. Assessing SCHIP Effects Using Household Survey Data: Promises and Pitfalls. Health Services Research. 2006;35(5, Pt. 3):12–27. [PMC free article] [PubMed] [Google Scholar]
- Frazis H, Loewenstein M. Estimating Linear Regressions with Mismeasured, Possibly Endogenous, Binary Explanatory Variables. Journal of Econometrics. 2003;117(1):151–78. [Google Scholar]
- Gruber J, Simon K. Crowd-out Ten Years Later: Have Recent Public Insurance Expansions Crowded out Private Health Insurance? NBER Working Paper 12858. Cambridge, MA: National Bureau of Economic Research. [DOI] [PubMed]
- Hadley J, Reschovsky JD, Cunningham P, Kenney G, Dubay L. Insurance Premiums and Insurance Coverage of Near-Poor Children. Inquiry. 2006;43(4):362–77. doi: 10.5034/inquiryjrnl_43.4.362. –2007. [DOI] [PubMed] [Google Scholar]
- Holahan J, Wang M. Changes in Health Insurance Coverage during the Economic Downturn: 2000–2002. Health Affairs (Millwood) 2004;(suppl):W4-31–42. doi: 10.1377/hlthaff.w4.31. [DOI] [PubMed] [Google Scholar]
- Hudson J, Selden T, Banthin J. The Impact of CHIP on Insurance Coverage of Children. Inquiry. 2005;42(3):232–54. doi: 10.5034/inquiryjrnl_42.3.232. [DOI] [PubMed] [Google Scholar]
- Hudson JL, Selden TM. Children's Eligibility and Coverage: Recent Trends and a Look Ahead. Health Affairs (Millwood) 2007;26(5):w618–29. doi: 10.1377/hlthaff.26.5.w618. [DOI] [PubMed] [Google Scholar]
- Kaestner R. A Note on the Effect of Minimum Drinking Age Laws on Youth Alcohol Consumption. Contemporary Economic Policy. 2000;18(3):315–25. [Google Scholar]
- Kaestner R, Dubay L, Kenney G. Managed Care and Infant Health: An Evaluation of Medicaid in the U.S. Social Science and Medicine. 2005;60(8):1815–33. doi: 10.1016/j.socscimed.2004.09.001. [DOI] [PubMed] [Google Scholar]
- Kenney G, Cook A. Coverage Patterns among CHIP-Eligible Children and Their Parents. Health Policy Online, No. 15, The Urban Institute, Washington, DC.
- Kenney G, Zuckerman S, Rajan S, Brennan N, Holahan J. The National Survey of America's Families: An Overview of the Health Care Component. Inquiry. 1999;36(3):353–62. [PubMed] [Google Scholar]
- Lewis K, Ellwood M, Czajka J. Counting the Uninsured: A Review of the Literature. Assessing the New Federalism. Occasional Paper No. 8. Washington, DC: The Urban Institute.
- Lo Sasso AT, Buchmueller TC. The Effect of the State Children's Health Insurance Program on Health Insurance Coverage. Journal of Health Economics. 2004;23(5):1059–82. doi: 10.1016/j.jhealeco.2004.03.006. [DOI] [PubMed] [Google Scholar]
- Newacheck P, Hughes D, Hung Y. The Unmet Health Needs of America's Children. Pediatrics. 2000;105(4):989–97. [PubMed] [Google Scholar]
- Safir A, Scheuren F, Wang K. National Survey of America's Families: Survey Methods and Data Reliability. In: Black T, Finegold K, Garrett AB, Safir A, Scheuren F, Wang K, Wissoker D, Brick JM, Cantor D, Ferraro D, Ingram D, Montaquila J, O'Hare J, Strickler T, editors. NSAF Collection of Papers: Report No. 7.” Assessing the New Federalism NSAF Methodology Reports. Washington, DC: The Urban Institute; 2001. [Google Scholar]
- Selden T, Hudson J. Access to Care and Utilization among Children: Estimating the Effects of Public and Private Coverage. Medical Care. 2006;44(5):I19–26. doi: 10.1097/01.mlr.0000208137.46917.3b. [DOI] [PubMed] [Google Scholar]
- Sommers A, Zuckerman S, Dubay L, Kenney G. Substitution of CHIP for Private Coverage: Results from a 2002 Evaluation in Ten States. Health Affairs. 2007;26(2):529–37. doi: 10.1377/hlthaff.26.2.529. [DOI] [PubMed] [Google Scholar]
- Thorpe KE, Florence CS. Health Insurance among Children: The Role of Expanded Medicaid Coverage. Inquiry. 1998;35(4):369–79. –1999. [PubMed] [Google Scholar]
- Ullman F, Hill I, Almeida R. CHIP: A Look at Emerging State Programs. Assessing the New Federalism, No. A-35. Washington, DC: The Urban Institute.
- Yazici E, Kaestner R. Medicaid Expansions and the Crowding out of Private Health Insurance among Children. Inquiry. 2000;37(1):23–32. [PubMed] [Google Scholar]
Associated Data
This section collects any data citations, data availability statements, or supplementary materials included in this article.