

Abstract
The transcription of iron uptake and storage genes in S. cerevisiae is primarily regulated by the transcription factor Aft1. Nucleocytoplasmic shuttling of Aft1 is dependent upon mitochondrial Fe-S cluster biosynthesis via a signaling pathway that includes the cytosolic monothiol glutaredoxins (Grx3 and Grx4) and the BolA homologue Fra2. However the interactions between these proteins and the iron-dependent mechanism by which they control Aft1 localization are unclear. To reconstitute and characterize components of this signaling pathway in vitro, we have overexpressed yeast Fra2 and Grx3/4 in E. coli. We have shown that co-expression of recombinant Fra2 with Grx3 or Grx4 allows purification of a stable [2Fe-2S]2+ cluster-containing Fra2-Grx3 or Fra2-Grx4 heterodimeric complex. Reconstitution of a [2Fe-2S] cluster on Grx3 or Grx4 without Fra2 produces a [2Fe-2S]-bridged homodimer. UV-visible absorption and CD, resonance Raman, EPR, ENDOR, Mössbauer, and EXAFS studies of [2Fe-2S] Grx3/4 homodimers and the [2Fe-2S] Fra2-Grx3/4 heterodimers indicate that inclusion of Fra2 in the Grx3/4 Fe-S complex causes a change in the cluster stability and coordination environment. Taken together, our analytical, spectroscopic, and mutagenesis data indicate that Grx3/4 and Fra2 form a Fe-S-bridged heterodimeric complex with Fe ligands provided by the active site cysteine of Grx3/4, glutathione, and a histidine residue. Overall, these results suggest that the ability of the Fra2-Grx3/4 complex to assemble a [2Fe-2S] cluster may act as a signal to control the iron regulon in response to cellular iron status in yeast.
Maintenance of optimal iron levels inside the cell is critical for all eukaryotes and most prokaryotes, for iron is both essential and potentially toxic. As a protein cofactor, iron can bind directly to amino acids, forming mono- or di-nuclear iron centers, or it can be incorporated with porphyrins or sulfide to form heme or Fe-S clusters, respectively. However, uncontrolled iron redox chemistry can lead to formation of reactive oxygen species, causing extensive cellular and molecular damage that eventually leads to cell death (1). Therefore, cells must be able to sense iron levels and regulate iron homeostasis accordingly to maintain critical, non-toxic levels of this key nutrient.
The expression of iron uptake and storage genes in the model eukaryote S. cerevisiae is primarily controlled by the Fe-responsive transcription factor Aft1. Aft1 is located in the cytosol under iron-replete conditions and moves to the nucleus under iron-depleted conditions, where it activates genes involved in high affinity ionic iron uptake, siderophore iron uptake, and vacuolar iron transport, known collectively as the iron regulon (2–7). Nucleocytoplasmic shuttling of Aft1 in yeast is regulated by mitochondrial Fe-S cluster biosynthesis via a signaling pathway that includes the cytosolic monothiol glutaredoxins (Grx3 and Grx4), the BolA homologue Fra2, and the uncharacterized protein Fra1 (8–11). When Fe-S cluster biosynthesis is active (i.e. under Fe replete conditions), this signaling pathway is proposed to induce multimerization of Aft1 in an unknown manner to promote its export from the nucleus (12). A 291CXC293 motif is required for Aft1 translocation in response to iron, but the specific function of these residues is unclear (2, 11, 12). Under low iron conditions or upon disruption of mitochondrial Fe-S cluster biogenesis, the Fra1/Fra2/Grx3/Grx4 pathway is shut off, allowing Aft1 to accumulate in the nucleus and activate iron uptake systems. Despite the identification of multiple components in this signaling pathway, the specific mechanism of iron-dependent regulation of Aft1 localization by Fra2 and Grx3/4 is a key gap in our understanding of intracellular iron metabolism.
Yeast Grx3 and Grx4 are members of the monothiol glutaredoxin (Grx) family, which is found in organisms ranging from bacteria to humans. Grx3 and Grx4 are highly homologous proteins that possess both an N-terminal thioredoxin (Trx)-like domain and a C-terminal Grx-like domain (13). Cytosolic Grx3 and Grx4 perform redundant functions since deletion of each gene singly has little effect on iron regulation, while a grx3Δ grx4Δ double mutant exhibits constitutive expression of iron regulon genes (9, 10). The putative active site in the Grx-like domain of Grx3/4 has a highly conserved CGFS motif that is specifically required for interaction with Aft1 and regulation of its activity (9). A third CGFS-type monothiol Grx in yeast (Grx5) is localized to mitochondria where it plays an essential but ill-defined role in mitochondrial Fe-S cluster biogenesis (14, 15). The human homologue of the yeast cytosolic monothiol Grxs (hGrx3, also known as PICOT for PKC-interacting cousin of Trx) was initially identified in T lymphocytes where it acts as a negative regulator of Protein Kinase C-θ via an unknown mechanism (16). More recently, mammalian Grx3 was shown to inhibit cardiomyocyte hypertrophy (i.e., thickening of the heart muscle) by binding to the muscle LIM protein (MLP) and blocking the stress-responsive, prohypertrophic calcineurin–nuclear factor of activated T-cells (NFAT) signaling pathway (17).
Grxs are both part of the Trx-fold superfamily and typically catalyze thiol-disulfide exchange reactions via monothiol or dithiol mechanisms (18). The dithiol mechanism requires 2 Cys in the active site (usually in a CPYC motif), with the N-terminal Cys forming a mixed disulfide between Grx and the target protein, which is resolved by the second active site Cys. The 1-Cys mechanism requires only the N-terminal Cys in the active site and is used for reducing mixed disulfides between GSH and target proteins. Although the N-terminal Cys is conserved in CGFS-type monothiol Grxs, they lack oxidoreductase activity when tested with standard Grx model substrates (18). Several members of the monothiol Grxs family, including yeast Grx3 and Grx4, were recently shown to form [2Fe-2S]-bridged homodimers with the CGFS active sites providing 2 Cys ligands (19–21). Interestingly, two glutathione molecules (GSH or γ-glutamylcysteinylglycine) provide the other two cluster ligands. GSH is an abundant tripeptide that serves as the primary intracellular thiol redox buffer and a cofactor for glutaredoxins and other antioxidant enzymes (22). In the three published crystal structures of [2Fe-2S]-bridged dithiol and monothiol Grx proteins, the GSH molecules are covalently linked to the cluster, but held in place by non-covalent interactions with the GSH binding pocket in the Grx protein (21, 23, 24). GSH seems to play a role in yeast Grx3/4 function since GSH-binding residues in Grx3/4 are essential for regulation of Aft1 activity (9). Based on previous studies, several possible functions for monothiol Grxs in iron metabolism have been proposed. Grxs may act as scaffolds for Fe-S cluster assembly, delivery proteins for Fe-S cluster transfer, regulators of Fe-S cluster assembly, or Fe-S dependent sensors that relay cellular iron status to iron-responsive transcription factors (19–21). In any case, the unusual GSH-ligated Fe-S cluster in monothiol Grxs directly links iron homeostasis with Fe-S cluster assembly and thiol redox regulation.
Several lines of evidence suggest that the monothiol Grxs function together with another widely conserved protein family, the BolA-like proteins (25). BolA was originally identified in E. coli as a protein that induces a round cell shape when overexpressed (26). Although BolA-like proteins are found in a wide variety of prokaryotes and eukaryotes, their specific molecular function is unknown. Genome-wide yeast two-hybrid assays have identified a physical interaction between cytosolic monothiol Grxs and BolA-like proteins in both S. cerevisiae and D. melanogaster (27, 28). In addition, proteome-wide FLAG- and TAP-tag affinity purification studies in yeast and E. coli have shown that BolA-like proteins such as Fra2 co-purify with monothiol Grxs (29–31). The physical interaction between yeast Grx3/Grx4 and the BolA-like protein Fra2 was recently confirmed by immunoprecipitation and split YFP tagging (8). Finally, comparative genomic analyses also predict a functional interaction between monothiol Grxs and BolA-like proteins since they are neighbors in several prokaryotic genomes (Fig. 5C) (25). Furthermore, genes encoding the BolA and monothiol Grx proteins exhibit strong genome co-occurrence since almost all organisms that possess a BolA-like protein also have a CGFS monothiol Grx, while organisms that lack a BolA-like protein almost always lack a CGFS-type Grx (25, 32). Taken together, these data demonstrate a strong phylogenetic connection between the two protein families. However, the nature of the interaction between CGFS-type Grxs and BolA-like proteins has not been previously determined.
This study is aimed at characterizing the interaction between yeast Grx3/4 and Fra2 in vitro using biochemical, spectroscopic, and analytical techniques. We show here that both Grx3 and Grx4 form [2Fe-2S]-containing heterodimers with Fra2 that have similar Fe-S coordination environments. However, the UV-visible absorption, CD, resonance Raman, EPR, ENDOR, Mössbauer, and EXAFS spectra of reconstituted [2Fe-2S]-bridged Grx3 or Grx4 homodimers are markedly different from [2Fe-2S] Fra2-Grx3/4 heterodimers, indicating differences in cluster coordination. Furthermore, we have determined that conserved residues required for Grx3 and Grx4 Fe signaling in vivo are also required for Fe-S complex formation with Fra2 in vitro. This study thus provides new insight into the molecular details of intracellular Fe signaling and establishes the ubiquitous monothiol Grxs and BolA-like proteins as a novel type of Fe-S cluster binding regulatory complex.
EXPERIMENTAL PROCEDURES
Plasmid Construction
Construction of the yeast Grx3 E. coli expression vector pET21a-Grx3 was described previously (33). The ORF of yeast Grx4 were amplified from S. cerevisiae genomic DNA by PCR using the primers shown in Supplementary Table 1 and cloned into the NdeI and EcoRI sites of pET21a (Novagen) to generate pET21a-Grx4. E. coli expression vectors for His-tagged Fra1 (pET21a-Fra1-His6) and Fra2 (pET21a-Fra2-His6) were kindly provided by Jerry Kaplan (University of Utah) (8). The untagged Fra2 expression vector pET21a-Fra2 was constructed by amplifying the Fra2 ORF without the His tag from pET21a-Fra2-His6 and reinserting the gene at the NdeI and SacI sites in pET21a (see primers in Supplementary Table 1). Fra1-His6 (from pET21a-Fra1-His6) and untagged Fra2 (from pET21a-Fra2) were sub-cloned into the first and second multiple cloning sites (NcoI/SacI and NdeI/KpnI) of the co-expression vector pRSFDuet-1 (Novagen), respectively, to generate pRSFDuet-1-Fra1-His6/Fra2 and pRSFDuet-1-Fra2. Grx3 mutants were created by site-directed mutagenesis of pET21a-Grx3 (QuikChange kit, Stratagene) using primers listed in Supplementary Table 1. pET21a-Grx3(Δ1–121) was created by introducing an NdeI restriction site at position 122 in pET21a-Grx3 by site-directed mutagenesis, digesting the plasmid with NdeI to remove the coding sequence for amino acids 1–121, and religating the plasmid. pET21a-Grx3(Δ122–250) were created by introducing a stop codon and HindIII site at position 122, digesting the plasmid with HindIII to remove the coding sequence for amino acids 122–250, and religating the plasmid. The cDNA for human Grx2 (hGrx2) (Open Biosystems) was PCR amplified without the mitochondrial targeting signal (amino acids 41–164) and subcloned into pET24d (Novagen) using the NcoI and EcoRI restriction sites to make pET24d-hGrx2. The sequence integrity of all plasmids was confirmed by double-stranded DNA sequencing (Environmental Genomics Facility, University of South Carolina School of Public Health).
Protein Expression and Purification
Recombinant Grx3 and Grx4 were both purified using the previously published protocol for Grx3 (33). We note that recombinant Grx3 was cloned from the second start site (encoding Met36) to the stop codon after determining that the first start site (encoding Met1) was not utilized in vivo (N. Dingra & C. Outten, unpublished data). The Grx3 amino acid sequence numbering in this study thus starts with the second start site as Met1. Grx3 (or Grx4) was co-expressed with Fra1 and Fra2 by transforming pET21a-Grx3 (or pET21a-Grx4) and pRSFDuet-1-Fra1-His6/Fra2 into the E. coli strain BL21(DE3). Generally, 1 L LB culture was grown with shaking at 30 °C and induced with 1 mM isopropyl-β-D-thiogalactoside (IPTG) at OD600 0.6 ~ 0.8. The cells were collected by centrifugation 18 hrs after induction and resuspended in 50 mM Tris-MES, pH 8.0, followed by sonication and centrifugation to remove the cell debris. The cell-free extract was loaded onto a DEAE anion-exchange column (GE Healthcare) equilibrated with 50 mM Tris-MES, pH 8.0. The protein was eluted with a salt gradient and the fractions containing Grx3 (or Grx4) and Fra2 were pooled and concentrated to 2 mL. A fraction of Fra2 that was not bound to Grx3 was also present in the DEAE flow-through and further purified as described below. (NH4)2SO4 was added to the Fra2-Grx3 (or Fra2-Grx4) complex to a final concentration of 1 M and the sample was loaded onto a Phenyl-Sepharose column (GE Healthcare) equilibrated with 50 mM Tris-MES, pH 8.0, 100 mM NaCl, 1 M (NH4)2SO4. The protein was then eluted with a decreasing (NH4)2SO4 salt gradient and the fractions containing Grx3 (or Grx4) and Fra2 were concentrated and loaded onto a HiLoad Superdex 75 gel filtration column (GE Healthcare) equilibrated with 50 mM Tris-MES, pH 8.0, 150 mM NaCl. The purest fractions of the Fra2-Grx3/4 complex as judged by SDS-PAGE were collected and concentrated to ~250 µL with the addition of 5% glycerol and stored at −80 °C. Purification of Fra2-Grx3/4 was done aerobically, however the procedure was completed in 1 day using degassed buffers to minimize loss of the Fe-S cluster.
57Fe-labeled samples of the Fra2-Grx3 or Fra2-Grx4 complex for Mössbauer studies were prepared by growing the E. coli recombinant Fra2-Grx3 or Fra2-Grx4 co-expression strain in media supplemented with 57FeSO4. One liter of cells were first grown at 30 °C in LB media to OD600 ~ 0.6, then collected by centrifugation and resuspended into 1 L fresh M9 minimal media with 0.2% gluconate. The cells were grown at 30 °C for 30 min, then 57FeSO4 and IPTG were added at 50 µM and 1 mM final concentrations, respectively. The cells were collected by centrifugation 18 hrs after induction. Subsequent purification of 57Fe-labeled Fra2-Grx3 or Fra2-Grx4 utilized the same protocol described in the previous paragraph.
For purification of Fra2 without Grx3 or Grx4, BL21(DE3) E. coli cells were transformed with pET21a-Fra2. Fra2 expressed in this strain resides in inclusion bodies, thus requiring unfolding and subsequent refolding to purify. However, uncomplexed Fra2 could be purified from the DEAE column flow-through from cells co-expressing Grx3 and Fra2 as mentioned above. The Fra2-containing DEAE flow-through fractions were adjusted to pH 6.0 and loaded onto an SP FF cation-exchange column (GE Healthcare) equilibrated with 50 mM MES-Na, pH 6.0. Fra2 was eluted with a salt gradient, concentrated, and loaded onto a HiLoad Superdex 75 gel filtration column (GE Healthcare) equilibrated with 50 mM Tris-MES, pH 8.0, 150 mM NaCl. The purest fractions of Fra2 were collected, and concentrated to ~500 µL with the addition of 5% glycerol and stored at −80°C. The yield of uncomplexed Fra2 from the DEAE flow-through was highest when Fra2 was coexpressed with C176S Grx3 (see Results).
Recombinant hGrx2 was overexpressed in the E. coli BL21(DE3) strain and grown at 37 °C with shaking until OD600 = 0.6. The cultures were cooled to 20 °C and 1 mM IPTG was added to induce hGrx2 expression. After overnight growth (~ 18 hrs) at RT, cells were harvested by centrifugation and stored at −80 °C. The cell pellet was subjected to three freeze-thaw cycles and soluble protein was extracted with 50 mM Tris-HCl, pH 8.0. The protein was precipitated with 25–60% (NH4)2SO4 and the pellet resuspended in 50 mM Tris-HCl, pH 8.0 and subsequently loaded on a desalting column followed by a DEAE column (GE Healthcare) both equilibrated with 50 mM Tris-HCl, pH 8.0. The majority of hGrx2 did not bind to the DEAE column and was collected in the flow-through. These fractions were concentrated and loaded onto a HiLoad Superdex 75 gel filtration column (GE Healthcare) equilibrated with 50 mM Tris-HCl, pH 8.0, 150 mM NaCl. [2Fe-2S] hGrx2 elutes as a dimer, while apo hGrx2 elutes as a monomer as previously reported (34).
In vitro Fe-S Cluster Reconstitution on Apo Grx3 and Grx4
Reconstitution of an Fe-S cluster on apo Grx3, 1 mM in 100 mM Tris-HCl buffer at pH 7.8, was carried under anaerobic conditions (O2 < 5 ppm) in a glove box (Vacuum Atmospheres, Hawthorne, CA). The reaction mixture involved 2 mM GSH, a 16-fold excess of ferrous ammonium sulfate (57Fe-labeled for Mössbauer samples) and L-cysteine, and catalytic amounts of A. vinelandii NifS (6.27 µM), and was incubated at room temperature for 50 min. Reagents in excess were removed anaerobically by loading onto a High-Trap Q-Sepharose column (GE Healthcare) inside the glove box. Elution was achieved using a NaCl gradient with cluster-bound Grx3 eluting between 0.60 and 0.70 M NaCl. Samples were pooled together as a single fraction before concentrating and desalting using Amicon ultrafiltration with YM10 membrane. The same protocol was followed for reconstituting an Fe-S cluster on apo Grx4.
Biochemical Analysis
Protein concentrations were determined by the Bradford assay (Bio-Rad) using bovine serum albumin as the standard. Iron concentrations were determined using the colorimetric ferrozine assay (35). Acid-labile sulfur concentrations were determined using published methods (36, 37). For GSH measurements, the purified Fe-S protein complexes were denatured and precipitated with 1% 5-sulfosalicylic acid and GSH in the supernatant was measured by the 5,5'-dithiobis(2-nitrobenzoic acid)-GSSG reductase cycling assay as previously described (38).
Analytical and Spectroscopic Methods
Analytical gel filtration analyses were performed on a Superdex 75 10/300 GL column (GE Healthcare) equilibrated with 50 mM Tris-MES, pH 8.0, 150 mM NaCl and calibrated with the Low Molecular Weight Gel Filtration Calibration kit (GE Healthcare). The buffer was bubbled with N2 overnight and degassed to minimize dissolved O2 levels. Elution profiles were recorded at 280 nm with a flow rate of 0.5 mL/min. UV-visible absorption spectra were recorded using a Beckman DU-800 or Shimadzu UV-3101 spectrophotometer and CD spectra were recorded on identical samples using a Jasco J-715 spectropolarimeter. Mass spectrometry analysis of purified proteins was determined using a Bruker UltraFlex MALDI-TOF/TOF mass spectrometer. A saturated solution of sinapinic acid in 50% acetonitrile and 0.1% trifluoroacetic acid was used as the matrix and myoglobin and ubiquitin were the calibration standards. Resonance Raman spectra were recorded as previously described (39), using an Instruments SA Ramanor U1000 spectrometer coupled with a Coherent Sabre argon ion laser, with 20 µL frozen droplets of 1.5–2.6 mM sample mounted on the cold finger of an Air Products Displex Model CSA-202E closed cycle refrigerator. X-band (~ 9.6 GHz) EPR spectra were recorded using a ESP-300D spectrometer (Bruker, Billerica, MA), equipped with an ESR 900 helium flow cryostat (Oxford Instruments, Concord, MA), and quantified under non-saturating conditions by double integration against a 1.0 mM CuEDTA standard. Q-band (~ 35 GHz) CW ENDOR experiments were carried out at 2 K using a spectrometer described previously (40). Mössbauer spectra were recorded by using the previously described instrumentation (41). The zero velocity of the spectra refers to the centroid of a room temperature spectrum of a metallic Fe foil. Analysis of the Mössbauer data was performed with the WMOSS program (SEE, Co.).
X-ray absorption spectra were measured at the National Synchrotron Lightsource (NSLS) beamline X3-B and at Stanford Synchrotron Radiation Laboratory (SSRL) beamlines 9-3 and 7-3. Concentrated samples of the Fra2-Grx3/4 heterodimer were mixed with glycerol (final concentration 30% v/v glycerol and 1–2 mM Fe) and were frozen in a Lucite sample cell covered with Kapton tape. Spectra were collected at cryogenic temperatures using a helium displex cryostat at NSLS (30K) or with an Oxford Instruments continuous flow liquid helium crysostat at SSRL (10K). Beamlines were equipped with double crystal monochromators with Si[111] (NSLS) or Si[220] (SSRL) crystals. Harmonic rejection mirrors were used and spectra were collected under fully tuned conditions. Canberra solid-state Germanium detectors (13 element (NSLS) or 30 element (SSRL)) were used to detect the iron Kα fluorescence. Data points were collected every 5-eVs in the pre-edge region, every 0.25 eVs in the edge region, and every 0.05 k in the EXAFS region. Scans were typically collected for 45 minutes, with data acquisition time increasing to 5 seconds/point at higher k. Each scan and detector element was examined for electronic anomalies and photoreduction effects before averaging 6–12 individual scans for analysis. Scans were individually calibrated by simultaneously measuring the spectrum of an Fe foil. Scans were energy shifted such that the rising inflection of the Fe edge in the foil spectrum was 7111.2 eV. Though the Fra2-Grx3/4 samples were not readily photoreduced, we did observe minor shifts in edge energy from scan to scan. As a precaution, the beam size was reduced to 1 mm × 3 mm and new scans were initiated at fresh locations of the sample surface. At this size, six fresh sample spots were monitored per sample. Replicate samples were measured with equivalent results.
Data were processed using the Mac OS 10 version of EXAFSPAK, a suite of data analysis programs available on the SSRL website. This program was interfaced to Feff7.2 to generate the theoretical scattering models used in the fits. The value of ΔE0 was fixed to a value of −10 eV and the scale factor was fixed at 0.9, values that yield the correct crystallographically-determined bond lengths and coordination numbers for iron model complexes. Bond length, R, and the Debye-Waller factor (σ2) were varied freely in each fit. Coordination numbers were incremented in fractional steps to refine the optimal number based on goodness of fit. Fit quality was judged using a modified F value, F′, that adjusts for the number of variables used in a fit. All fits reported here are to unfiltered data over a k range of 1–14 Å−1. Both single scattering and multiple scattering models were used to fit the data. In the latter, parameters for an imidazole ring scatterer were used to model histidine ligands. For these fits, the Fe-Nimid distance and σ2 values were floating freely, and the other atoms in the imidazole ring were linked to the refined value Fe-Nimid.
RESULTS
Fra2 and Grx3/4 co-purify as a heterodimeric complex
To characterize the interactions between Fra2, Grx3, and Grx4, the individual proteins were initially expressed and purified separately for in vitro analysis. Soluble recombinant Grx3 and Grx4 were easily extracted from E. coli yielding the apo, monomeric forms upon aerobic purification (Figure 1, Table 1). However, recombinant Fra2 was largely found in inclusion bodies and partially degraded upon purification (Figure 1). The molecular mass of the purified proteins (with the 1st Met removed in each case) was confirmed by MALDI-TOF mass spectrometry (Table 1). Since Fra2 interacts with Fra1 and Grx3/4 in vivo (8), we tested whether co-expression of the interacting proteins improved the solubility of Fra2. Fra1, Fra2 and Grx3 were co-expressed using an E. coli strain co-transformed with one plasmid expressing Fra1 and Fra2 and another expressing Grx3. After collecting the induced cells, we immediately noted that the cell pellet was a reddish-brown color that was not observed when the proteins were expressed separately. SDS-PAGE analysis showed that Fra2 and Grx3 were both expressed at high levels, while the Fra1 protein was not visibly detectable (expected mass = 86.0 kD with His tag) (Figure 1A). Furthermore, Fra2 and Grx3 were found to co-purify as a reddish-brown-colored complex with a higher apparent molecular mass than the individual proteins as determined by analytical gel filtration (Figure 1B, Table 1). Similar results were obtained upon co-expression of Fra2 with Grx4. The reddish-brown Fra2-Grx complex was also purified upon expression of Fra2-Grx3 or Fra2-Grx4 without Fra1, indicating that Fra1 was not required for the interaction between Fra2 and Grx3/4. The apparent molecular masses of the Fra2-Grx3 and Fra2-Grx4 complexes as determined by size-exclusion chromatography were somewhat larger than the calculated molecular masses of the heterodimers, and the monomer forms of Fra2, Grx3, and Grx4 also ran slightly larger than their calculated molecular masses (Table 1). Fra2 and Grx3/4 are separated into two resolved bands when subjected to both non-reducing and reducing SDS-PAGE, indicating that the interaction between Fra2 and Grx3/4 does not involve a covalent, intermolecular disulfide bond.
Figure 1.

Fra2 and Grx3/4 copurify as a complex. (A) SDS-PAGE analysis of purified Fra2 and Grx3. Fra2 and Grx3 were individually or co-expressed. NI = non-induced cells, I = induced cells, P = purified protein. The 12–13 kDa band below Fra2 in the purified Fra2 and Grx3-Fra2 lanes is a degradation product of Fra2. The bands shown with an asterisk in the last lane were identified by MALDI-TOF as the E. coli translational elongation factors TufA (43.4 kD) and FusA (77.6 kD). (B) Gel filtration chromatograms of apo (upper chromatogram) and Fe-S forms (bottom chromatogram) of Fra2 and Grx3 (0.5 µg loaded).
Table 1.
Molecular mass analysis of Fra2, Grx3, and Grx4 complexes. All masses shown in Da.
| Sample | Gel Filtration | MALDI | Theoretical |
|---|---|---|---|
| Apo-Fra2 | 19500 | 13971, 12824a |
13971 (monomer) |
| Apo-Grx3 | 37000 | 28120 | 28130 (monomer) |
| Apo-Grx4 | 37200 | 27492 | 27493 (monomer) |
| [2Fe-2S] Grx3-Fra2 | 52600 | NDb | 42101 (heterodimer) |
| [2Fe-2S] Grx4-Fra2 | 52800 | ND | 41464 (heterodimer) |
| [2Fe-2S] Grx3 | 71500 | ND | 56260 (homodimer) |
| [2Fe-2S] Grx4 | 65700 | ND | 54968 (homodimer) |
This second peak is attributed to the Fra2 proteolytic fragment shown in Figure 1A.
ND, not determined
Fra2-Grx3/4 binds a [2Fe-2S]2+ cluster
The UV-visible absorption spectra of both Fra2-Grx complexes are nearly identical with absorption peaks at 320, 393, and 435 nm (Figure 2) that are indicative of an [2Fe-2S]2+ cluster (42, 43). Moreover, iron and acid-labile sulfide analyses indicate an Fe:S2− ratio close to 1:1 for both Grx3-Fra2 and Grx4-Fra2 (Table 2). Assuming that Fra2 and Grx3/4 form heterodimers, the analytical data for three distinct preparations indicated 1.7 ± 0.2 Fe and 1.7 ± 0.2 S2− per Fra2-Grx3 heterodimer and 1.4 ± 0.1 Fe and 1.3 ± 0.1 S2− per Fra2-Grx4 heterodimer, suggesting the presence of ~0.85 [2Fe-2S]2+ clusters per Fra2-Grx3 heterodimer and ~0.7 [2Fe-2S]2+ clusters per Fra2-Grx4 heterodimer in aerobically purified samples. Based on the analytical data and the Mössbauer data for [2Fe-2S] Fra2-Grx3, which indicate that 97% of the Fe is in the form of [2Fe-2S]2+ clusters (see below), the UV-visible absorption data indicate an extinction coefficient at 393 nm = 8.3 ± 1.0 mM−1 cm−1 on a per cluster basis for the [2Fe-2S]2+ center in the Fra2-Grx3/4 heterodimer, which is at the middle of the range reported for the dominant band in the 390–430 nm region from [2Fe-2S]2+ clusters (42). As mentioned above, monothiol Grxs have been shown to form [2Fe-2S]-bridged homodimers (19–21), however a [2Fe-2S]-bridged heterodimer involving Grx and another protein has not previously been reported.
Figure 2.

UV-visible absorption spectra of as-purified forms of Fe-S cluster-bound Fra2-Grx3 (black line) and Fra2-Grx4 (gray line). ε values are based on Fra2-Grx heterodimer concentrations.
Table 2.
Fe, S2−, and GSH measurements in purified Fe-S proteins. Molar values reported per dimer. Data are the average of three independent samples.
| Sample | Fe | S2− | GSH | Fe : S : GSH |
|---|---|---|---|---|
| [2Fe-2S] Fra2-Grx3 | 1.7 ± 0.2 | 1.7 ± 0.2 | 0.8 ± 0.1 | 1 : 1 : 0.5 |
| [2Fe-2S] Fra2-Grx4 | 1.4 ± 0.1 | 1.3 ± 0.1 | 0.6 ± 0.1 | 1 : 0.9 : 0.4 |
| [2Fe-2S] hGrx2 | 1.9 ± 0.1 | 2.0 ± 0.1 | 1.5 ± 0.1 | 1 : 1 : 0.8 |
To test whether Fe-S binding is required for the Fra2-Grx3/4 interaction in vitro, the purified Fra2-Grx3 heterodimer was treated with 20-fold excess EDTA and DTT anaerobically for 1 hr at 4 °C, then loaded onto an analytical gel filtration column. The proteins lost the reddish-brown color, but still co-eluted as a heterodimeric complex. Measurement of Fe and acid-labile sulfide in the eluted apo heterodimer confirmed loss of the cluster (≤0.3 Fe/heterodimer, ≤0.5 S2−/heterodimer), suggesting that the Fra2-Grx3 interaction is not absolutely metal-dependent. This result is consistent with in vivo co-immunoprecipitation studies demonstrating that Fra2 and Grx3/4 interact under both high and low iron growth conditions in yeast (8).
[2Fe-2S]2+ Fra2-Grx3/4 binds 1 GSH per cluster
Since Grx Fe-S homodimers are proposed to include GSH molecules as cluster ligands (19–21, 23), the GSH content of purified [2Fe-2S] Fra2-Grx3/4 was measured. The data indicate that the Fra2-Grx3/4 complex binds one GSH per cluster (Fe:S:GSH ratio of 1:1:0.5) (Table 2). As a positive control, we measured the Fe, S2−, and GSH content of purified human Grx2. Human Grx2 (hGrx2) is a dithiol glutaredoxin and forms [2Fe-2S]-bridged homodimers with 2 GSH ligands per cluster, similar to monothiol Grxs (21, 23). As expected, the Fe:S:GSH ratio of the hGrx2 homodimer was closer to 1:1:1 (Table 2).
Spectroscopic characterization of Fe-S cluster-bound forms of Fra2-Grx3/4 and Grx3/4
UV-visible absorption and CD, resonance Raman, Mössbauer, EPR, EXAFS, and ENDOR spectroscopic studies were undertaken to compare the type, stoichiometry, ligation and properties of Fe-S clusters associated with Fra2-Grx3/4 heterodimers and Grx3/4 homodimers. Since UV-visible absorption/CD and resonance Raman spectra indicate identical clusters in the Fra2-Grx3 and Fra2-Grx4 heterodimers and in the Grx3 and Grx4 homodimers, data are only presented for the Fra2-Grx3 heterodimers and the Grx3 homodimers. Although aerobic purification of recombinant yeast Grx3 and Grx4 yields the apo monomer protein, a significant fraction of Fe-S cluster-bound Grx3 was observed for semi-anaerobic preparations involving degassed buffer solutions. Furthermore, as previously demonstrated for a monothiol Grx (19, 20), the spectroscopic properties of the Fe-S clusters in the as-purified samples were similar to those observed for apo Grx3/4 samples subjected to anaerobic cysteine desulfurase-mediated Fe-S cluster reconstitution and repurification in the presence of GSH. Hence only the spectroscopic and analytical results for the Fe-S cluster-bound forms of reconstituted Grx3 are presented herein. The apparent molecular masses of Fe-S cluster-reconstituted Grx3 and Grx4, as judged by analytical gel filtration, were consistent with the formation of homodimers (Figure 1B, Table 1).
UV-visible absorption and CD spectroscopy reveal differences in the cluster coordination environment of [2Fe-2S] Fra2-Grx3 and [2Fe-2S] Grx3
The UV-visible absorption and CD spectra of Fe-S cluster-bound forms of the Fra2-Grx3 heterodimer and the Grx3 homodimer are compared in Figure 3. Both the absorption and CD spectra of Fe-S cluster-reconstituted Grx3 are very similar to the recently published spectra for the subunit-bridging [2Fe-2S]2+ cluster in monothiol GrxS14 from plant chloroplasts (19). Iron and protein analyses of three distinct samples indicated 2.2 ± 0.2 Fe per homodimer, and Mössbauer studies of one of these samples revealed that 90% of the Fe is in the form of a [2Fe-2S]2+ cluster with 10% of the Fe corresponding to an adventitiously-bound Fe(II) species (see below). Hence, the analytical data indicate 1.0 ± 0.1 [2Fe-2S]2+ clusters per Grx3 homodimer. This stoichiometry is also in accord with the extinction coefficient at 412 nm (ε412 = 10.0 ± 1.0 mM−1 cm−1, based on Grx3 homodimer concentration) which is at the upper end of the range reported for the dominant band in the 390–430 nm region from a single [2Fe-2S]2+ cluster (42). Both the absorption and CD spectra of the [2Fe-2S]2+ center in the Fra2-Grx3 heterodimer are significantly different to those of the [2Fe-2S]2+ center in the Grx3 homodimer. In particular, the dominant visible absorption bands for [2Fe-2S] Fra2-Grx3 are blue shifted by ~20 nm compared to the equivalent bands in [2Fe-2S] Grx3, and this is reflected in marked changes in the intensity and wavelengths of the visible CD bands. While these changes in excited state electronic structure of the [2Fe-2S]2+ centers are difficult to interpret structurally, they do indicate differences in the cluster ligation and/or the chirality of the cluster environment for the [2Fe-2S]2+ centers in the Fra2-Grx3 heterodimer and Grx3 homodimer.
Figure 3.

Comparison of the UV-visible absorption and CD spectra of [2Fe-2S] Grx3 (gray line) and [2Fe-2S] Fra2-Grx3 (black line). Spectra were recorded under anaerobic conditions in sealed 0.1 cm cuvettes for [2Fe-2S] Grx3 (0.22 mM in homodimer) in 100 mM Tris-HCl buffer with 250 mM NaCl at pH 7.8 and for [2Fe-2S] Fra2-Grx3 complex (0.18 mM in heterodimer) in 50 mM Tris-MES buffer at pH 8.0. ε and Δε values are based on Grx3 homodimer and Fra2-Grx3 heterodimer concentrations.
Resonance Raman and Mössbauer spectra of [2Fe-2S] Fra2-Grx3 suggest partial His ligation
Resonance Raman and Mössbauer spectroscopy were used to confirm the presence and provide a more direct assessment of the ligation and other properties of the [2Fe-2S]2+ centers in the Fra2-Grx3 heterodimer and Grx3 homodimer. The resonance Raman spectra of [2Fe-2S] Grx3 and [2Fe-2S] Fra2-Grx3 in the Fe-S stretching region using 457.9-, 487.9- and 514.5-nm excitation are compared in Figure 4. The spectra obtained for [2Fe-2S] Grx3 are very similar to those recently reported for the monothiol GrxS14 from plant chloroplasts (19). Moreover, the Fe-S stretching frequencies are similar to other structurally characterized [2Fe-2S]2+ centers with complete cysteinyl ligation and can readily be assigned by direct analogy with the published data (44, 45). In contrast, the resonance Raman spectra of [2Fe-2S] Fra2-Grx3 are more characteristic of [2Fe-2S]2+ centers with one or two His ligands in place of Cys ligands based on the published data for structurally characterized Rieske-type proteins (two His ligands at a unique Fe site) (46–49), His-to-Cys variants of Rieske-type proteins (one His ligand) (47) and the structurally characterized outer mitochondrial membrane protein mitoNEET (one His ligand) (50). Partial histidine ligation is evident in the 250–320 cm−1 region by the presence of a two bands, one between 255–275 cm−1 and one between 285–310 cm−1 (46–50), in place of one broad band between 282–302 cm−1 that is attributed primarily to the out-of-phase symmetric FeS4 breathing mode in [2Fe-2S]2+ centers with complete Cys ligation or with one Ser, Asp, or Arg in place of a Cys ligand (39, 44, 45, 51, 52). The available pH-dependence and N-isotope shift data for the Rieske-type and mitoNEET proteins argues against the assignment of the band in the 255–275 cm−1 region to a relatively pure Fe-N(His) stretching mode (46, 47, 49, 50). Rather, Fe-N(His) stretching is distributed over low energy Fe-S stretching modes and internal modes of coordinated cysteine ligands and enhanced via the visible S-to-Fe charge transfer transitions. Hence the observation of low energy vibration modes at 275 and 300 cm−1 in [2Fe-2S] Fra2-Grx3 provides compelling evidence for partial histidyl ligation. The higher energy Fe-S stretching modes in [2Fe-2S] Fra2-Grx3 are generally similar to those in [2Fe-2S] Grx3 except for 5–10 cm−1 upshifts in each of the major bands. This suggests stronger bonding in the Fe2S2 core and stronger Fe-S(Cys) bonds for the [2Fe-2S] center in Fra2-Grx3 compared to Grx3, which is consistent with the observed greater stability of the [2Fe-2S]2+ center in the Fra2-Grx3 complex.
Figure 4.
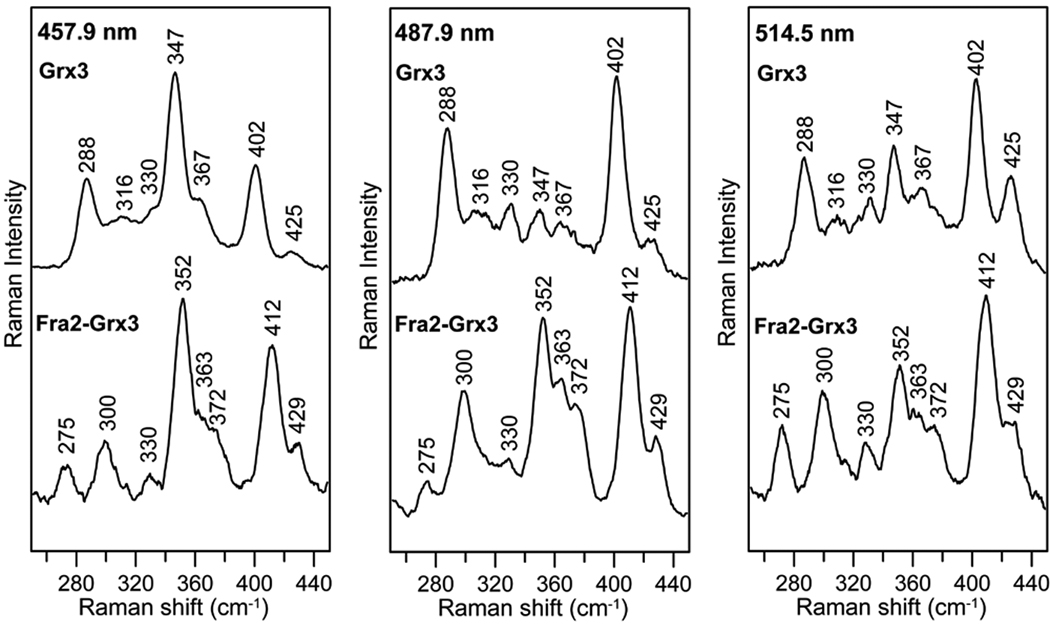
Comparison of the resonance Raman spectra of [2Fe-2S] Grx3 and [2Fe-2S] Fra2-Grx3 with 457.9-, 487.9-, and 514.5-nm laser excitation. Samples were ~ 2 mM in [2Fe-2S] cluster and were in the form of a frozen droplet at 17 K. Each spectrum is the sum of 100 scans, with each scan involving photon counting for 1 s at 0.5 cm−1 increments with 6 cm−1 spectral resolution. Bands due to lattice modes of ice have been subtracted from both spectra.
Mössbauer studies of [2Fe-2S] Fra2-Grx3 and [2Fe-2S] Grx3 facilitated quantitative assessment of the cluster and adventitious Fe composition and provided further support for partial non-cysteinyl cluster ligation in Fra2-Grx3. Mössbauer spectra of [2Fe-2S] Grx3 and [2Fe-2S] Fra2-Grx3 (Figure 5) are indicative of S = 0 [2Fe-2S]2+ centers that result from antiferromagnetic coupling of two high-spin Fe(III) ions and are well simulated as the sum of two unresolved equal-intensity quadrupole doublets with the parameters shown in Table 3. The sharp and symmetric quadrupole doublet of the [2Fe-2S] center in Grx3 results from identical isomer shifts and the same sharp line-widths detected for both Fe sites (δ = 0.29 mm/s and ΔEQ = 0.55 mm/s for site 1 and δ = 0.29 mm/s and ΔEQ = 0.76 mm/s for site 2; line-width = 0.26 mm/s). The results are therefore consistent with tetrahedral, all-cysteinyl ligation at both Fe sites. Analogous Mössbauer spectra were reported for the [2Fe-2S]2+ center in the monothiol GrxS14 from plant chloroplasts (19). In contrast, the [2Fe-2S]2+ center in Fra2-Grx3 exhibits a broader and slightly asymmetric quadrupole doublet that results primarily from an increase in the isomer shift at one Fe site (δ = 0.30 mm/s and ΔEQ = 0.50 mm/s for site 1 and δ = 0.32 mm/s and ΔEQ = 0.82 mm/s for site 2). Provided the oxidation state, spin state, and coordination geometry at an Fe site remain the same, isomer shifts depend on the nature of the coordinating atom in the order δ(S) < δ(N) < δ(O). Hence the increase in the isomer shift at one Fe site in [2Fe-2S] Fra2-Grx3 is consistent with N-ligation. Moreover, since a much larger difference in the isomer shifts of the individual Fe sites is observed for the [2Fe-2S]2+ cluster in Rieske proteins, which have two His ligands at one of the Fe sites (e.g. δ = 0.24 mm/s and ΔEQ = 0.52 mm/s for site 1 and δ = 0.32 mm/s and ΔEQ = 0.91 mm/s for site 2 for the Rieske protein from Thermus thermophilus (53)), we conclude that the Mössbauer data for [2Fe-2S] Fra2-Grx3 is best interpreted in terms of one His ligand.
Figure 5.

Comparison of the Mössbauer spectra of 57Fe-labeled [2Fe-2S] Grx3 and [2Fe-2S] Fra2-Grx3. Samples were ~ 2 mM in [257Fe-2S] clusters. Spectra were recorded at 4.2 K with a magnetic field of 50 mT applied parallel to the γ-radiation. The solid black lines are theoretical simulations of the [2Fe-2S]2+ cluster spectra using two unresolved equal-intensity doublets, with the parameters listed in Table 3. Contributions from a minor mononuclear high-spin Fe(II) species (10% of total 57Fe for [2Fe-2S] Grx3 and 3% of the total 57Fe for [2Fe-2S] Fra2-Grx3) have been removed from the spectra. Parameters used for the Fe(II) species are ΔEQ = 2.96 mm/s and δ = 1.21 mm/s.
Table 3.
Mössbauer parameters for [2Fe-2S] Grx3 and [2Fe-2S] Fra2-Grx3
| Sample | Fe site | ΔEQ (mm/s) | δ (mm/s) | Line width (mm/s) |
|---|---|---|---|---|
| Grx3 | 1 | 0.55 ± 0.03 | 0.29 ± 0.02 | 0.26 |
| 2 | 0.76 ± 0.03 | 0.29 ± 0.02 | 0.26 | |
| Grx3-Fra2 | 1 | 0.50 ± 0.04 | 0.30 ± 0.02 | 0.32 |
| 2 | 0.82 ± 0.04 | 0.32 ± 0.02 | 0.32 |
The Fe-S cluster in Fra2-Grx3 heterodimers is more stable than in Grx3 homodimers
The stability and properties of reduced [2Fe-2S]+ centers in [2Fe-2S] cluster-bound forms of Grx3 and Fra2-Grx3 were assessed by UV-visible absorption and EPR spectroscopy. The [2Fe-2S]2+ cluster in the Grx3 homodimer was not stable to reduction as evidenced by irreversible bleaching of the visible absorption and the absence of a significant EPR signal after anaerobic incubation with a 10-fold excess of sodium dithionite for 10 min. However, cluster degradation appears to proceed via a semi-stable [2Fe-2S]+ cluster as reduction under strictly anaerobic conditions using stoichiometric dithionite and rapid freezing in liquid nitrogen (< 5 s) results in an axial S = 1/2 EPR signal, g‖ = 2.03 and g⊥ = 1.94 with relaxation properties characteristic of a [2Fe-2S]+ cluster, that accounts for ~0.2 spin per [2Fe-2S] cluster (Figure 6). This signal degrades rapidly in samples frozen after longer time periods. In contrast, dithionite-reduction of [2Fe-2S] Fra2-Grx3 yields a stable [2Fe-2S]+ cluster as evidenced by a broad rhombic S = 1/2 EPR signal, g1 = 2.01, g2 = 1.92, and g3 ~1.87, accounting for 1.0 spin per [2Fe-2S] cluster, that is observable without broadening up to at least 70 K1 (Figure 6). Hence the [2Fe-2S]2+ center in [2Fe-2S] Grx3 is oxidatively labile in the presence of O2 and reductively labile under anaerobic conditions in the presence of dithionite, whereas the [2Fe-2S]2+ center in [2Fe-2S] Fra2-Grx3 is both oxidatively and reductively inert under the same conditions.
Figure 6.

Comparison of the X-band EPR spectra of dithionite-reduced [2Fe-2S] Grx3 and [2Fe-2S] Fra2-Grx3. The samples described in Fig. 3 were reduced under anaerobic conditions by addition of stoichiometric sodium dithionite (i.e. a 2-fold excess of reducing equivalents) and frozen immediately in liquid nitrogen. EPR conditions: microwave frequency, 9.60 GHz; modulation frequency, 100 KHz; modulation amplitude, 0.65 mT; microwave power, 20 mW; temperature, 26 K.
ENDOR analysis of [2Fe-2S] Fra2-Grx3 reveals a single His ligand
The gave values and g-value anisotropy of reduced [2Fe-2S]+ centers are largely determined by the ligation and structural distortions at the localized-valence Fe(II) site (54, 55). Hence the observation that the decrease in the gave value for [2Fe-2S]+ Fra2-Grx3 (gave ~ 1.93) compared to [2Fe-2S]+ Grx3 (gave ~ 1.97) is roughly half that observed for Rieske proteins (gave ~ 1.90) which contain 2 His ligands on the Fe2+ site, is consistent with one His residue providing a cluster ligand. Since resolved 14N (I = 1) hyperfine is not apparent in the X-band EPR spectrum of [2Fe-2S]+ Fra2-Grx3, Q-band ENDOR studies were carried out to provide a more definitive assessment of histidyl cluster ligation (Figure 7). The ENDOR data collected at g2 revealed peaks between 6 and 12 MHz that can only be attributed to ν+ peaks from 14N. Data collected at intervals across the entire EPR envelope show that the multiple-peak pattern at g2 collapses to an asymmetric pair of peaks at g1 and g3, indicative of a single quadrupole-split 14N doublet. The peak pattern is consistent with a hyperfine tensor dominated by the isotropic component, with an average coupling aiso = 8 MHz. Such a coupling can only be generated by a direct bonding interaction between the 14N nucleus and an electron-spin carrying [2Fe-2S]+ cluster (56, 57). Hence 14N-ENDOR data confirms the presence of a single histidine ligand for the [2Fe-2S] center in the [2Fe-2S] Fra2-Grx3 complex.
Figure 7.

35 GHz CW ENDOR of dithionite-reduced [2Fe-2S] Fra2-Grx3 complex at 2 K, recorded at g = 1.92. The sample was the same as that described in Figure 3, except that it contained 15% (v/v) ethylene glycol, had a [2Fe-2S] cluster concentration of 0.57 mM, and was reduced anaerobically with a 5-fold excess of reducing equivalents from sodium dithionite immediately prior to freezing.
X-ray absorption analysis of [2Fe-2S] Fra2-Grx3
The ligation of the [2Fe-2S] center in Grx3/4 homodimers and Fra2-Grx3/4 heterodimers was also investigated by x-ray absorption spectroscopy (XAS). XAS data for the [2Fe-2S] Grx3/4 homodimer proved difficult to obtain due to the relative instability of this cluster. After remeasuring the UV-visible absorption spectrum of these samples following x-ray irradiation, it appears that the cluster decomposed during the XAS experiment, possibly due to photoreduction. This result is consistent with the EPR experiment in which chemical reduction with dithionite led to rapid degradation of the [2Fe-2S] cluster in Grx3/4 homodimers. However, we were able to collect XAS data for [2Fe-2S] Fra2-Grx3/4 heterodimers. The x-ray absorption edge shape and energy for [2Fe-2S] Fra2-Grx3 indicate that Fe is in the +3 oxidation state as isolated (Supplementary Figure 1). Table 4 summarizes the best single scattering (fit C) and multiple scattering fits (fit D) to the unfiltered data. Fit C and the Fourier transform (FT) of fit C are shown in Figure 8 along with the raw data. The Fe-Fe vector at 2.67 Å is a prominent feature of the EXAFS spectrum (appearing at R + α of 2.3 Å). If the coordination number (CN) is allowed to refine for this feature, a CN of 0.9 is obtained, a value that matches the Fe stoichiometry and Mössbauer analyses, and, likewise indicates near stoichiometric cluster formation.
Table 4.
EXAFS Fitting Parameters for [2Fe-2S] Fra2-Grx3. Fits are filtered over the main peaks in the FT and are shown from 1–14 Å−1.
| Atom | CNa | R (Å)b | σ2 × 10³c | F′ | |
|---|---|---|---|---|---|
| A | S | 4 | 2.26 | 7.6 | 0.669 |
| Fe | 1 | 2.67 | 3.9 | ||
| B | S | 2 | 2.24 | 3.7 | 0.454 |
| S | 2 | 2.33 | 11.2 | ||
| Fe | 1 | 2.68 | 4.8 | ||
| C | S | 2 | 2.26 | 4.4 | 0.296 |
| N | 2 | 2.06 | 4.6 | ||
| Fe | 1 | 2.67 | 4.6 | ||
| D | S | 3 | 2.26 | 5.2 | 0.350 |
| imidazoled | 1 | 2.05 | 2.1 | ||
| Fe | 1 | 2.68 | 3.4 | ||
CN = coordination number
R = metal-scatterer distance
σ2 = Mean square variation in R
multiple scattering paths of imidazole ring are included
Figure 8.

Left Panel: Unfiltered EXAFS data (black) compared to best 3-shell single-scattering fit (fit C from Table 4 in red). Right panel: Fourier transform of the EXAFS data in black and transformed fit C in red.
EXAFS data report on the average coordination environment of both Fe atoms in the cluster. If one assumes that the Fra2-Grx3/4 complex binds a [2Fe-2S] cluster with 3Cys-1His coordination and 2 bridging S, the average Fe coordination environment would be 3.5 S and 0.5 N. This small contribution from nitrogen is expected to be difficult to refine. Nonetheless, it is clear that a low Z ligand improves the fit relative to an all-sulfur fit (fits A and B). The nearest neighbor interaction requires both a low Z ligand (we used nitrogen) and sulfur to best model the overall data. The optimal CN of the low Z feature is 2 when a single scattering model is employed. This coordination number, however, has a broad minimum. The error in determining absolute CN with EXAFS is typically quoted to be 25%. Indeed, larger errors and erroneous assignments have been reported for mixed S/N coordination environments with EXAFS, resulting from the difficulty in resolving the out of phase N and S scattering (58). Given these known difficulties, the EXAFS first shell fitting analysis is not conclusive in determining the ligand composition here. In the case of the Fra2-Grx3 heterodimer, however, there are additional longer-range peaks visible in the FT (from R + α values between 2.8–3.8 Å) that also suggest the presence of a coordinated histidine. Such peaks are common in proteins with histidine ligands, arising from the multiple scattering pathways from the non-coordinating carbon and nitrogen in the rigid imidazole ring (59). These high R features in the FT of the Fra2-Grx3 heterodimer can be fit using a multiple scattering model of an imidazole ring (fit D in Table 4, Supplementary Figure 2). The optimal CN for the nitrogen shell then refines to a lower value of 1. Again, this minimum is shallow, with nearly equivalent fits resulting when CNs of 0.5 or 1.5 are used. The refined Fe-N distance is 2.06 Å and the average Fe-S distance is 2.26 Å. All of the refined distances are typical of Cys/His-ligated [2Fe-2S] clusters, noting that the bridging sulfur and terminal sulfur distances are not resolved in this experiment (60–63). The EXAFS data are thus consistent with a mixture of Cys and His ligands for the Fra2-Grx3 [2Fe-2S] heterodimeric complex.
The active site Cys and GSH binding pocket in Grx3 are required for Fra2-Grx3 complex formation
The conserved Cys located in the active site of the Grx domain of yeast Grx3 (Cys176) and Grx4 (Cys171) as well as residues in the GSH binding pocket (Trp209, Pro210 in Grx4) are specifically required for Fe-dependent inhibition of Aft1 activity (9) and thus play an important role in in vivo Fe signaling in yeast. Additionally, the Grx domain CGFS active site Cys is a cluster ligand in other monothiol Grx homologues that form [2Fe-2S]-bridged homodimers (19–21). We therefore tested whether mutating these same residues that are critical for in vivo iron signaling influenced formation of the [2Fe-2S] Fra2-Grx3 heterodimeric complex. In addition to Cys176 in the Grx-like domain, Grx3 has two Cys in the Trx-like domain: Cys37 located in the putative Trx active site (33) and Cys108. All three Cys were individually mutated to Ser and co-expressed with Fra2. The protein expression levels and solubility of the Grx3 mutants were similar to WT Grx3 (data not shown); however, the differences in Fe-S binding were visibly clear after collecting the induced cells. Co-expression of Fra2 with Grx3(C37S) or Grx3(C108S) allowed purification of a Fe-S complex that was identical to the WT heterodimeric complex as determined by SDS-PAGE, gel filtration chromatography, UV-visible absorption and CD spectroscopy (data not shown). In contrast, the cells co-expressing Fra2 and Grx3(C176S) lacked the characteristic reddish-brown color of the WT Fra2-Grx3 complex. During the purification procedure, Fra2 and Grx3(C176S) are extracted from the cell pellet using the protocol developed for the WT complex, however the proteins eluted separately during the first chromatography step and no longer co-purified as a reddish-brown complex. In fact, co-expression of Fra2 with Grx3(C176S) proved to be an effective method for purifying apo-Fra2, which is relatively insoluble when expressed separately (see Experimental Procedures). These results suggest that Grx3(C176S) and Fra2 maintain a weak interaction that facilitates extraction of Fra2 from E. coli overexpression cells, but does not allow formation of the stable [2Fe-2S]-bridged heterodimer. This result is thus consistent with our finding that Fra2 and Grx3/4 can interact in the absence of an Fe-S cluster (see above).
To determine whether GSH binding by Grx3 influenced formation of the Fe-S Fra2-Grx3 heterodimeric complex, we created a GSH binding pocket mutant (W214D/P215A) that is analogous to the Grx4 GSH binding mutant reported in earlier in vivo studies (9). Similar to the Grx3(C176S) mutant, co-expression of Grx3(W214D/P215A) with Fra2 did not yield a reddish-brown cell extract (Table 5). The expression levels of both proteins were similar to WT levels; however, Fra2 remained in the cell pellet during extraction, whereas Grx3(W214D/P215A) was found in the supernatant. Since the two proteins did not co-purify as a heterodimeric complex, this result suggests that GSH binding by Grx3 is required for Fra2-Grx3 complex formation.
Table 5.
Grx3 mutants tested for Fe-S binding and complex formation
| Grx3 construct | Fe-S-bound complex with Fra2 |
|---|---|
| WT Grx3 | Yes |
| Grx3(C37S) | Yes |
| Grx3(C108S) | Yes |
| Grx3(C176S) | No |
| Grx3(Δ1–121) | Yes |
| Grx3(Δ122–250) | No |
| Grx3(W214D/P215A) | No |
Previous studies have also demonstrated that the Trx-like domain of Grx3/4 is not critical for mediating iron inhibition of Aft1 activity in vivo (9). To determine whether the Trx-like domain is required for formation of the Fra2-Grx3 Fe-S complex, we co-expressed Fra2 with truncated versions of Grx3 that included either the N-terminal Trx-like domain (amino acids 1–121) or the C-terminal Grx-like domain (amino acids 122–250). Both domains were expressed well and soluble in E. coli; however, the results confirmed that only the Grx-like domain was required for Fe-S complex formation, since removal of the Trx-like domain did not prevent formation of the Fra2-Grx3 Fe-S complex. As expected, the Trx-like domain alone did not form an Fe-S complex with Fra2 (Table 5). Taken together, our Grx3 mutagenesis results demonstrate that the residues required for Fe-dependent inhibition of Aft1 activity in vivo (Grx-like domain with the CGFS active site and GSH binding pocket intact) are the same residues required for formation of the Fra2-Grx3 Fe-S complex. These results thus suggest a direct link between the formation of this Fra2-Grx3/4 Fe-S cluster complex and the in vivo function of Fra2 and Grx3/4 in iron signaling.
DISCUSSION
Previous genetic and biochemical studies have revealed that regulation of yeast iron metabolism is a multi-step pathway involving proteins in the mitochondria, cytosol, and nucleus. Iron inhibition of the transcription factor Aft1 is dependent on a signal from the mitochondrial Fe-S cluster biogenesis machinery that is relayed by the cytosolic proteins Fra1, Fra2, and Grx3/4 (8–11). Under iron replete conditions, the Fra-Grx proteins are proposed to modify Aft1 in an unknown manner that promotes its export from the nucleus, thereby deactivating the iron regulon. Multiple components of this signaling pathway have been identified, yet the specific mechanism for iron sensing and regulation remains a mystery. To uncover the molecular details of this mechanism, the next critical step is to characterize the physical and functional interactions between the proteins in this iron signaling pathway. We have laid the foundation for deciphering this puzzle by characterizing the molecular interactions between three key players, namely Fra2, Grx3, and Grx4. Using a variety of biophysical and biochemical techniques, we demonstrate that Grx3 and Grx4 form [2Fe-2S]-bridged homodimers with complete cysteinyl ligation that is similar to other members of the monothiol Grx family (19–21). However, when Grx3 or Grx4 is co-expressed with Fra2, these proteins form [2Fe-2S]-bridged heterodimers that have spectroscopic characteristics that are distinct from Grx3/Grx4 homodimers. Grx3 mutagenesis studies also demonstrate that Cys176 (located in the conserved Grx-like domain active site) and residues in the GSH binding pocket are required for formation of the Fe-S-bridged heterodimer. Importantly, these same residues are also critical for Fe-dependent inhibition of Aft1 activity in vivo (9), thus providing a strong argument that formation of an Fe-S cluster complex between Fra2 and Grx3/4 is essential for their in vivo role in Fe signaling.
In vivo studies in yeast also demonstrate that Fra2 and Grx3/4 co-immunoprecipitate from both iron-replete and iron-depleted cells, suggesting that the interaction is iron-independent at the cellular level (8). The Fe content of the immunoprecipitated complexes was not assessed in those studies, thus it was not clear if the interaction is iron-independent at the molecular level. Our in vitro suggest that Fe is not essential for the Fra2-Grx3 interaction since removal of the Fe-S cluster does not disrupt the Fra2-Grx3 heterodimer. However, replacement of the key Fe-S cluster binding residue in Grx3 (namely Cys176) does seem to weaken binding to Fra2 since the two proteins no longer maintain an interaction during the purification procedure. Fe-S ligation may therefore modulate the relative binding affinity of Grx3/4 and Fra2. Future studies will address this possibility.
Based on our results, we have developed models for the structures of Grx3/4 homodimers and Fra2-Grx3/4 heterodimers (Figure 9). Grx3 and Grx4 are proposed to form [2Fe-2S]-bridged homodimers with cluster ligands provided by the Grx-like domain active site cysteines and two GSH molecules (Figure 9A). This arrangement of the Fe-S cluster across the dimer interface is likely to be similar to the recently reported crystal structure of the [2Fe-2S]-bridged homodimer for E. coli Grx4, a prokaryotic member of the CGFS-type monothiol Grx family (21). Unlike prokaryotic monothiol Grxs, yeast Grx3 and Grx4 have an additional N-terminal Trx-like domain (Figure 9A). However, our mutagenesis data indicate that this domain is not required for Fe-S binding or heterodimer formation, which is consistent with in vivo studies demonstrating that this domain is dispensable for regulation of Aft1 activity (9).
Figure 9.

Putative models of the [2Fe-2S] Grx3/4 homodimer (A) and the [2Fe-2S] Fra2-Grx3/4 heterodimer (B). G = GSH.
As modeled in Figure 9B, our data demonstrate that the coordination environment of Fra2-Grx3/4 heterodimers is markedly different from Grx3/4 homodimers. Biophysical analyses of the Fra2-Grx3/4 Fe-S complex indicate the presence of both Cys and His residues. Furthermore, the EPR, resonance Raman, and EXAFS data reveal that this complex is more stable than Grx3/4 [2Fe-2S] homodimers since the Fe-S bonds are stronger and the cluster does not readily degrade in reductive or oxidative conditions. In comparison to Grx3/4 homodimers, we propose that Fra2 binding displaces one Grx monomer and one GSH molecule and introduces a His ligand in the cluster, presumably provided by Fra2. Although there are many examples of Rieske-type [2Fe-2S] clusters with 2 His ligands, only one other naturally-occurring protein has been reported to date with 1-His [2Fe-2S] cluster ligation, namely mitoNEET and its homologues (64–66). MitoNEET forms homodimers with each subunit binding a 3-Cys-1-His [2Fe-2S] cluster, although unlike the Fra2-Grx3/4 complex, the clusters are not found at the dimer interface. Since the molecular function of mitoNEET is unknown, the significance of this unusual 1-His cluster ligation in both mitoNEET and Fra2-Grx3/4 is not clear.
For the Fra2-Grx3/4 heterodimer we propose that in addition to the single His ligand, one Cys ligand is provided by the Grx3/4 CGFS active site and one by a GSH molecule held in the GSH binding pocket of Grx3/4 (Figure 9B). The nature of the 4th ligand is unresolved; however, the Mössbauer, EPR, and ENDOR data argue against another His at the Fe(II) site in the dithionite-reduced form of the cluster. It is possible that this 4th ligand is a Cys provided by Fra2, Grx3/4, or GSH. However, replacement of either Cys37 or Cys108 with Ser in Grx3 (i.e, the two Cys outside of the CGFS active site) had no effect on Fe-S binding by the heterodimer. Furthermore, our Fe:S:GSH stoichiometry measurements argue against a second GSH ligand. There have been no published studies identifying specific Fra2 residues required for interaction with Grx3/4 and regulation of Aft1 function. As such, Fra2 mutagenesis studies are currently in progress to identify potential Fe-S ligands and map the binding interface between Fra2 and Grx3/4.
Although the function of Fra2-Grx3/4 heterodimers is unclear, emerging data on CGFS-type monothiol Grxs from a variety of organisms provide evidence that Grx homodimers may function as scaffold and/or delivery proteins for Fe-S cluster assembly and transfer (14, 19–21). For example, the [2Fe-2S] homodimer form of the monothiol GrxS14 from plant chloroplasts was shown to transfer an intact [2Fe-2S] cluster to an apo acceptor protein at a rapid rate (19). Furthermore, the recent crystal structure of a [2Fe-2S]-bridged homodimer for E. coli Grx4 demonstrates that Fe-S binding induces conformational changes in specific loops near the cluster-binding site as compared to the apo, monomer form (21). Rearrangement of these loops may thus facilitate cluster release upon binding of an acceptor or transport protein. At present, there is no direct evidence that the cytosolic yeast Grx3/4 proteins play a role in Fe-S cluster biogenesis. However, both mitochondrial and cytosolic Fe-S assembly is partially impaired in a yeast grx3Δ grx4Δ mutant (9). If yeast Grx3/4 homodimers are Fe-S scaffold or delivery proteins, how would Fra2 binding influence this activity? Fe-S scaffold proteins typically have clusters that are relatively labile, presumably to allow rapid and efficient cluster transfer (67–71). Indeed, we find that the Fe-S cluster in yeast Grx3/4 homodimers is sensitive to both O2 oxidation and reduction with dithionite. However, we find that the Fe-S cluster in Fra2-Grx3/4 is both reductively and oxidatively stable as isolated, suggesting that Fra2 binding abolishes the potential scaffold function of Grx3/4. In other words, Fra2 may act as an adapter protein that converts Grx3/4 from an Fe-S scaffold protein to an cellular Fe sensor.
How does the Fra2-Grx3/4 complex sense the cellular iron status and, in turn, influence Aft1 activity? As mentioned earlier, Aft1 localization changes in response to the cellular iron status. Under iron replete conditions it is primarily localized to the cytosol, whereas under iron-deficient conditions it is concentrated in the nucleus (4). Recent studies suggest that nucleocytoplasmic shuttling of Aft1 involves an Fe-dependent conformational change in Aft1 (12). Under iron replete conditions Aft1 is proposed to form multimers that are exported from the nucleus; however, the specific proteins and mechanisms that promote this intermolecular interaction have not been identified. Since physical interactions between Aft1:Grx3/4 and Fra2:Grx3/4 have been confirmed both in vivo and in vitro ((8–10) and this study), the [2Fe-2S] Fra2-Grx3/4 complex is the most likely candidate for promoting Fe-dependent modification of Aft1. It is possible that [2Fe-2S] Fra2-Grx3/4 forms a stable complex with Aft1 that induces nuclear export of this transcription factor. Another possibility is that [2Fe-2S] Fra2-Grx3/4 transfers a cluster to Aft1. However, previous studies were unable to detect a stable Fe-S cluster in Aft1 (11). Alternatively, the [2Fe-2S] Fra2-Grx3/4 complex may have redox enzymatic activity that modifies Aft1 in a manner that induces Aft1 multimerization. Future studies will address these possibilities.
In conclusion, the results presented in this study establish the ubiquitous monothiol Grx and BolA-like proteins as a novel class of Fe-S cluster binding regulatory complex. The nature of this interaction is unusual since the [2Fe-2S] cluster is bound at the heterodimer interface and includes 1 His and 1 GSH ligand, creating a unique coordination environment that has not been reported for any other Fe-S binding proteins. Both protein families are well conserved in prokaryotes and eukaryotes, and as mentioned earlier, exhibit strong phylogenetic connections (25, 32). As such, it is likely that the Fe-S binding interaction between Fra2 and Grx3/4 is conserved throughout evolution.
Supplementary Material
ACKNOWLEDGEMENTS
We thank Jerry Kaplan for the pET21a-Fra1-His6 and pET21a-Fra2-His6 expression plasmids, Dennis Winge for helpful discussions, and Benjamin Englehart from the C. Outten lab for cloning and initial purification of hGrx2.
ABBREVATIONS
- Grx
glutaredoxin
- Trx
thioredoxin
- GSH
reduced glutathione
- GSSG
oxidized glutathione
- MALDI-TOF
matrix-assisted laser desorption ionization-time of flight
- CD
circular dichroism
- EPR
electron paramagnetic resonance
- ENDOR
electron-nuclear double resonance spectroscopy
- EXAFS
extended X-ray absorption fine structure
- IPTG
isopropyl-β-D-thiogalactoside
- NSLS
National Synchrotron Lightsource
- SSRL
Synchrotron Radiation Laboratory
- CN
coordination number
- FT
Fourier transform
Footnotes
This work was supported by the NIH (ES13780, C.E.O.; GM62524, M.K.J.; GM47295, B.H.H.; HL13531, B.M.H.; P20 RR016461, P.R.-G.) and by the Camille and Henry Dreyfus Foundation (Henry Dreyfus Teacher-Scholar Award to P.R.-G.). Both the National Synchrotron Light Source and the Stanford Synchrotron Radiation Laboratory are national user facilities supported by the U.S. Department of Energy, Office of Basic Energy Sciences. The SSRL Structural Molecular Biology Program is supported by DOE and the NIH-NCRR Biomedical Technology Program.
Trace amounts of the EPR signal associated with reduced [2Fe-2S] Fra2-Grx3 (g = 2.01, 1.92, and 1.87) were also observed in some dithionite-reduced samples of [2Fe-2S] Grx3 and are tentatively attributed to co-purification and co-reconstitution of apo Grx3 and the apo BolA-Grx3 complex where BolA is the E. coli equivalent of Fra2.
SUPPORTING INFORMATION AVAILABLE
Supplementary Table 1 shows the primers used for cloning and mutagenesis. Supplementary Figure 1 and Figure 2 provide additional XAS data. This material is available free of charge via the Internet at http://pubs.ac.org.
REFERENCES
- 1.Stohs SJ, Bagchi D. Oxidative mechanisms in the toxicity of metal ions. Free Radic. Biol. Med. 1995;18:321–336. doi: 10.1016/0891-5849(94)00159-h. [DOI] [PubMed] [Google Scholar]
- 2.Yamaguchi-Iwai Y, Dancis A, Klausner RD. AFT1: a mediator of iron regulated transcriptional control in Saccharomyces cerevisiae. EMBO J. 1995;14:1231–1239. doi: 10.1002/j.1460-2075.1995.tb07106.x. [DOI] [PMC free article] [PubMed] [Google Scholar]
- 3.Yamaguchi-Iwai Y, Stearman R, Dancis A, Klausner RD. Iron-regulated DNA binding by the AFT1 protein controls the iron regulon in yeast. EMBO J. 1996;15:3377–3384. [PMC free article] [PubMed] [Google Scholar]
- 4.Yamaguchi-Iwai Y, Ueta R, Fukunaka A, Sasaki R. Subcellular localization of Aft1 transcription factor responds to iron status in Saccharomyces cerevisiae. J. Biol. Chem. 2002;277:18914–18918. doi: 10.1074/jbc.M200949200. [DOI] [PubMed] [Google Scholar]
- 5.Casas C, Aldea M, Espinet C, Gallego C, Gil R, Herrero E. The AFT1 transcriptional factor is differentially required for expression of high-affinity iron uptake genes in Saccharomyces cerevisiae. Yeast. 1997;13:621–637. doi: 10.1002/(SICI)1097-0061(19970615)13:7<621::AID-YEA121>3.0.CO;2-U. [DOI] [PubMed] [Google Scholar]
- 6.Foury F, Talibi D. Mitochondrial control of iron homeostasis. A genome wide analysis of gene expression in a yeast frataxin-deficient strain. J. Biol. Chem. 2001;276:7762–7768. doi: 10.1074/jbc.M005804200. [DOI] [PubMed] [Google Scholar]
- 7.Protchenko O, Ferea T, Rashford J, Tiedeman J, Brown PO, Botstein D, Philpott CC. Three cell wall mannoproteins facilitate the uptake of iron in Saccharomyces cerevisiae. J. Biol. Chem. 2001;276:49244–49250. doi: 10.1074/jbc.M109220200. [DOI] [PubMed] [Google Scholar]
- 8.Kumanovics A, Chen OS, Li L, Bagley D, Adkins EM, Lin H, Dingra NN, Outten CE, Keller G, Winge D, Ward DM, Kaplan J. Identification of FRA1 and FRA2 as genes involved in regulating the yeast iron regulon in response to decreased mitochondrial iron-sulfur cluster synthesis. J. Biol. Chem. 2008;283:10276–10286. doi: 10.1074/jbc.M801160200. [DOI] [PMC free article] [PubMed] [Google Scholar]
- 9.Ojeda L, Keller G, Muhlenhoff U, Rutherford JC, Lill R, Winge DR. Role of glutaredoxin-3 and glutaredoxin-4 in the iron regulation of the Aft1 transcriptional activator in Saccharomyces cerevisiae. J. Biol. Chem. 2006;281:17661–17669. doi: 10.1074/jbc.M602165200. [DOI] [PubMed] [Google Scholar]
- 10.Pujol-Carrion N, Belli G, Herrero E, Nogues A, de la Torre-Ruiz MA. Glutaredoxins Grx3 and Grx4 regulate nuclear localisation of Aft1 and the oxidative stress response in Saccharomyces cerevisiae. J. Cell Sci. 2006;119:4554–4564. doi: 10.1242/jcs.03229. [DOI] [PubMed] [Google Scholar]
- 11.Rutherford JC, Ojeda L, Balk J, Muhlenhoff U, Lill R, Winge DR. Activation of the iron regulon by the yeast Aft1/Aft2 transcription factors depends on mitochondrial but not cytosolic iron-sulfur protein biogenesis. J. Biol. Chem. 2005;280:10135–10140. doi: 10.1074/jbc.M413731200. [DOI] [PubMed] [Google Scholar]
- 12.Ueta R, Fujiwara N, Iwai K, Yamaguchi-Iwai Y. Mechanism underlying the iron-dependent nuclear export of the iron-responsive transcription factor Aft1p in Saccharomyces cerevisiae. Mol. Biol. Cell. 2007;18:2980–2990. doi: 10.1091/mbc.E06-11-1054. [DOI] [PMC free article] [PubMed] [Google Scholar]
- 13.Herrero E, de la Torre-Ruiz MA. Monothiol glutaredoxins: a common domain for multiple functions. Cell. Mol. Life Sci. 2007;64:1518–1530. doi: 10.1007/s00018-007-6554-8. [DOI] [PMC free article] [PubMed] [Google Scholar]
- 14.Muhlenhoff U, Gerber J, Richhardt N, Lill R. Components involved in assembly and dislocation of iron-sulfur clusters on the scaffold protein Isu1p. EMBO J. 2003;22:4815–4825. doi: 10.1093/emboj/cdg446. [DOI] [PMC free article] [PubMed] [Google Scholar]
- 15.Rodriguez-Manzaneque MT, Tamarit J, Belli G, Ros J, Herrero E. Grx5 is a mitochondrial glutaredoxin required for the activity of iron/sulfur enzymes. Mol. Biol. Cell. 2002;13:1109–1121. doi: 10.1091/mbc.01-10-0517. [DOI] [PMC free article] [PubMed] [Google Scholar]
- 16.Witte S, Villalba M, Bi K, Liu Y, Isakov N, Altman A. Inhibition of the c-Jun N-terminal kinase/AP-1 and NF-kappaB pathways by PICOT, a novel protein kinase C-interacting protein with a thioredoxin homology domain. J. Biol. Chem. 2000;275:1902–1909. doi: 10.1074/jbc.275.3.1902. [DOI] [PubMed] [Google Scholar]
- 17.Jeong D, Kim JM, Cha H, Oh JG, Park J, Yun SH, Ju ES, Jeon ES, Hajjar RJ, Park WJ. PICOT attenuates cardiac hypertrophy by disrupting calcineurin-NFAT signaling. Circ. Res. 2008;102:711–719. doi: 10.1161/CIRCRESAHA.107.165985. [DOI] [PubMed] [Google Scholar]
- 18.Lillig CH, Berndt C, Holmgren A. Glutaredoxin systems. Biochim. Biophys. Acta. 2008;1780:1304–1317. doi: 10.1016/j.bbagen.2008.06.003. [DOI] [PubMed] [Google Scholar]
- 19.Bandyopadhyay S, Gama F, Molina-Navarro MM, Gualberto JM, Claxton R, Naik SG, Huynh BH, Herrero E, Jacquot JP, Johnson MK, Rouhier N. Chloroplast monothiol glutaredoxins as scaffold proteins for the assembly and delivery of [2Fe-2S] clusters. EMBO J. 2008;27:1122–1133. doi: 10.1038/emboj.2008.50. [DOI] [PMC free article] [PubMed] [Google Scholar]
- 20.Picciocchi A, Saguez C, Boussac A, Cassier-Chauvat C, Chauvat F. CGFS-type monothiol glutaredoxins from the cyanobacterium Synechocystis PCC6803 and other evolutionary distant model organisms possess a glutathione-ligated [2Fe-2S] cluster. Biochemistry. 2007;46:15018–15026. doi: 10.1021/bi7013272. [DOI] [PubMed] [Google Scholar]
- 21.Iwema T, Picciocchi A, Traore DA, Ferrer JL, Chauvat F, Jacquamet L. Structural basis for delivery of the intact [Fe2S2] cluster by monothiol glutaredoxin. Biochemistry. 2009;48:6041–6043. doi: 10.1021/bi900440m. [DOI] [PubMed] [Google Scholar]
- 22.Franco R, Schoneveld OJ, Pappa A, Panayiotidis MI. The central role of glutathione in the pathophysiology of human diseases. Arch. Physiol. Biochem. 2007;113:234–258. doi: 10.1080/13813450701661198. [DOI] [PubMed] [Google Scholar]
- 23.Johansson C, Kavanagh KL, Gileadi O, Oppermann U. Reversible sequestration of active site cysteines in a 2Fe-2S-bridged dimer provides a mechanism for glutaredoxin 2 regulation in human mitochondria. J. Biol. Chem. 2007;282:3077–3082. doi: 10.1074/jbc.M608179200. [DOI] [PubMed] [Google Scholar]
- 24.Rouhier N, Unno H, Bandyopadhyay S, Masip L, Kim SK, Hirasawa M, Gualberto JM, Lattard V, Kusunoki M, Knaff DB, Georgiou G, Hase T, Johnson MK, Jacquot JP. Functional, structural, and spectroscopic characterization of a glutathione-ligated [2Fe-2S] cluster in poplar glutaredoxin C1. Proc. Natl. Acad. Sci. USA. 2007;104:7379–7384. doi: 10.1073/pnas.0702268104. [DOI] [PMC free article] [PubMed] [Google Scholar]
- 25.Huynen MA, Spronk CA, Gabaldon T, Snel B. Combining data from genomes, Y2H and 3D structure indicates that BolA is a reductase interacting with a glutaredoxin. FEBS Lett. 2005;579:591–596. doi: 10.1016/j.febslet.2004.11.111. [DOI] [PubMed] [Google Scholar]
- 26.Aldea M, Hernandez-Chico C, de la Campa AG, Kushner SR, Vicente M. Identification, cloning, and expression of bolA, an ftsZ-dependent morphogene of Escherichia coli. J. Bacteriol. 1988;170:5169–5176. doi: 10.1128/jb.170.11.5169-5176.1988. [DOI] [PMC free article] [PubMed] [Google Scholar]
- 27.Giot L, Bader JS, Brouwer C, Chaudhuri A, Kuang B, Li Y, Hao YL, Ooi CE, Godwin B, Vitols E, Vijayadamodar G, Pochart P, Machineni H, Welsh M, Kong Y, Zerhusen B, Malcolm R, Varrone Z, Collis A, Minto M, Burgess S, McDaniel L, Stimpson E, Spriggs F, Williams J, Neurath K, Ioime N, Agee M, Voss E, Furtak K, Renzulli R, Aanensen N, Carrolla S, Bickelhaupt E, Lazovatsky Y, DaSilva A, Zhong J, Stanyon CA, Finley RL, Jr, White KP, Braverman M, Jarvie T, Gold S, Leach M, Knight J, Shimkets RA, McKenna MP, Chant J, Rothberg JM. A protein interaction map of Drosophila melanogaster. Science. 2003;302:1727–1736. doi: 10.1126/science.1090289. [DOI] [PubMed] [Google Scholar]
- 28.Ito T, Tashiro K, Muta S, Ozawa R, Chiba T, Nishizawa M, Yamamoto K, Kuhara S, Sakaki Y. Toward a protein-protein interaction map of the budding yeast: A comprehensive system to examine two-hybrid interactions in all possible combinations between the yeast proteins. Proc. Natl. Acad. Sci. USA. 2000;97:1143–1147. doi: 10.1073/pnas.97.3.1143. [DOI] [PMC free article] [PubMed] [Google Scholar]
- 29.Ho Y, Gruhler A, Heilbut A, Bader GD, Moore L, Adams SL, Millar A, Taylor P, Bennett K, Boutilier K, Yang L, Wolting C, Donaldson I, Schandorff S, Shewnarane J, Vo M, Taggart J, Goudreault M, Muskat B, Alfarano C, Dewar D, Lin Z, Michalickova K, Willems AR, Sassi H, Nielsen PA, Rasmussen KJ, Andersen JR, Johansen LE, Hansen LH, Jespersen H, Podtelejnikov A, Nielsen E, Crawford J, Poulsen V, Sorensen BD, Matthiesen J, Hendrickson RC, Gleeson F, Pawson T, Moran MF, Durocher D, Mann M, Hogue CW, Figeys D, Tyers M. Systematic identification of protein complexes in Saccharomyces cerevisiae by mass spectrometry. Nature. 2002;415:180–183. doi: 10.1038/415180a. [DOI] [PubMed] [Google Scholar]
- 30.Krogan NJ, Cagney G, Yu H, Zhong G, Guo X, Ignatchenko A, Li J, Pu S, Datta N, Tikuisis AP, Punna T, Peregrin-Alvarez JM, Shales M, Zhang X, Davey M, Robinson MD, Paccanaro A, Bray JE, Sheung A, Beattie B, Richards DP, Canadien V, Lalev A, Mena F, Wong P, Starostine A, Canete MM, Vlasblom J, Wu S, Orsi C, Collins SR, Chandran S, Haw R, Rilstone JJ, Gandi K, Thompson NJ, Musso G, St Onge P, Ghanny S, Lam MH, Butland G, Altaf-Ul AM, Kanaya S, Shilatifard A, O'Shea E, Weissman JS, Ingles CJ, Hughes TR, Parkinson J, Gerstein M, Wodak SJ, Emili A, Greenblatt JF. Global landscape of protein complexes in the yeast Saccharomyces cerevisiae. Nature. 2006;440:637–643. doi: 10.1038/nature04670. [DOI] [PubMed] [Google Scholar]
- 31.Butland G, Peregrin-Alvarez JM, Li J, Yang W, Yang X, Canadien V, Starostine A, Richards D, Beattie B, Krogan N, Davey M, Parkinson J, Greenblatt J, Emili A. Interaction network containing conserved and essential protein complexes in Escherichia coli. Nature. 2005;433:531–537. doi: 10.1038/nature03239. [DOI] [PubMed] [Google Scholar]
- 32.Couturier J, Jacquot JP, Rouhier N. Evolution and diversity of glutaredoxins in photosynthetic organisms. Cell. Mol. Life Sci. 2009 doi: 10.1007/s00018-009-0054-y. [DOI] [PMC free article] [PubMed] [Google Scholar]
- 33.Gibson LM, Dingra NN, Outten CE, Lebioda L. Structure of the thioredoxin-like domain of yeast glutaredoxin 3. Acta Crystallogr. D Biol. Crystallogr. 2008;64:927–932. doi: 10.1107/S0907444908021641. [DOI] [PMC free article] [PubMed] [Google Scholar]
- 34.Lillig CH, Berndt C, Vergnolle O, Lonn ME, Hudemann C, Bill E, Holmgren A. Characterization of human glutaredoxin 2 as iron-sulfur protein: a possible role as redox sensor. Proc. Natl. Acad. Sci. USA. 2005;102:8168–8173. doi: 10.1073/pnas.0500735102. [DOI] [PMC free article] [PubMed] [Google Scholar]
- 35.Riemer J, Hoepken HH, Czerwinska H, Robinson SR, Dringen R. Colorimetric ferrozine-based assay for the quantitation of iron in cultured cells. Anal. Biochem. 2004;331:370–375. doi: 10.1016/j.ab.2004.03.049. [DOI] [PubMed] [Google Scholar]
- 36.Beinert H. Semi-micro methods for analysis of labile sulfide and of labile sulfide plus sulfane sulfur in unusually stable iron-sulfur proteins. Anal. Biochem. 1983;131:373–378. doi: 10.1016/0003-2697(83)90186-0. [DOI] [PubMed] [Google Scholar]
- 37.Broderick JB, Henshaw TF, Cheek J, Wojtuszewski K, Smith SR, Trojan MR, McGhan RM, Kopf A, Kibbey M, Broderick WE. Pyruvate formate-lyase-activating enzyme: strictly anaerobic isolation yields active enzyme containing a [3Fe-4S](+) cluster. Biochem. Biophys. Res. Commun. 2000;269:451–456. doi: 10.1006/bbrc.2000.2313. [DOI] [PubMed] [Google Scholar]
- 38.Outten CE, Culotta VC. Alternative start sites in the Saccharomyces cerevisiae GLR1 gene are responsible for mitochondrial and cytosolic isoforms of glutathione reductase. J. Biol. Chem. 2004;279:7785–7791. doi: 10.1074/jbc.M312421200. [DOI] [PMC free article] [PubMed] [Google Scholar]
- 39.Cosper MM, Jameson GN, Hernandez HL, Krebs C, Huynh BH, Johnson MK. Characterization of the cofactor composition of Escherichia coli biotin synthase. Biochemistry. 2004;43:2007–2021. doi: 10.1021/bi0356653. [DOI] [PubMed] [Google Scholar]
- 40.Werst MM, Davoust CE, Hoffman BM. Ligand spin-densities in blue copper proteins by Q-Band H-1 and N-14 ENDOR spectroscopy. J. Amer. Chem. Soc. 1991;113:1533–1538. [Google Scholar]
- 41.Ravi N, Bollinger JM, Huynh BH, Edmondson DE, Stubbe J. Mechanism of Assembly of the Tyrosyl Radical-Diiron(Iii) Cofactor of Escherichia-Coli Ribonucleotide Reductase.1. Mossbauer Characterization of the Diferric Radical Precursor. J. Amer. Chem. Soc. 1994;116:8007–8014. [Google Scholar]
- 42.Dailey HA, Finnegan MG, Johnson MK. Human ferrochelatase is an iron-sulfur protein. Biochemistry. 1994;33:403–407. doi: 10.1021/bi00168a003. [DOI] [PubMed] [Google Scholar]
- 43.Stephens PJ, Thomson AJ, Dunn JBR, Keiderling TA, Rawlings J, Rao KK, Hall DO. Circular-dichroism and magnetic circular-dichroism of iron-sulfur proteins. Biochemistry. 1978;17:4770–4778. doi: 10.1021/bi00615a026. [DOI] [PubMed] [Google Scholar]
- 44.Fu W, Drozdzewski PM, Davies MD, Sligar SG, Johnson MK. Resonance Raman and magnetic circular dichroism studies of reduced [2Fe-2S] proteins. J. Biol. Chem. 1992;267:15502–15510. [PubMed] [Google Scholar]
- 45.Han S, Czernuszewicz RS, Kimura T, Adams MWW, Spiro TG. Fe2S2 protein resonance Raman-spectra revisited - Structural variations among adrenodoxin, ferredoxin, and red paramagnetic protein. J. Amer. Chem. Soc. 1989;111:3505–3511. [Google Scholar]
- 46.Iwasaki T, Kounosu A, Kolling DRJ, Crofts AR, Dikanov SA, Jin A, Imai T, Urushiyama A. Characterization of the pH-dependent resonance Raman transitions of archaeal and bacterial Rieske [2Fe-2S] proteins. J. Amer. Chem. Soc. 2004;126:4788–4789. doi: 10.1021/ja031976p. [DOI] [PubMed] [Google Scholar]
- 47.Kounosu A, Li ZR, Cosper NJ, Shokes JE, Scott RA, Imai T, Urushiyama A, Iwasaki T. Engineering a three-cysteine, one-histidine ligand environment into a new hyperthermophilic archaeal Rieske-type [2Fe-2S] ferredoxin from Sulfolobus solfataricus. Journal of Biological Chemistry. 2004;279:12519–12528. doi: 10.1074/jbc.M305923200. [DOI] [PubMed] [Google Scholar]
- 48.Kuila D, Schoonover JR, Dyer RB, Batie CJ, Ballou DP, Fee JA, Woodruff WH. Resonance Raman studies of Rieske-type proteins. Biochim. Biophys. Acta. 1992;1140:175–183. doi: 10.1016/0005-2728(92)90007-o. [DOI] [PubMed] [Google Scholar]
- 49.Rotsaert FAJ, Pikus JD, Fox BG, Markley JL, Sanders-Loehr J. Nisotope effects on the Raman spectra of Fe2S2 ferredoxin and Rieske ferredoxin: evidence for structural rigidity of metal sites. J. Biol. Inorg. Chem. 2003;8:318–326. doi: 10.1007/s00775-002-0417-4. [DOI] [PubMed] [Google Scholar]
- 50.Tirrell TF, Paddock ML, Conlan AR, Smoll EJ, Jr, Nechushtai R, Jennings PA, Kim JE. Resonance Raman studies of the (His)(Cys)(3) 2Fe-2S cluster of MitoNEET: comparison to the (Cys)(4) mutant and implications of the effects of pH on the labile metal center. Biochemistry. 2009;48:4747–4752. doi: 10.1021/bi900028r. [DOI] [PMC free article] [PubMed] [Google Scholar]
- 51.Meyer J, Fujinaga J, Gaillard J, Lutz M. Mutated forms of the [2Fe-2S] ferredoxin from Clostridium pasteurianum with noncysteinyl ligands to the iron-sulfur cluster. Biochemistry. 1994;33:13642–13650. doi: 10.1021/bi00250a014. [DOI] [PubMed] [Google Scholar]
- 52.Moulis JM, Davasse V, Golinelli MP, Meyer J, Quinkal I. The coordination sphere of iron-sulfur clusters: Lessons from site-directed mutagenesis experiments. J. Biol. Inorg. Chem. 1996;1:2–14. [Google Scholar]
- 53.Fee JA, Findling KL, Yoshida T, Hille R, Tarr GE, Hearshen DO, Dunham WR, Day EP, Kent TA, Munck E. Purification and characterization of the Rieske iron-sulfur protein from Thermus thermophilus. Evidence for a [2Fe-2S] cluster having non-cysteine ligands. J. Biol. Chem. 1984;259:124–133. [PubMed] [Google Scholar]
- 54.Bertrand P, Guigliarelli B, Gayda JP, Beardwood P, Gibson JF. A ligand-field model to describe a new class of 2Fe-2S clusters in proteins and their synthetic analogs. Biochim. Biophys. Acta. 1985;831:261–266. [Google Scholar]
- 55.Guigliarelli B, Bertrand P. Application of EPR spectroscopy to the structural and functional study of iron-sulfur proteins. Adv. Inorg. Chem. 1999;47:421–497. [Google Scholar]
- 56.Gurbiel RJ, Batie CJ, Sivaraja M, True AE, Fee JA, Hoffman BM, Ballou DP. Electron-nuclear double resonance spectroscopy of 15N-enriched phthalate dioxygenase from Pseudomonas cepacia proves that two histidines are coordinated to the [2Fe-2S] Rieske-type clusters. Biochemistry. 1989;28:4861–4871. doi: 10.1021/bi00437a051. [DOI] [PubMed] [Google Scholar]
- 57.Gurbiel RJ, Doan PE, Gassner GT, Macke TJ, Case DA, Ohnishi T, Fee JA, Ballou DP, Hoffman BM. Active site structure of Rieske-type proteins: electron nuclear double resonance studies of isotopically labeled phthalate dioxygenase from Pseudomonas cepacia and Rieske protein from Rhodobacter capsulatus and molecular modeling studies of a Rieske center. Biochemistry. 1996;35:7834–7845. doi: 10.1021/bi960380u. [DOI] [PubMed] [Google Scholar]
- 58.Clark-Baldwin K, Tierney DL, Govindaswamy N, Gruff ES, Kim C, Berg J, Koch SA, Penner-Hahn JE. The limitations of X-ray absorption spectroscopy for determining the structure of zinc sites in proteins. When is a tetrathiolate not a tetrathiolate? J. Amer. Chem. Soc. 1998;120:8401–8409. [Google Scholar]
- 59.Stemmler TL, Sossong TM, Jr, Goldstein JI, Ash DE, Elgren TE, Kurtz DM, Jr, Penner-Hahn JE. EXAFS comparison of the dimanganese core structures of manganese catalase, arginase, and manganese-substituted ribonucleotide reductase and hemerythrin. Biochemistry. 1997;36:9847–9858. doi: 10.1021/bi9702795. [DOI] [PubMed] [Google Scholar]
- 60.Hunsicker-Wang LM, Heine A, Chen Y, Luna EP, Todaro T, Zhang YM, Williams PA, McRee DE, Hirst J, Stout CD, Fee JA. High-resolution structure of the soluble, respiratory-type Rieske protein from Thermus thermophilus: analysis and comparison. Biochemistry. 2003;42:7303–7317. doi: 10.1021/bi0342719. [DOI] [PubMed] [Google Scholar]
- 61.Kolling DJ, Brunzelle JS, Lhee S, Crofts AR, Nair SK. Atomic resolution structures of rieske iron-sulfur protein: role of hydrogen bonds in tuning the redox potential of iron-sulfur clusters. Structure. 2007;15:29–38. doi: 10.1016/j.str.2006.11.012. [DOI] [PMC free article] [PubMed] [Google Scholar]
- 62.Cosper NJ, Eby DM, Kounosu A, Kurosawa N, Neidle EL, Kurtz DM, Jr, Iwasaki T, Scott RA. Redox-dependent structural changes in archaeal and bacterial Rieske-type [2Fe-2S] clusters. Protein Sci. 2002;11:2969–2973. doi: 10.1110/ps.0222402. [DOI] [PMC free article] [PubMed] [Google Scholar]
- 63.Tsang HT, Batie CJ, Ballou DP, Penner-Hahn JE. X-ray absorption spectroscopy of the [2Fe-2S] Rieske cluster in Pseudomonas cepacia phthalate dioxygenase. Determination of core dimensions and iron ligation. Biochemistry. 1989;28:7233–7240. doi: 10.1021/bi00444a015. [DOI] [PubMed] [Google Scholar]
- 64.Hou X, Liu R, Ross S, Smart EJ, Zhu H, Gong W. Crystallographic studies of human MitoNEET. J. Biol. Chem. 2007;282:33242–33246. doi: 10.1074/jbc.C700172200. [DOI] [PubMed] [Google Scholar]
- 65.Lin J, Zhou T, Ye K, Wang J. Crystal structure of human mitoNEET reveals distinct groups of iron sulfur proteins. Proc. Natl. Acad. Sci. USA. 2007;104:14640–14645. doi: 10.1073/pnas.0702426104. [DOI] [PMC free article] [PubMed] [Google Scholar]
- 66.Paddock ML, Wiley SE, Axelrod HL, Cohen AE, Roy M, Abresch EC, Capraro D, Murphy AN, Nechushtai R, Dixon JE, Jennings PA. MitoNEET is a uniquely folded 2Fe 2S outer mitochondrial membrane protein stabilized by pioglitazone. Proc. Natl. Acad. Sci. USA. 2007;104:14342–14347. doi: 10.1073/pnas.0707189104. [DOI] [PMC free article] [PubMed] [Google Scholar]
- 67.Agar JN, Krebs C, Frazzon J, Huynh BH, Dean DR, Johnson MK. IscU as a scaffold for iron-sulfur cluster biosynthesis: sequential assembly of [2Fe-2S] and [4Fe-4S] clusters in IscU. Biochemistry. 2000;39:7856–7862. doi: 10.1021/bi000931n. [DOI] [PubMed] [Google Scholar]
- 68.Netz DJ, Pierik AJ, Stumpfig M, Muhlenhoff U, Lill R. The Cfd1-Nbp35 complex acts as a scaffold for iron-sulfur protein assembly in the yeast cytosol. Nat. Chem. Biol. 2007;3:278–286. doi: 10.1038/nchembio872. [DOI] [PubMed] [Google Scholar]
- 69.Yuvaniyama P, Agar JN, Cash VL, Johnson MK, Dean DR. NifS-directed assembly of a transient [2Fe-2S] cluster within the NifU protein. Proc. Natl. Acad. Sci. USA. 2000;97:599–604. doi: 10.1073/pnas.97.2.599. [DOI] [PMC free article] [PubMed] [Google Scholar]
- 70.Bonomi F, Iametti S, Ta D, Vickery LE. Multiple turnover transfer of [2Fe2S] clusters by the iron-sulfur cluster assembly scaffold proteins IscU and IscA. J. Biol. Chem. 2005;280:29513–29518. doi: 10.1074/jbc.M504344200. [DOI] [PubMed] [Google Scholar]
- 71.Raulfs EC, O'Carroll IP, Dos Santos PC, Unciuleac MC, Dean DR. In vivo iron-sulfur cluster formation. Proc. Natl. Acad. Sci. USA. 2008;105:8591–8596. doi: 10.1073/pnas.0803173105. [DOI] [PMC free article] [PubMed] [Google Scholar]
Associated Data
This section collects any data citations, data availability statements, or supplementary materials included in this article.