Abstract
Clinically available thrombolysis techniques are limited by either slow reperfusion (drugs) or invasiveness (catheters), and carry significant risks of bleeding. In this study, the feasibility of using histotripsy as an efficient and non-invasive thrombolysis technique was investigated. Histotripsy fractionates soft tissue through controlled cavitation using focused, short, high-intensity ultrasound pulses. In-vitro blood clots formed from fresh canine blood were treated by histotripsy. The treatment was applied using a focused 1-MHz transducer, with 5-cycle pulses at a pulse repetition rate of 1 kHz. Acoustic pressures varying from 2 – 12 MPa peak negative pressure were tested. Our results show that histotripsy can perform effective thrombolysis with ultrasound energy alone. Histotripsy thrombolysis only occurred at peak negative pressure ≥6 MPa when initiation of a cavitating bubble cloud was detected using acoustic backscatter monitoring. Blood clots weighing 330 mg were completely broken down by histotripsy in 1.5 – 5 minutes. The clot was fractionated to debris with >96% weight smaller than 5 μm diameter. Histotripsy thrombolysis treatment remained effective under a fast, pulsating flow (a circulatory model) as well as in static saline. Additionally, we observed that fluid flow generated by a cavitation cloud can attract, trap, and further break down clot fragments. This phenomenon may provide a non-invasive method to filter and eliminate hazardous emboli during thrombolysis.
Keywords: Thrombolysis, Histotripsy, Cavitation, Ultrasound Therapy, Pulsed Ultrasound
INTRODUCTION
Thrombosis is the formation of a blood clot in vasculature and is the primary cause of many vascular diseases, including myocardial infarction (MI), pulmonary embolism (PE) and deep vein thrombosis (DVT). Current clinical methods to treat thrombosis include anticoagulant and thrombolytic drugs (Bates and Ginsburg 2004; Kyrle and Eichinger 2005; Moll 2008), catheter-based endovascular techniques (Gutt et al 2005; Kim et al. 2006), or a combination of the two where a catheter is used to locally deliver the thrombolytic agent to the site of occlusion (Alesh 2007; Bjarnason 1997). Thrombolytic drugs such as recombinant tissue plasminogen activator (rt-PA) administered without a catheter require long treatment times (several hours), are non-site-specific, and carry a substantial risk of major bleeding that can be fatal in a small number of cases. The current catheter-based thrombolysis procedures include local delivery of thrombolytic agents by catheter, vein segment isolation and thrombolysis, and mechanical disruption and aspiration of the clot (rheolytic thrombectomy) (Mewissen 1999; O'Sullivan 2007). Catheter-based devices have the advantage of localizing treatment to the clot, but are invasive and also carry an increased risk of hemorrhage, damage to the vessel wall, and infection (Sharafuddin et al. 2003). Surgical and endovascular procedures also increase the cost of treatment due to use of expensive equipment, and need for hospitalization.
Ultrasound has been known for several decades to promote clot breakdown, as both a stand-alone procedure and used in conjunction with thrombolytic drugs (Atar and Rosenshein 2004; Francis and Suchkova 2001) or contrast agents (Daniels et al. 1995; Deng et al 1996). Many groups have reported an increase in thrombolytic efficiency of rt-PA and streptokinase when low-intensity, non-focused ultrasound was applied (Nedelmann et al. 2002; Siegel et al 2001). A reduction in average lysis time from 3 hours to 30 minutes has been achieved for combined ultrasound + rt-PA therapy compared with just rt-PA alone (Siegel et al. 2001). However, these methods still carry the risks of major bleeding associated with thrombolytic drugs. Alternatively, ultrasound has also been used by itself or in conjunction with catheters to locally administer thrombolysis. While catheter-based methods can quickly disrupt the occlusion, they also have the drawbacks associated with invasive procedures and may cause damage to the surrounding vessel. In-vitro studies (Rosenschein et al. 2000; Westermark et al. 1999) have shown high-intensity focused ultrasound operated in a pulsed mode induces rapid clot breakdown without thrombolytic drugs. Both groups found that pulsing a focused transducer was more effective than either continuous-wave high-intensity ultrasound or lithotripsy shockwaves. The increased efficacy was attributed to activity of cavitation induced by the pulsing regime. The underlying mechanisms of cavitation damage, however, remain poorly understood.
In this study we investigated a new non-invasive thrombolysis method, histotripsy, which uses pulsed ultrasound alone. This technology depends on control of cavitation to mechanically fractionate cells and tissues using focused ultrasound pulses (Cooper et al. 2006; Hall et al. 2007; Parsons et al. 2006a; Roberts et al. 2006; Xu et al. 2004,2005,2006a,2007). This technique can be viewed as soft tissue lithotripsy, giving rise to the name “histotripsy”. We have found that cavitation nucleation can be controlled to create targeted tissue fractionation using appropriate ultrasound pulse sequences assisted by cavitation-based feedback monitoring (Hall et al. 2007; Xu et al. 2005). Histotripsy pulses include successive, very short (<50 cycles), high-pressure (>6 MPa) nonlinear pulses delivered at low duty cycles (0.1-5%). Cavitation can be monitored using acoustic feedback such as ultrasound backscatter.
Our previous studies show that histotripsy can fractionate soft tissue to acellular debris within a few minutes (Xu et al. 2007). Histotripsy can be visualized and guided using real-time ultrasound imaging. The bubble cloud generated by histotripsy is visible as a highly-dynamic echogenic region on a B-Mode image, allowing precise targeting prior to treatment. The fractionated tissue shows a reduction in echogenicity compared with intact tissue, which can be used to evaluate progression of treatment (Hall et al. 2007). In vascular applications, Doppler ultrasound can also provide feedback and confirm restoration of flow after thrombolysis. The abilities to efficiently fractionate tissue and monitor therapy using image-guided real-time feedback are primary motivations to explore histotripsy as a potential non-invasive thrombolysis method.
In this study, we evaluated the preliminary feasibility of the histotripsy thrombolysis technique in a vessel model with static saline. The rate of thrombolysis vs. pressure level was measured to assess efficiency. Cavitating bubble clouds were monitored using acoustic backscatter and correlated to the thrombolysis rate. Since circulatory flow in-vivo may have an effect on cavitation activity, we also performed the treatment in a fast, pulsatile flow model. As histotripsy mechanically breaks down clots to debris particles, there is a concern that the debris may occlude blood vessels causing hazardous emboli. To evaluate the risk of embolism, we measured sizes of clot debris generated by the procedure. In addition, we tested the use of a secondary cavitating bubble cloud as a non-invasive emboli filter by capturing and further fractionating larger clot fragments.
METHODS AND MATERIALS
Clot formation
The protocols described in this paper have been approved by the University of Michigan Committee on Use and Care of Animals (UCUCA). Canine blood was used to form clots in-vitro, which has similar values for hematocrit, total protein, fibrinogen and platelets compared with human blood (Cotran et al 1999; Day et al 2000). Fresh whole canine blood was obtained from research subjects and a citrate-phosphate-dextrose (CPD) solution (#C1765, Sigma-Aldrich Co., St. Louis, Missouri, USA) was immediately added as an anti-coagulant at a ratio of 1 mL CPD per 9 mL blood. The blood was stored at 4°C for up to three days prior to use. To induce clotting, a 0.5 M CaCl2 standard solution (#21107, Sigma-Aldrich Co., St. Louis, Missouri, USA) was mixed with the blood, using 0.05 mL CaCl2 per 1 mL blood. The blood was drawn in 0.4 mL volumes into 1 mL syringes to form cylindrical clots with approximate dimensions of 4 mm (diameter) × 20 mm (length). Syringes were transferred to a water bath with temperature 37°C for 2 hours prior to the experiment to incubate the clots. All clots were then carefully removed from syringes, weighed, and transferred to a 0.9% room temperature (21°C), air-saturated saline solution. All clots were treated within 6 hours of addition of CaCl2. The resulting clots prior to treatment had a mean mass of 331 +/− 39.8 mg for those used in the static vessel model. Clots for the flow model were formed on a loose string by mounting the string longitudinally in the syringe. The string with the attached thrombus was removed after clotting, and the ends of the string were fixed to the tube. This technique was used to hold the clot in place under flow during the experiment.
In-vitro static vessel model
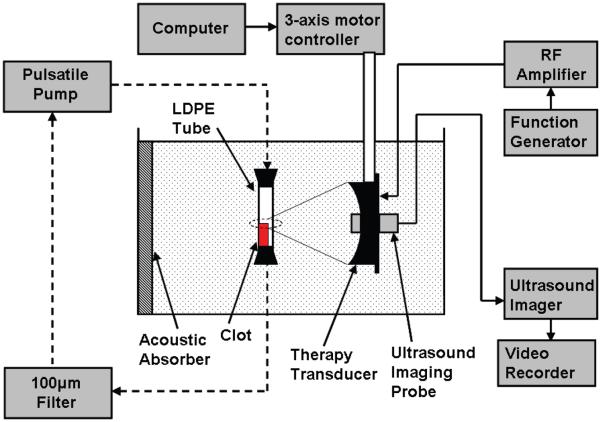
A stationary vessel model with no background fluid flow was employed for assessment of thrombolysis (Figure 1). The model used a 6-mm diameter, 60-mm length low-density polyethylene (LDPE) tube with wall thickness of 500 μm to act as a vessel holding the clot. The LPDE plastic has an acoustic impedance similar to that of a vessel wall (Hoskins 2007; Maev 2008). The tube was filled with 0.9% saline and the clot was carefully transferred to the tube. Tapered silicone rubber stoppers were used to plug the ends of the tube to contain the saline and clot debris from the treatment.
Figure 1.
Experimental apparatus for in-vitro thrombolysis. A blood clot is placed in an LDPE tube and the therapy transducer aligned with the focus at one end of the clot using a 3-axis positioning system. An ultrasound imager is located concentric with the therapy transducer for image-guidance during treatment. A 5 MHz single-element transducer to record backscatter was mounted perpendicular to the therapy transducer with their foci overlapping (not shown). The dashed lines show the connection of the circulatory flow system, when present. In static saline, the ends of the tube are plugged with rubber stoppers.
Ultrasound generation and treatment
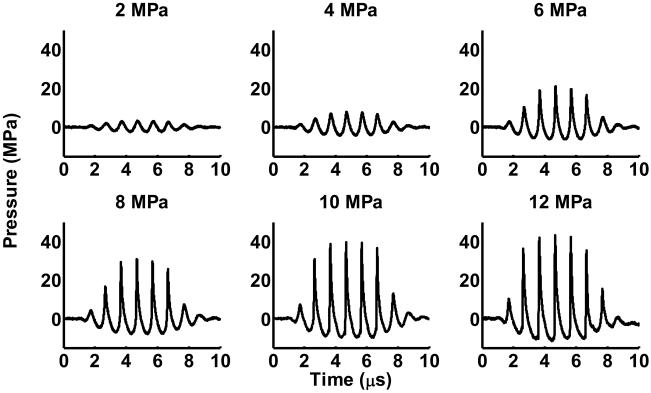
The histotripsy treatment was performed using a piezocomposite 1-MHz focused transducer (Imasonic, S.A., Besancon, France) with a 15-cm focal length and 15-cm diameter. The focal volume is cigar-shaped, with dimensions 15 mm along the axis of propagation and 2.0 mm laterally at −3dB peak negative pressure of 12 MPa. The therapy transducer has a 4-cm diameter hole in the middle for inserting an imaging probe. A class D amplifier developed in our lab was used to drive the transducer. Ultrasound was pulsed using 5-cycle bursts at a pulse repetition frequency (PRF) of 1 kHz. Ultrasound was applied to clots at different peak negative pressures of 2, 4, 6, 8, 10, and 12 MPa with corresponding spatial peak pulse average intensities (ISPPA) of 150, 600, 2000, 3600, 5900, and 7000 W/cm2. Pressure values for the ultrasound were obtained from waveforms recorded using a fiber optic probe hydrophone built in house (Parsons et al. 2006b). The probe was mounted with the fiber end facing perpendicular to the ultrasound propagation to prevent cavitation from corrupting measurements or damaging the tip (Pishchalnikov et al. 2006). The signal was averaged over 200 pulses to reduce noise. Recorded signals are shown in Figure 2. No deconvolution was applied to the recorded waveforms.
Figure 2.
Pressure waveforms of therapy pulses at the focus of the transducer. The signals shown are averages of 200 pulses. The peak negative pressure is listed above each waveform. Measurements were recorded using a fiber optic probe hydrophone.
All treatments were performed at room temperature (21°C), in a degassed water tank with dimensions 100 cm × 75 cm × 67.5 cm. The transducer was mounted to a 3-axis motorized positioning system (Velmex, Inc., Bloomfield, NY, USA) controlled by a personal computer. The positioning system was used to position the clot in the transducer focus. Ultrasound was applied until the entire clot was dissolved or 300 seconds of treatment had occurred. The transducer focus was fixed throughout the treatment and the clot spontaneously moved into the focus until it was completely dissolved. The thrombolysis rate was calculated as the difference in initial mass and final mass of the clot divided by the amount of time ultrasound was applied (total treatment time).
Cavitation monitoring using acoustic backscatter
Acoustic backscatter from the cavitating bubble cloud was passively received using a 2.5-cm aperture 5-MHz focused single-element transducer with a focal length of 10 cm (Valpey Fisher Corp., Hopkinton, Massachusetts, USA). It was connected directly to a digital storage oscilloscope (9354TM, Lecroy, Chestnut Ridge, New York, USA) for data collection. The backscatter signal was recorded by the oscilloscope every 300 ms in a 20 μs window timed to capture the scattered therapy pulse. Previously, we have shown that tissue fractionation only occurs when initiation of a temporally changing acoustic backscatter is detected corresponding to formation of a cavitating bubble cloud (Xu et al. 2005, 2006a, 2008). Here we detected the initiation of the temporally changing scattered wave using the method detailed in our previous study (Xu et al. 2005). One difference in this experiment is that the backscatter receiver was positioned facing 90° from the therapy transducer instead of through the central hole of the therapy transducer, because the hole was occupied by an imaging probe. This technique measures the continuous dynamic change in scattering energy due to pulse-to-pulse changes in the bubble cloud. Briefly, the normalized energy for each backscatter waveform is calculated. A moving standard deviation over time of the normalized energy is then calculated. When this standard deviation (pulse-to-pulse variation in backscatter) is above a set threshold for 3 or more consecutive points, we define this as initiation of a bubble cloud. From this, the total amount of time a bubble cloud was present during treatment for each trial could be calculated. The initiation threshold for each pressure level was determined by linear extrapolation from measurements at the lowest pressure levels, where no initiation was observed.
Ultrasound imaging feedback
A 5-MHz ultrasound imager (System FiVe, General Electric, Fairfield, Connecticut, USA) was used for targeting the clot and monitoring treatment progress. The imager was positioned through the central hole in the therapy transducer such that it always imaged the therapy plane. For targeting prior to treatment, a bubble cloud was generated at the focus of the transducer in the empty water bath and appeared as a hyperechoic zone on an ultrasound image. The position of the hyperechoic zone was marked on the image as the focus. Once the tube containing the clot was added to the water bath, the therapy transducer was positioned so that the focus marker was aligned at one end of the clot. Once the targeting is achieved, histotripsy treatment was applied to the clot. The treatment progress and completion was monitored through reduced echogenicity on the B-Mode image resulting from breakup of the clot.
Measurement of histotripsy clot debris
There is a concern that the clot fragments or debris generated by histotripsy may occlude downstream vessels and cause hazardous emboli. To address this issue, the suspended clot debris was serially filtered through 1 mm, 100 μm, 20 μm, and 5 μm filters after treatment to measure the total weight of particles in each size category. The dry weight of each filter was measured prior to treatment. After filtering, the samples were dried over 12 hours, and each filter was reweighed.
To obtain a more sensitive measurement of particle distribution, the suspended clot debris from the stationary vessel model was also measured using a particle sizing system, a Coulter Counter (Multisizer 3, Beckman Coulter, Fullerton, California, USA). After treatment, the clot debris saline suspension was collected from each of the treated clots and the debris size distribution was measured using the Coulter Counter. This device measures the impedance change due to the displacement by the particle volume of a conducting liquid in which the particles are suspended. The impedance change is proportional to the particle volume. Volume of debris particle is calculated and diameter is estimated assuming a spherical shape for each particle. The measurement size range is 2-60% of the size of aperture tube which is part of the Coulter Counter. We used a 100-μm diameter aperture tube to achieve a dynamic range of 2 – 60 μm in diameter. Debris larger than 60 μm which blocked the aperture tube caused interruption of the measurement, and was noted. The sizing resolution is approximately 1% of the particle diameter. Two measurements were taken for each sample.
Thrombolysis in a pulsatile flow model
To test the effect of high flow rates on histotripsy thrombolysis, clots were treated in a circulatory model with filtered water (Figure 1). Filtered water has the potential to lyse red blood cells due to hypotonicity of the environment. The effects of flow and osmotic gradient on cell lysis were accounted for by a control group of clots which were submerged in the flow system for the same amount of time but were not exposed to histotripsy. The flow model used a pulsatile flow pump (Pulsatile Blood Pump, Harvard Apparatus, Holliston, Massachusetts, USA) with settings to control the pulses per minute and stroke volume. The pump was attached with vinyl tubing to one end of the vessel-mimicking LPDE tube in a water bath to allow flow into the tube. 1-mm and 100-μm rated filter paper was placed downstream from the tube to capture large clot debris and fragments. The pulsatile pump was set to operate at 70 beats per minute (bpm) with a stroke volume of 15 mL and a systolic to diastolic ratio of 35:65. These values were chosen to produce a mean flow velocity of 50 cm/sec in the 6 mm diameter LPDE tube, which is an upper limit for mean blood flow velocities typically found in major vessels (Vennemann 2007).
Clots were formed on a string based on a technique developed previously (Winter et al. 2005, Yu et al. 2000). Both ends of the string were secured to hold the clot in position under flow. The transducer focus was scanned along the clot in the direction opposite of flow at a rate of 0.1 mm/s. After treatment, any remaining clot was removed from the tube and weighed to calculate the thrombolysis rate.
RESULTS
A total of 56 clots were treated in the stationary model. At peak negative pressures (p−) of 2 and 4 MPa, no visible clot disruption was observed. At p− of 6 and 8 MPa, the clot was partially fractionated into tiny debris after 300 seconds of histotripsy treatment. At p− of 10 and 12 MPa, the entire clot was always completely fractionated within 300 seconds of treatment. Clot disruption was only observed visually when a bubble cloud was initiated at the focus of the transducer. If the bubble cloud was generated adjacent to the clot (within 10 mm), the clot would spontaneously move towards the bubble cloud until the center of the clot was aligned with the bubble cloud. During thrombolysis, the color of the clot changed from red to white at the surface where it was eroded, and then further dissolved until no visible fragments remained. This suggests red blood cells were destroyed prior to breakdown of the extracellular clot matrix. The progression of a treatment is shown in Figure 3.
Figure 3.
Progression of treatment in static saline. Ultrasound propagation is from right to left in the image. The clot moves into the focus of the transducer almost immediately after ultrasound exposure is started generated. The clot quickly loses mass and is bisected at the focus. Each of the two larger pieces is then dissolved over 45 seconds until no visible particles remain.
Thrombolysis rates vs. pressure
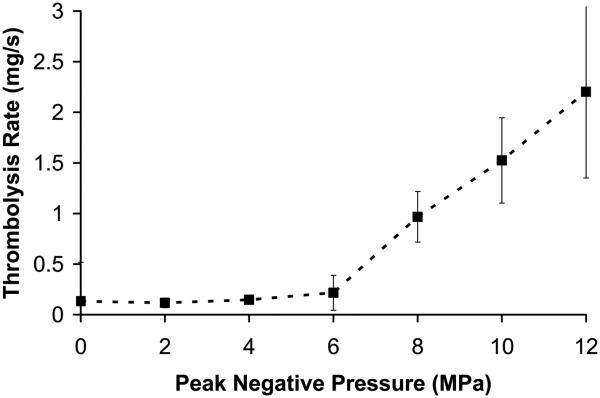
The thrombolysis rate was plotted as a function of peak negative pressure (p− = 0 to 12 MPa) in Figure 4a (mean and standard deviation, n = 8). The corresponding peak positive pressure and ISPPA are listed in Table 1. In the control group (p− = 0 MPa), clots were placed in saline for 5 minutes without ultrasound exposure, and visible clot disruption was never observed. Similarly, at p− of 2 and 4 MPa, no visible changes we observed during treatment and the thrombolysis rate was not statistically different from that of the control group. The thrombolysis rate was 0.13 +/− 0.038 mg/sec for the control group and 0.12 +/− 0.047 mg/sec at pressure of 4 MPa (t-test, P = 0.22). It is possible that most of the weight reduction for each of these three groups was due to handling of the clot to transfer it into and out of the tube or dissolution of clot serum into the saline.
Figure 4.
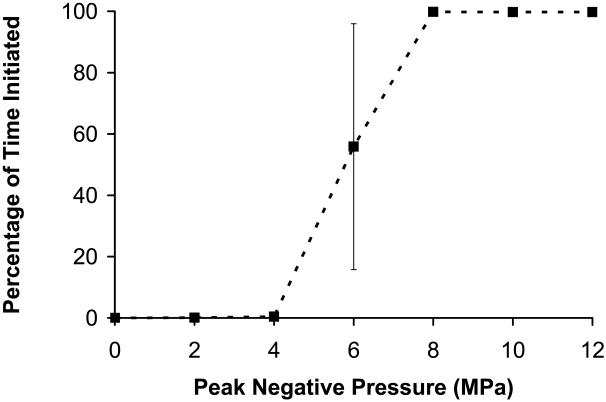
(a) Thrombolysis rate as a function of peak negative pressure at the therapy focus (mean +/− standard deviation, n = 8). Pressures below 6 MPa had no observable effect on the clot after 5 minutes of treatment. At 6 MPa or greater, an increase in rate is observed, and the clot is quickly dissolved in times ranging between 80 - 300 seconds. (b) Percentage of time initiated vs. peak negative pressure. The percentage of time initiated is defined as the initiated time divided by the total treatment time. Initiation here refers to the initiation of a temporally changing backscatter described in the text. For pressures < 6MPa, initiation was never detected. Above 6 MPa, initiation was always observed and the initiated state remained throughout the treatment.
Table 1.
Number of treatments with bubble cloud initiation and significant thrombolysis at each pressure level. (n = 8 at each pressure)
| P− (Mpa) |
P+ (Mpa) |
Isppa (W/cm2) |
Istpa (W/cm2) |
Clot Weight (Pre) (mg) |
Clot Weight (Post) (mg) |
Number of treatments with thrombolysis* |
Number of treatments with initiation |
|---|---|---|---|---|---|---|---|
| 0 | 0 | 0 | 0 | 340 ± 38 | 300 ± 40 | 0 | 0 |
| 2 | 3 | 150 | 1 | 320 ± 54 | 285 ± 54 | 0 | 0 |
| 4 | 8 | 600 | 4 | 342 ± 34 | 296 ± 27 | 0 | 0 |
| 6 | 20 | 2000 | 14 | 316 ± 39 | 251± 73 | 4 | 7 |
| 8 | 32 | 3600 | 25.2 | 354 ± 25 | 64 ± 52 | 8 | 8 |
| 10 | 39 | 5900 | 41 | 310 ± 41 | 1.2 ± 3.5 | 8 | 8 |
| 12 | 43 | 7000 | 49 | 332 ± 32 | 1.2 ± 3.5 | 8 | 8 |
The occurrence of thrombolysis is defined in this paper as any treatment where the thrombolysis rate is greater than twice the mean thrombolysis rate of the control group.
At p− = 6 MPa, 4 of 8 clots treated had rates similar to the control group (0.066 +/− 0.047 mg/sec). The other 4 clots had significantly higher thrombolysis rates (0.366 +/− 0.087 mg/sec) than control. At p− ≥8 MPa, a significant increase in thrombolysis rate was observed for all clots in comparison to the control group (paired t-test, P < 0.0001). At the highest pressures (p− of 10 and 12 MPa), all clots were completely fractionated in times between 80 – 260 seconds. There was an increase in thrombolysis rate with peak negative pressure between 6-12 MPa (t-test, P < 0.05). The mean rate was 0.21 +/− 0.17 mg/sec at p− of 6 MPa and 2.20 +/− 0.85 mg/sec at p− of 12 MPa.
Cavitation monitoring using acoustic backscatter
Detection of temporally changing acoustic backscatter was used to monitor a cavitating bubble cloud. Without the initiation and maintenance of this temporally changing backscatter, no tissue fractionation was generated by histotripsy in our previous studies (Xu et al. 2005; Parsons et al. 2007). Here we found that without initiation, no thrombolysis was observed, i.e., the thrombolysis rate was similar to the control rate. In 28 of 31 treatments (90%) where initiation was detected, the thrombolysis rate was significantly higher than the control. Table 1 shows the number of events for each pressure where thrombolysis occurred, as well as the number of events where initiation occurred. We consider thrombolysis to occur when the thrombolysis rate is greater than twice the control rate.
We calculated the percentage of time a bubble cloud was initiated throughout treatment. The percentage of initiated time is the amount of time that temporally changing acoustic backscatter is detected divided by the total treatment time. The percentage of initiated time was plotted as a function of peak negative pressure (Figure 4b). P− of 2-4 MPa had very low mean values for percentage of initiated time (< 0.5%) and thrombolysis was never observed at these pressure levels. P− of 6 MPa had an intermediate percentage of initiated time of 56%. At this value, 4 clots where thrombolysis occurred also had a high percentage of initiated time (mean 87%) vs. 4 with low thrombolysis rates (mean 25%). For 8-12 MPa, the mean percentage of initiated time was > 99.6% and thrombolysis always occurred. This supports the claim that the cavitation cloud is necessary for histotripsy thrombolysis.
The thrombolysis rate at P− = 6 MPa was previously defined as the mass loss divided by the total treatment time. However, it was shown that during only 56% of the treatment time was a bubble cloud present. To obtain an estimate of the thrombolysis rate only when a cloud is initiated, the total initiated time can be used to calculate rate instead of total treatment time. This calculation gives a thrombolysis rate of 0.58 +/− 0.17 mg/sec, which is significantly higher than the thrombolysis rate calculated using the treatment time. Since thrombolysis appears to only occur when the bubble cloud is initiated, this rate provides a better measure for the efficiency of the bubble cloud.
Ultrasound imaging
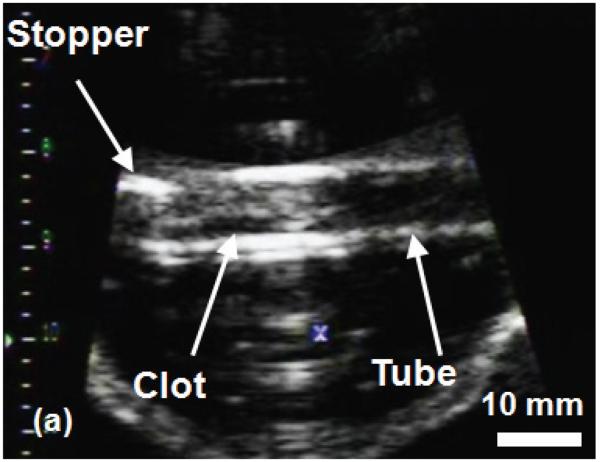
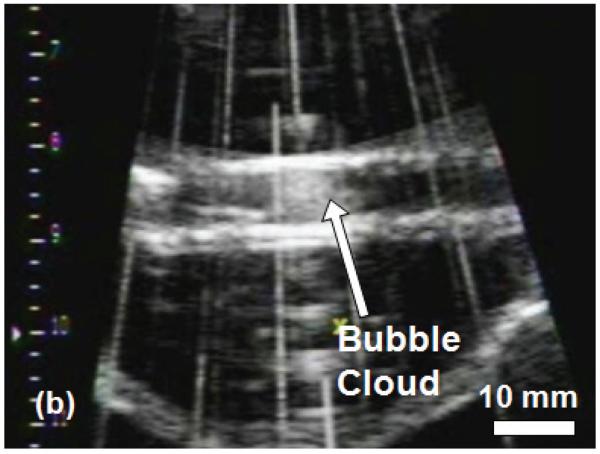
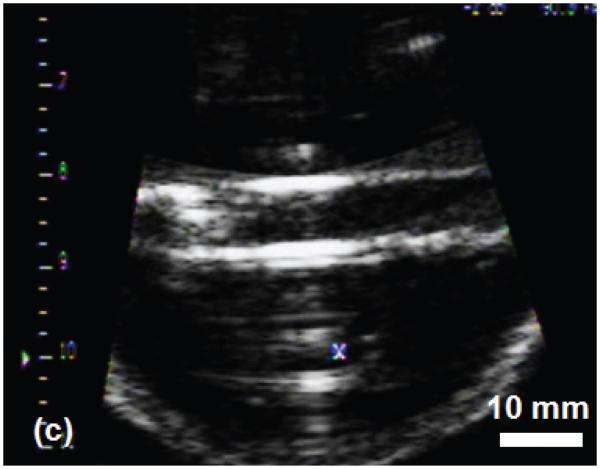
The histotripsy thrombolysis treatment was monitored with B-mode ultrasound imaging in real-time. Prior to application of ultrasound, the clot appeared as a hyperechoic zone inside the tube walls on the B-mode ultrasound image (Figure 5a). During the treatment, a bubble cloud was generated in the tube adjacent to the clot, which appeared as a temporally changing hyperechoic zone at the therapy transducer focus (Figure 5b). Interference of the therapy acoustic pulses with the imager caused only minimal corruption of the image due to the low duty cycle used for treatment (0.5%). As the treatment progressed, the clot's hyperechoic zone reduced in size and echogenicity. The bubble cloud remained on the clot surface throughout the treatment. Once the clot was entirely fractionated, its hyperechoic zone on the image disappeared and the inside of the tube became hypoechoic (Figure 5c).
Figure 5.
B-Mode images of the histotripsy thrombolysis treatment using a 5 MHz imaging probe. The imaging probe is approximately 8 cm from the ultrasound focus. The ultrasound propagation is from top to bottom of the image. The clot is visible in the tube as an echogenic region prior to insonation (a). The bubble cloud is visible during treatment in (b). The vertical lines in (b) are acoustic interference of the therapy transducer with the imager. However, most of the image remains uncorrupted. The echogenicity of the clot is greatly reduced after complete thrombolysis (c).
Measurement of histotripsy clot debris
To obtain the size distribution of clot debris generated by histotripsy, samples were measured using filter papers rated to 5 μm, 20 μm, 100 μm and 1 mm. The wet and dry weights of several whole clots were recorded. Whole clots with a wet weight of 350 mg were reduced to 100 mg weight once dried. We then measured the change in dry weight of the filter to estimate the debris size distribution. All four filters' dry weights changed by ≤ 1 mg. No significant difference was found between control and any of the treated samples. These results suggest that at least 96% (96 mg of 100 mg) of the clot was broken down to particles smaller than 5 μm.
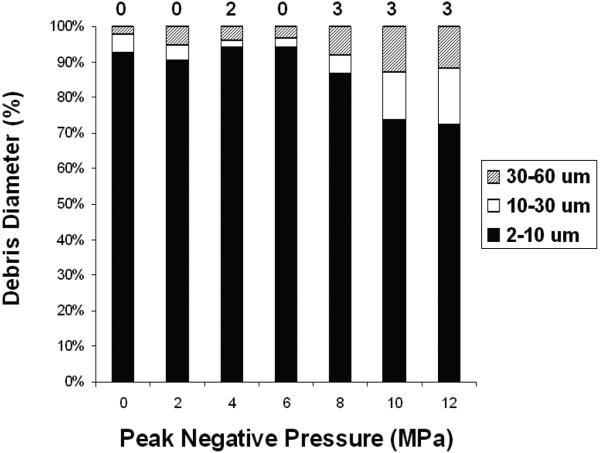
Additionally, saline samples containing suspended clot debris were removed from the tube after each treatment and measured by the Coulter Counter. The mean debris distributions between 2 – 60 μm particle diameter are shown in Figure 6. For control clots, a mean of 95% +/− 4% of the debris volume was between 2-10 μm, 3% between 10-30 μm, and 2% between 30 - 60 μm. In treatment samples where thrombolysis was detected, 72-94% of the debris was 2-10 μm, and 3-12% was between 30-60 μm. The mean number of particles counted in the treatment samples was similar to the controls. Samples treated at the highest pressures (10 and 12 MPa) had a higher percentage of larger particles (30-60 μm) than lower pressures. Debris distributions also showed a large increase in particles smaller than 6 μm for those treated at high pressures, suggesting the disruption of individual cells.
Figure 6.
Debris volume distribution by particle diameter as measured by the Coulter Counter. A majority of the debris volume is smaller than 10 μm diameter for samples at all pressure levels. However, an increase in larger particles (30-60 μm) is apparent at 10 and 12 MPa. The number of measurements where the 100 μm tube was blocked (number of particles > 60 um) is listed above each bar in the figure. There were 16 measurements taken at each pressure level.
In 2 of 56 measurements (two measurements per treatment) where thrombolysis was not detected, the 100 μm tube was blocked. In 9 of 56 measurements where thrombolysis was detected, the 100 μm tube was blocked. The blockage of the tube suggested the presence of one or more particles larger than 60 μm. These results suggest that particles larger than 60 μm are generated during the treatment, although some of them may result from process other than histotripsy thrombolysis.
Thrombolysis under flow
Since cavitation may be influenced by the presence of flow, e.g., cavitation nuclei may be swept away, the feasibility of histotripsy thrombolysis was also tested in a fast flow environment. Clots were treated under a mean flow velocity of 50 cm/s. This value is the upper limit of mean flow velocities in major vessels. Clots formed for this experiment were smaller (150 +/− 26 mg) than those used in the stationary clot model due to difficulty forming large clots on the string. Eight clots were treated at p− = 12 MPa, and clot weight was reduced by 72% +/− 21% (mean and standard deviation) in the fast flow in 100 seconds. During this time, the therapy focus was scanned to cover the entire clot at a scanning rate of 0.1 mm/sec. The thrombolysis rate was 1.07 +/− 0.34 mg/s, significantly higher than the control rate of 0.27 +/− 0.12 (t-test, P < 0.0002). However, the rate at p− = 12 MPa here was lower than those in static saline at the same pressure level.
Serial filters of 1 mm and 100 μm were used to capture any large clot debris or fragments generated by histotripsy treatment. No measurable debris was captured by the 1 mm filter. In two of the eight treated clots, 5% and 12% of the initial clot weight was captured by the 100 μm filter paper. In one of eight control clots, 17% of the clot weight was captured by the 100 μm filter. All other filters showed less than 3% variance in weight before and after the experiment. We do not exclude the possibility that large clot fragments were separated from the string by the flow due to weak adhesion.
Capture and fractionation of clot emboli
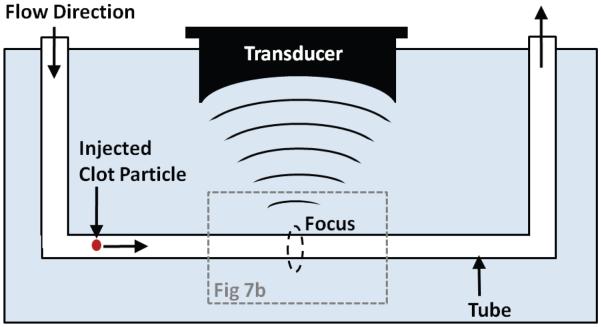
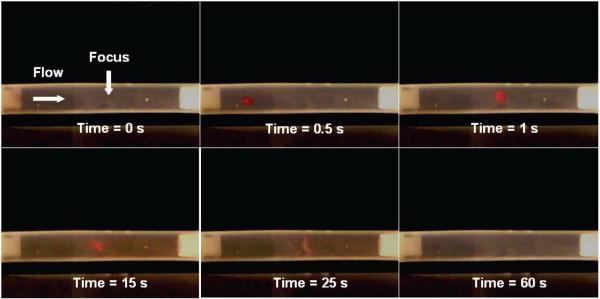
If large clot fragments escape from the treatment region, they may become hazardous emboli. This potential problem is a main concern for the safety of histotripsy thrombolysis. To address this issue, we tested the use of a secondary cavitating bubble cloud as a non-invasive emboli filter. Our preliminary results show that when a clot fragment flows into the cavitating bubble cloud generated by histotripsy in a vessel tube, it can be stopped (and trapped) near the cloud and further fractionated into small debris. Clot fragments of diameter 3 mm were cut from formed clots, and injected into the circulatory model with a background flow of ~5 cm/s and upstream from the transducer focus. In the example shown in Figure 7, a bubble cloud was generated in the tube center using p− of 12 MPa. The bubble cloud occupied approximately 1/3 of the tube diameter. The 3 mm clot fragment drifted into the bubble cloud and became trapped near the transducer focus. While trapped in the cloud, the clot was further fractionated. Within one minute from when the clot fragment entered the bubble cloud, it was completely broken down with no visible fragments remaining.
Figure 7.
(a) Schematic of the experiment demonstrating the ability of histotripsy to trap clot fragments. A transducer is focused in a tube with flow. A clot particle is injected into the tube which is swept into the focus of the ultrasound. (b) A clot fragment flows from the left side of the tube into the bubble cloud at the focus of the transducer generated prior to arrival of the fragment, with p− of 12 MPa. The clot fragment remains near the cloud at the transducer focus, and is further broken down over the course of 60 seconds. The bubble cloud is transparent and not visible in the images. The mean background flow rate is −5 cm/s from left to right.
We repeated this experiment 13 times to test the ability of histotripsy to capture clot fragments that would potentially be hazardous emboli. Of the 13 trials, all clots were stopped as they drifted into the bubble cloud. The clot fragments were further fractionated to smaller particles which were then ejected from the cloud. The largest particles ejected from the cloud were sub-millimeter. When the clot fragments were captured, 7 of the 13 clots were completely fractionated in a time of 142 +/− 99 seconds. 5 of 13 clots were partially fractionated before being swept out of the tube. They were held near the bubble cloud for a mean time of 132 +/− 66 seconds. 1 of 13 clots was held near the bubble cloud for 5 seconds, but was then swept downstream by background flow and remained unfragmented.
DISCUSSION
Current clinical thrombolysis methods, including catheter-based procedures and thrombolytic drugs, have major drawbacks. Both these methods can cause severe bleeding and catheters are invasive and can cause infection. Ultrasound-enhanced thrombolysis may increase the reperfusion rate, but can also cause bleeding, as it involves the use of thrombolytic drugs. Histotripsy does not require drugs and is non-invasive, and thus has the potential to overcome these limitations. In addition, our results show that histotripsy can dissolve 300 mg clots in 1.5-5 minutes. The thrombolysis rates demonstrated from our in-vitro experiments are order of magnitude faster than those for drugs. Since histotripsy is non-invasive and does not involve a complex procedure to insert catheter into the treatment region, it would also require less time and lower cost than a surgical catheter.
In this study, ultrasound by itself was applied to cause thrombolysis. Previous researchers explored the use of high-intensity focused ultrasound alone to break down blood clots (Rosenschein et al. 2000; Westermark et al. 1999). It was suggested that cavitation collapses were the underlying cause of damage. Cavitation has been and is still generally regarded as uncontrollable and unpredictable. Our group has been studying the mechanism of cavitation and found that it can be well controlled using specific ultrasound pulse sequences to produce targeted fractionation of soft tissue including blood clots. A histotripsy pulse sequence includes very short pulses (< 50 μs) at very high pressures (>6 MPa) and low duty cycles (0.1-5%). Our hypothesis regarding the mechanism of histotripsy is that each ultrasound pulse creates a cluster of microbubbles localized at the transducer focus. The microbubbles within the cluster collapse causing local stresses which remove a portion of the targeted tissue. These individual microbubbles also act as nuclei which can be excited by subsequent pulses, predisposing tissue in the focal region to further damage. Our previous studies show that tissue fractionation only occurs with the initiation and maintenance of a cavitating bubble cloud (Xu et al 2005), which can be achieved using appropriate ultrasound pulse sequences (i.e. histotripsy pulses). Bubble cloud initiation and maintenance can be detected by cavitation feedback monitoring. Cavitation feedback includes ultrasound imaging and acoustic backscatter signals with specific traits, such as high temporally-changing backscatter amplitudes (Xu et al. 2005) and increased broadband noise levels (Parsons et al. 2006a).
Our understanding of histotripsy is consistent with the results from this paper. We found that thrombolysis only occurs when the cavitating bubble cloud was detected by acoustic backscatter. The acoustic parameters effective for thrombolysis are also consistent with the parameters we found effective for other soft tissue fractionation, using short pulses, a low duty cycle, and a peak negative pressure >= 6MPa. It is possible that the actual threshold value for bubble cloud initiation and thrombolysis will be different in-vivo than in this situation, due to the difference in cavitation environment such as the availability of pre-existing nuclei and the properties of the fluid and tissue surrounding the clot.
While we have demonstrated correlation between the cavitating bubble cloud and the fractionation of tissue, how individual bubbles interact with the targeted tissue to cause fractionation is not sufficiently understood. A variety of damage mechanisms have been proposed, including collapse of individual microbubbles causing shockwaves or high-velocity liquid jets (Brujan et al. 2005; Evan et al. 2002), bubble cloud collapse (Ikeda et al. 2006), microstreaming-induced shear forces and acoustic streaming (Sweet et al. 1996), or combinations of these effects. The interaction between cavitation and cells is the focus of our future mechanistic study.
One major advantage of histotripsy is that it can be easily guided by real-time ultrasound imaging for targeting and treatment monitoring. The results suggest that histotripsy thrombolysis can be also guided using real-time ultrasound imaging. The bubble cloud is highly echogenic and dynamic on a B-mode image, and blood clots can be readily identified and aligned to the therapy focus. The progression of thrombolysis can also be monitored by observing clot echogenecity and Doppler color flow mapping of the occluded vessel (Naz et al. 2005). Using these techniques, histotripsy thrombolysis can be visualized and guided by real-time ultrasound imaging feedback, which is a primary challenge for any non-invasive technique and essential to ensure the treatment accuracy and efficiency.
As bubble dynamics are highly dependent on their environment, there is a possibility that the effects of histotripsy may be hindered by high blood flow velocities. The maintenance of a bubble cloud likely depends on previously initiated nuclei, and those nuclei may be swept out of the focus by background flow. We studied the feasibility of histotripsy thrombolysis at the highest natural flow velocity in-vivo (50 cm/sec). When clots were subjected to a high-velocity pulsatile flow, histotripsy was still capable of fractionating the clot. This result shows that a cavitation cloud can be initiated and maintained in the fast flow. In this situation, the thrombolysis rate was lower than those treated without flow. This could be because the clot is held in a fixed position in the flow model, and the transducer focus must scan along the clot to completely fractionate it. Since we did not optimize the scanning velocity, some of the clot remained intact after treatment in several cases.
Since histotripsy causes damage by microbubbles that are very small (particularly when they collapse), histotripsy can fractionate tissue to tiny debris. When histotripsy is used to treat soft tissues (e.g. kidney, myocardium, and prostate), it fractionates tissue to a sub-cellular level with debris of a few microns or smaller. Similarly, histotripsy can fractionate a blood clot into small debris. The filter measurements suggest >96% of the debris weight was smaller than 5 μm. The Coulter Counter method also showed that small particles (2-10 μm) were a majority (74-94%) of debris in the range of 2-60 μm. The fact that the number of particles counted in both control and treated samples was similar suggests that a majority of debris generated by histotripsy is outside of the Coulter Counter range (i.e. likely smaller than 2 μm). Both the filter and Coulter Counter measurements indicated that histotripsy breaks the clot into particles below the size of individual red blood cells (6-8 μm). 100-μm mechanical filters have been used to successfully prevent embolism, and only particles larger than this may be considered potentially unsafe emboli. The Coulter Counter measurement suggests that there are occasionally debris particles larger than 100 μm. Debris generated at lower pressures (6 and 8 MPa) also contained fewer large fragments than higher pressures. It is possible that we could adjust acoustic parameters to minimize the number of large particles. However, it is not clear that whether particles >100 μm can be avoided completely during treatment.
We tested a method to reduce the risk of embolism, using a bubble cloud to capture and fractionate the emboli. In the preliminary test, we demonstrated that the bubble cloud can trap a large clot particle, even in a flow field, near the focus and further fragment it. This acoustic trapping ability is likely due to cavitation-induced fluid flow. Microstreaming can generate a flow pattern pulling particles towards a single bubble even in the presence of an overall directional flow (Elder 1959). This phenomenon is also applicable (and may be magnified) when bubbles act collectively as a cloud (Arora et al. 2005; Hansson et al. 1982). Using the acoustic trapping property of histotripsy, we plan to develop a Non-invasive Embolus Trap (NET), which is a secondary cavitating bubble cloud set downstream of the primary treatment cloud to capture and further fractionate any escaping clot fragments. The NET could be created by a separate transducer and effectively act as a filter for large emboli. Our preliminary test indicated that clot fragments can be trapped and further broken down into smaller fragments. In our experiment, the observed bubble cloud was only 1/3 of the tube diameter and did not occupy the whole tube. Its small size is possibly why some fragments escaped from the cloud before complete fractionation and a significant amount of debris larger than 100 μm were measured. By applying appropriate acoustic parameters, the bubble cloud size can be changed (Xu et al. 2007) to occupy a larger portion of the tube and maintain greater control over particles. It is possible that different sets of parameters will be optimal for the NET than for the thrombolysis treatment. The NET would add an additionally degree of safety to the treatment, and may be an effective means to prevent embolism in other vascular surgeries.
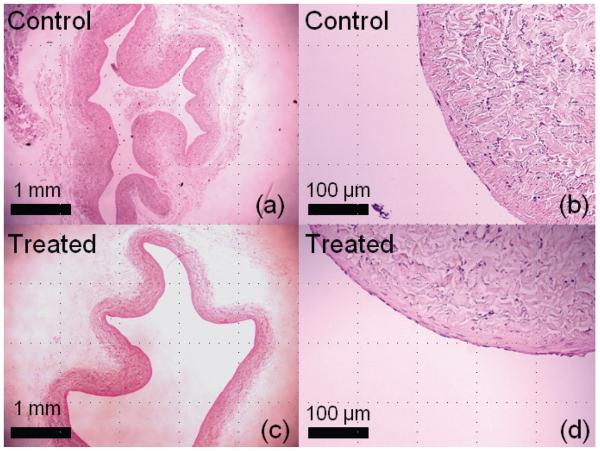
Aside from embolism, there are other concerns that must be addressed regarding the safety of histotripsy thrombolysis. As histotripsy mechanically fractionates a clot, there is a possibility that the bubble cloud generated for thrombolysis or the NET might also damage the surrounding blood vessel. We have treated clots in a canine aorta segment and vena cava segment using the same acoustic parameters as in this study at a pressure level of p− = 12 MPa. Figure 8 shows the histology of control and treated segments after 300 seconds of exposure. Histotripsy-treated aorta and vena cava walls remained intact in our initial histological study. Small areas of endothelial disruption were found on both control and treated vessels. However, no damage was apparent to the underlying smooth muscle or adventitia. The observed damage to endothelium could possibly be due to slicing during histology preparation or histotripsy treatment. The vessel's higher resistance to histotripsy-induced damage is likely due to its mechanical strength being higher than that of soft tissues we have treated previously. In addition to mechanical damage, the vessel may also be damaged by ultrasound-induced heating. However, histotripsy uses a very low duty cycle and the time-averaged intensity at the focus is low. In the experiments reported here, the maximum Istpa was 49 W/cm2. We have previously investigated the acoustic parameter space of histotripsy (Kieran 2007) and have used parameters which primarily cause mechanical ablation without significant heating. The temperature rise during the treatment of clots in static saline was measured by thermocouple. The maximum temperature rise recorded over 5 minutes was 7°C, which is unlikely to cause thermal damage to the vessel wall. With the presence of flow, the temperature rise is expected to be lower due to heat convection. Possible vessel damage is an important safety issue, which we plan to further study in acute and chronic in vivo animal studies.
Figure 8.
Histological slides (H&E stain) from treatment of clots in canine inferior vena cava segments. A control sample is shown in (a) and a magnified view in (b). A treated sample exposed to 300 seconds of ultrasound at p− of 12 MPa is shown in (c) and a magnified view (d). Both samples were intact, and no discernable damage was observed to the treated vein wall.
Hemolysis may also be an adverse effect of histotripsy thrombolysis. Red blood cells are easily damaged by shear forces, and have been previously shown to be susceptible to cavitation (Danckwerts and Juergens 1977; Poliachik et al. 1999). The debris measurements suggest that histotripsy breaks down red blood cells within the clot to subcellular fragments. Therefore, it is also likely that free erythrocytes in blood will also be lysed. When hemolysis occurs in a significant volume of blood, it can cause hemolytic anemia and hyperkalemia (Sweet et al. 1996). As the treatment is only localized to the small focal volume and the flow rates in occluded vessels are generally low, it is unlikely that large volumes of blood will be lysed during the treatment. Ultrasound (and cavitation in particular) has also been observed to cause platelet aggregation and activation, which facilitates clotting (Poliachik et al 2004). There is a possibility that histotripsy may similarly cause clot reformation by activating platelets. We plan to study all these possible side effects of histotripsy thrombolysis in our future in-vitro and in-vivo experiments.
SUMMARY
The results show that histotripsy mechanically fractionates blood clots into small particles. Histotripsy can completely remove large clots in both a controlled static saline environment and a fast flow model simulating in vivo blood flow. In both cases, the treatment time lasted less than five minutes for large clots (140-300mg). Thrombolysis only occurred when the presence of a dense cavitation cloud was detected. Debris particles generated by histotripsy thrombolysis was measured and revealed >96% particle weight smaller than 5 μm, although some particles > 100 μm were generated. To address this issue, we tested the ability of histotripsy to trap and further fractionate large clot fragments. We found that the cavitating bubble cloud can capture and simultaneously fractionate a clot fragment flowing through the cloud. This ability may provide a novel tool to capture and eliminate hazardous emboli by setting a secondary bubble cloud downstream of the treatment cloud. These findings suggest that histotripsy is a viable new thrombolysis strategy. Our continued work in vivo and in vitro will focus on addressing the safety and efficacy of the technique.
Acknowledgements
This material is based upon work supported under a National Science Foundation Graduate Research Fellowship. This work is funded by grants from The National Institute of Health (R01 HL077629 and R01 EB008998) and The Wallace H. Coulter Foundation. The third and fourth authors have made equal contributions to this study.
Footnotes
Publisher's Disclaimer: This is a PDF file of an unedited manuscript that has been accepted for publication. As a service to our customers we are providing this early version of the manuscript. The manuscript will undergo copyediting, typesetting, and review of the resulting proof before it is published in its final citable form. Please note that during the production process errors may be discovered which could affect the content, and all legal disclaimers that apply to the journal pertain.
REFERENCES
- Alesh I, Kayali F, Stein PD. Catheter-directed thrombolysis (intrathrombus injection) in treatment of deep venous thrombosis: a systematic review. Catheter. Cardio. Interv. 2007;70:143–148. doi: 10.1002/ccd.21079. [DOI] [PubMed] [Google Scholar]
- Arora M, Junge L, Ohl CD. Cavitation cluster dynamics in shock-wave lithotripsy: Part 1. Free field. Ultrasound Med. Biol. 2005;31:827–839. doi: 10.1016/j.ultrasmedbio.2005.02.007. [DOI] [PubMed] [Google Scholar]
- Atar S, Rosenshein U. Perspectives on the role of ultrasonic devices in thrombolysis. J. Thromb. Thrombolys. 2004;17(2):107–114. doi: 10.1023/B:THRO.0000037665.21691.61. [DOI] [PubMed] [Google Scholar]
- Bates SM, Ginsberg JS. Treatment of deep-vein thrombosis. N Engl J Med. 2004;351:268–77. doi: 10.1056/NEJMcp031676. [DOI] [PubMed] [Google Scholar]
- Bjarnason H, Kruse JR, Asinger DA, et al. Iliofemoral deep venous thrombosis: safety and efficacy outcome during 5 years of catheter-directed thrombolytic therapy. J Vasc Interv Radiol. 1997;8(3):405–18. doi: 10.1016/s1051-0443(97)70581-5. [DOI] [PubMed] [Google Scholar]
- Brujan EA, Ikeda T, Matsumoto Y. Jet formation and shock wave emission during collapse of ultrasound-induced cavitation bubbles and their role in the therapeutic applications of high-intensity focused ultrasound. Phys. Med. Biol. 2005;50:4797–4809. doi: 10.1088/0031-9155/50/20/004. [DOI] [PubMed] [Google Scholar]
- Cooper M, Xu Z, Rothman ED, Levin AM, Advincula AP, Fowlkes JB, Cain CA. Controlled ultrasound tissue erosion: the effects of tissue type, exposure parameters and the role of dynamic microbubble activity. IEEE Ultrasonics Symposium. 2004;3:1808–1811. [Google Scholar]
- Cotran RS, Kumar V, Collins T, Robbins SL. Robbins Pathologic Basis of Disease. 7th edition W.B. Saunders Co; Philadelphia, PA: 1999. [Google Scholar]
- Danckwerts HJ, Juergens KD. Ultrasonic investigations of hemolysis. Ultrasound Med. Biol. 1977;2:339–341. doi: 10.1016/0301-5629(77)90039-4. [DOI] [PubMed] [Google Scholar]
- Daniels S, Kodama T, Price DJ. Damage to red blood cells induced by acoustic cavitation. Ultrasound Med. Biol. 1995;21:113–119. doi: 10.1016/0301-5629(94)00089-1. [DOI] [PubMed] [Google Scholar]
- Day MJ, Mackin A, Littlewood JD. BSAVA manual of canine and feline haematology and transfusion medicine. British Small Animal Veterinary Association; Quedgeley, Gloucester, UK: 2000. [Google Scholar]
- Deng CX, Xu Q, Apfel RE, Holland CK. In vitro measurements of inertial cavitation thresholds in human blood. Ultrasound Med. Biol. 1996;22:939–948. doi: 10.1016/0301-5629(96)00104-4. [DOI] [PubMed] [Google Scholar]
- Elder S. Cavitation Microstreaming. J. Acoust. Soc. Am. 1959;31(1):54–64. [Google Scholar]
- Evan AP, Willis L, McAteer J, Bailey MR, Conners B, Shao Y, Lingeman J, Williams JR, Fineberg N, Crum LA. Kidney damage and renal functional changes are minimized by waveform control that suppresses cavitation in shock wave lithotripsy. J. Urol. 2002;168(4):1556–1562. doi: 10.1016/S0022-5347(05)64520-X. [DOI] [PubMed] [Google Scholar]
- Francis CW, Suchkova VN. Ultrasound and thrombolysis. Vasc Med. 2001;6:181–187. doi: 10.1177/1358836x0100600309. [DOI] [PubMed] [Google Scholar]
- Gutt CN, Oniu T, Wolkener F, Mehrabi A, Mistry S, Büchler MW. Prophylaxis and treatment of deep vein thrombosis in general surgery. Am. J. Surg. 2005;189:14–22. doi: 10.1016/j.amjsurg.2004.04.009. [DOI] [PubMed] [Google Scholar]
- Hall TL, Fowlkes JB, Cain CA. A real-time measure of cavitation induced tissue disruption by ultrasound imaging backscatter reduction. IEEE Trans. Ultrason. Ferroelectr. Freq. Control. 2007;54:569–575. doi: 10.1109/tuffc.2007.279. [DOI] [PubMed] [Google Scholar]
- Hansson I, Kedrinskii V, Morch KA. On the dynamics of cavity clusters. J. Phys. D.Appl. Phys. 1982;15:1725–1734. [Google Scholar]
- Hoskins PR. Physical properties of tissues relevant to arterial ultrasound imaging and blood velocity measurement. Ultrasound Med. Biol. 2007;33(10):1527–1539. doi: 10.1016/j.ultrasmedbio.2007.04.020. [DOI] [PubMed] [Google Scholar]
- Ikeda T, Yoshizawa S, Tosaki M, Allen J, Takagi S, Ohta N, Kitamura T, Matsumoto Y. Cloud cavitation control for lithotripsy using high intensity focused ultrasound. Ultrasound Med. Biol. 2006;32(9):1383–1397. doi: 10.1016/j.ultrasmedbio.2006.05.010. [DOI] [PubMed] [Google Scholar]
- Kieran K, Hall TL, Parsons JE, Wolf JS, Jr., Fowlkes JB, Cain CA, Roberts WW. Refining Histotripsy: Defining the Parameter Space for the Creation of Nonthermal Lesions With High Intensity, Pulsed Focused Ultrasound of the In Vitro Kidney. J. Urol. 2007;178(2):672–676. doi: 10.1016/j.juro.2007.03.093. [DOI] [PubMed] [Google Scholar]
- Kim HS, Patra A, Paxton BE, Khan J, Streiff MB. Catheter-directed thrombolysis with percutaneous rheolytic thrombectomy versus thrombolysis alone in upper and lower extremity deep vein thrombosis. Cardiovasc. Intervent. Radiol. 2006;29:1003–1007. doi: 10.1007/s00270-005-0341-4. [DOI] [PubMed] [Google Scholar]
- Kyrle PA, Eichinger S. Deep vein thrombosis. Lancet. 2005;365:1163–74. doi: 10.1016/S0140-6736(05)71880-8. [DOI] [PubMed] [Google Scholar]
- Maev R. Acoustic Microscopy: Fundamentals and Applications. Wiley-VCH; Weinheim, Germany: 2008. [Google Scholar]
- Mewissen MW, Seabrook GR, Meissner MH, Cynamon J, Labropoulos N, Haughton SH. Catheter-directed thrombolysis for lower extremity deep venous thrombosis: report of a national multicenter registry. Radiology. 1999;211:39–49. doi: 10.1148/radiology.211.1.r99ap4739. [DOI] [PubMed] [Google Scholar]
- Naz R, Naz S, Mehboob M, Achakzai A, Khalid GH. Diagnostic yield of color Doppler ultrasonography in deep vein thrombosis. J Coll Physicians Surg Pak. 2005;15(5):276–9. [PubMed] [Google Scholar]
- Nedelmann M, Martin Eicke, Lierke EG, Heimann A, Kempski O, Hopf CH. Low-frequency ultrasound induces nonenzymatic thrombolysis in vitro. J Ultrasound Med. 2002;21:649–656. doi: 10.7863/jum.2002.21.6.649. [DOI] [PubMed] [Google Scholar]
- O'Sullivan GJ, Lohan DG, Gough N, Cronin CG, Kee ST. Pharmacomechanical thrombectomy of acute deep vein thrombosis with the Trellis-8 isolated thrombolysis catheter. J Vasc Interv Radiol. 2007;18:715–724. doi: 10.1016/j.jvir.2007.03.013. [DOI] [PubMed] [Google Scholar]
- Parsons JE, Cain CA, Abrams GD, Fowlkes JB. Pulsed cavitational ultrasound therapy for controlled tissue homogenization. Ultrasound Med. Biol. 2006a;32:115–129. doi: 10.1016/j.ultrasmedbio.2005.09.005. [DOI] [PubMed] [Google Scholar]
- Parsons JE, Cain CA, Fowlkes JB. Cost-effective assembly of a basic fiber-optic hydrophone for measurement of high-amplitude therapeutic ultrasound fields. J. Acoust. Soc. Am. 2006b;119(3):1432–1440. doi: 10.1121/1.2166708. [DOI] [PubMed] [Google Scholar]
- Parsons JE, Cain CA, Fowlkes JB. Spatial variability in acoustic backscatter as an indicator of tissue homogenate production in pulsed cavitational ultrasound therapy. IEEE Trans. Ultrason. Ferroelectr. Freq. Control. 2007;54(3):576–590. doi: 10.1109/tuffc.2007.280. [DOI] [PubMed] [Google Scholar]
- Pishchalnikov YA, McAteery JA, VonDerHaar RJ, Pishchalnikova IV, Williams JC, Evan AP. Detection of significant variation in acoustic output of an electromagnetic lithotripter. J. Urol. 2006;176:2294–2298. doi: 10.1016/j.juro.2006.07.055. [DOI] [PMC free article] [PubMed] [Google Scholar]
- Poliachik SL, Chandler WL, Mourad PD, Bailey MR, Bloch S, Cleveland RO, Kaczkowski P, Keilman G, Porter T, Crum LA. Effect of high-intensity focused ultrasound on whole blood with and without microbubble contrast agent. Ultrasound Med. Biol. 1999;25:991–998. doi: 10.1016/s0301-5629(99)00043-5. [DOI] [PubMed] [Google Scholar]
- Poliachik SL, Chandler WL, Ollos RJ, Bailey MR, Crum LA. The relation between cativation and platelet aggregation during exposure to high intensity focused ultrasound. Ultrasound Med. Biol. 2004;30(2):261–269. doi: 10.1016/j.ultrasmedbio.2003.10.012. [DOI] [PubMed] [Google Scholar]
- Roberts WW, Hall TJ, Ives K, Wolf JJS, Fowlkes JB, Cain CA. Pulsed cavitational ultrasound : a noninvasive technology for controlled tissue ablation (histotripsy) in the rabbit kidney. J.Urol. 2006;175:734–738. doi: 10.1016/S0022-5347(05)00141-2. [DOI] [PubMed] [Google Scholar]
- Rosenschein U, Furman V, Kerner E, Fabian I, Bernheim J, Eshel Y. Ultrasound imaging-guided noninvasive ultrasound thrombolysis: preclinical results. Circulation. 2000;102:238–245. doi: 10.1161/01.cir.102.2.238. [DOI] [PubMed] [Google Scholar]
- Sharafuddin MJ, Sun S, Hoballah JJ, Youness FM, Sharp WJ, Roh BS. Endovascular management of venous thrombotic and occlusive diseases of the lower extremities. J. Vasc. Interv. Radiol. 2003;14:405–423. doi: 10.1097/01.rvi.0000064849.87207.4f. [DOI] [PubMed] [Google Scholar]
- Siegel RJ, Atar S, Fishbei C, Brash AV, Peterson TM, Nagai T, Pal D, Nishioka T, Chae JS, Birnbaum Y, Zanelli C, Luo H. Noninvasive Transcutaneous Low Frequency Ultrasound Enhances Thrombolysis in Peripheral and Coronary Arteries. Echocardiography. 2001;18(3):247–257. doi: 10.1046/j.1540-8175.2001.00247.x. [DOI] [PubMed] [Google Scholar]
- Sweet SJ, McCarthy S, Steingart R, Callahan T. Hemolytic reactions mechanically induced by kinked hemodialysis lines. Am. J. Kidney Dis. 1996;27:262–266. doi: 10.1016/s0272-6386(96)90550-8. [DOI] [PubMed] [Google Scholar]
- Vennemann P, Lindken R, Westerwheel J. In vivo whole-field blood velocity measurement techniques. Exp. Fluids. 2007;42:495–511. [Google Scholar]
- Westermark S, Wiksell H, Elmqvist H, Hultenby K, Berglund H. Effect of externally applied focused acoustic energy on clot disruption in vitro. Clin. Sci. 1999;97:67–71. [PubMed] [Google Scholar]
- Winter PM, Shukla HP, Caruthers SD, Scott MJ, Fuhrhop RW, Robertson JD, Gaffney PJ, Wickline SA, Lanza GM. Molecular imaging of human thrombus with computed tomography. Acad Radiol. 2005;12(Suppl 1):S9–13. doi: 10.1016/j.acra.2005.02.016. [DOI] [PubMed] [Google Scholar]
- Xu Z, Ludomirsky A, Eun LY, Hall TL, Tran BC, Fowlkes JB, Cain CA. Controlled ultrasound tissue erosion. IEEE Trans. Ultrason. Ferroelectr. Freq. Control. 2004;51:726–736. doi: 10.1109/tuffc.2004.1308731. [DOI] [PMC free article] [PubMed] [Google Scholar]
- Xu Z, Fowlkes JB, Rothman ED, Levin AM, Cain CA. Controlled ultrasound tissue erosion: the role of dynamic interaction between insonation and microbubble activity. J. Acoust. Soc. Am. 2005;117:424–435. doi: 10.1121/1.1828551. [DOI] [PMC free article] [PubMed] [Google Scholar]
- Xu Z, Fowlkes JB, Cain CA. A new strategy to enhance cavitational tissue erosion by using a high intensity initiating sequence. IEEE Trans. Ultrason. Ferroelectr. Freq. Control. 2006a;53:1412–1424. doi: 10.1109/tuffc.2006.1665098. [DOI] [PMC free article] [PubMed] [Google Scholar]
- Xu Z, Fowlkes JB, Cain CA. A new strategy to enhance cavitational tissue erosion using a high-intensity, initiating sequence. IEEE Trans. Ultrason. Ferroelectr. Freq. Control. 2006b;53(8):1412–1424. doi: 10.1109/tuffc.2006.1665098. [DOI] [PMC free article] [PubMed] [Google Scholar]
- Xu Z, Hall TL, Fowlkes JB, Cain CA. Effects of acoustic parameters on bubble cloud dynamics in ultrasound tissue erosion (histotripsy) J. Acoust. Soc. Am. 2007;122(1):229–36. doi: 10.1121/1.2735110. [DOI] [PMC free article] [PubMed] [Google Scholar]
- Xu Z, Raghavan M, Hall TL, Mycek MA, Fowlkes JB, Cain CA. Evolution of bubble clouds induced by pulsed cavitational ultrasound therapy-histotripsy. IEEE Transactions on Ultrasonics, Ferroelectrics and Frequency Control. 2008;55(5):1122–1132. doi: 10.1109/TUFFC.2008.764. [DOI] [PubMed] [Google Scholar]
- Yu X, Song SK, Chen J, Scott MJ, Fuhrhop RJ, Hall CS, Gaffney PJ, Wickline SA, Lanza GM. High-resolution MRI characterization of human thrombus using a novel fibrin-targeted paramagnetic nanoparticle contrast agent. Magnet. Reson. Med. 2000;44:867–72. doi: 10.1002/1522-2594(200012)44:6<867::aid-mrm7>3.0.co;2-p. [DOI] [PubMed] [Google Scholar]


