

Abstract
Objective
To examine the relation of amyloid-beta (Aβ) levels in cerebral cortex with structural brain integrity and cognitive performance in older people with a Clinical Dementia Rating (CDR) of 0 (cognitively normal).
Methods
The relations between mean cortical [11C] PIB binding potential values, proportional to the density of fibrillar Aβ binding sites in the brain, concurrent regional brain volumes as assessed by magnetic resonance imaging, and both concurrent and longitudinal (up to 19 years) cognitive performance in multiple domains were examined in 135 CDR 0 individuals aged 65 to 88 years.
Results
Elevated cerebral Aβ levels, in some cases comparable to that seen in individuals with Alzheimer's disease, were observed in 29 CDR 0 individuals. Significantly smaller regional volumes in the hippocampus, temporal neocortex, anterior cingulate, and posterior cingulate were observed in these CDR 0 individuals with elevated Aβ levels. Concurrent cognitive performance was unrelated to Aβ levels but was related to regional brain volumes with the exception of caudate. Longitudinal cognitive decline was associated with elevated Aβ levels and decreased hippocampal volume. Decline was not limited to episodic memory but included working memory and visuospatial abilities as well.
Interpretation
[11C] PIB, an in vivo measure of cerebral amyloidosis, is associated with regionally specific brain atrophy cross-sectionally and a pattern of longitudinal cognitive decline in multiple cognitive domains that occurs prior to the clinical diagnosis of Alzheimer' disease. These findings contribute to the understanding of the cognitive and structural consequences of Aβ levels in CDR 0 older adults.
Keywords: Cognitive decline, cerebral Aβ, PIB, brain volumetry, preclinical Alzheimer's disease
Amyloid imaging with positron emission tomography (PET) and the [11C] benzothiazole tracer, Pittsburgh Compound-B (PIB), is a noninvasive method to assess cerebral amyloid-beta (Aβ) levels in the brains of living people 1 and provides an important new tool in the study of Alzheimer's disease (AD). PIB binds to senile plaques and to amyloid angiopathy in human postmortem specimens,2 and PIB uptake corresponds to post-mortem assessment of parenchymal Aβ plaques.3,4 Previous reports indicate that some unimpaired older adults at death have brain amyloid plaque levels, one of the hallmarks of AD, comparable to those measured in individuals with AD.5-7 Similarly, some unimpaired older people have elevated Aβ levels as assessed in vivo with [11C]PIB.8,9
Although abnormal amyloid plaque levels can occur in nondemented people, the extent to which their presence is associated with behavioral deficit or brain atrophy is unclear. Four studies addressed the relation between brain Aβ levels and concurrent objective cognitive performance in clinically unimpaired people; their results conflict. One study (N = 32)10 reported that higher plaque levels were correlated (−.38) with poorer episodic memory but not other types of cognitive ability. This might be expected if, as is usually thought, the earliest detectable deficit in AD is in episodic memory. Individuals with very early symptomatic AD may not satisfy the current criteria for clinical diagnosis of AD, which require another cognitive deficit and interference with function. Three other studies of 2011 and 43,12 and 3713 cognitively normal individuals failed to find any consistent relation between [11C]PIB level and any cognitive domain. In terms of brain atrophy, one of these studies observed correlations between [11C]PIB levels and hippocampal volume in clinically normal individuals.13 Differences between clinically normal individuals with or without elevated [11C]PIB levels have been observed in the temporal pole but not other cortical regions or the hippocampus.11,14
In this report we evaluated the relation between brain Aβ levels and concurrent cognitive performance as well as structural brain integrity in 135 people without clinically detectable cognitive impairment. Longitudinal cognitive performance was also examined to determine if the course varied with plaque burden or regional brain volume.
Methods
Participants
The 135 participants were recruited from the community and enrolled as controls in longitudinal studies at the Washington University Alzheimer Disease Research Center beginning in 1985. All were clinically evaluated to be cognitively healthy (Clinical Dementia Rating15 [CDR] = 0) at entry and remained CDR 0 through amyloid and structural imaging beginning in April, 2004. The CDR 0 designation excludes even minimal cognitive deficit, including mild cognitive impairment. See Table 1 for sample characteristics. All procedures were approved by the university's human subjects committee; written informed consent was obtained from participants and their collateral sources. Data from many of these participants have appeared in previous reports from the center.
Table 1.
Sample characteristics of [11C] PIB positive and negative groups*
| Negative group (n = 106) |
Positive group (n = 29) |
P values | |
|---|---|---|---|
| Age at amyloid imaging, y | 74.3 (6.2) | 75.6 (6.3) | .30 |
| Education, y | 15.5 (2.6) | 15.8 (3.7) | .57 |
| MMSE at amyloid imaging | 28.8 (1.2) | 28.4 (1.8) | .29 |
| Women, % | 68 | 62 | .55 |
| APOE > 1 ε4, % | 24 | 65 | <.0001 |
Abbreviations: MMSE, Mini Mental Status Exam;16 APOE, apolipoprotein E.
Values are expressed as mean (SD) unless otherwise indicated.
Clinical assessment
At entry and annual follow-up experienced clinicians determined if the person was impaired (CDR > 0) or not (CDR = 0) based solely on semistructured interviews with participants and their knowledgeable collateral sources (usually spouse or adult child) followed by a neurological examination of the participant. The clinician determined if any cognitive problems represented decline from former level of function for that individual and interfered to some degree with the person's ability to carry out accustomed activities. The assessment included a health history, medication inventory, assessment of depression and aphasia, and the MiniMental State Examination (MMSE).16 Clinicians varied from year to year; they were unaware of the results of previous clinical evaluations and of previous and current psychometric test results. The CDR staging and diagnostic protocol is sensitive to clinical progression and highly predictive (93%) of autopsy-confirmed AD.17,18
Psychometric assessment
A few weeks after the annual clinical assessment a 1.5-hour psychometric battery19 was administered. Examination of the factor structure of the battery revealed a stable four-factor structure of one global and three specific factors (all at the same level) in samples with autopsy-confirmed AD and no dementia.19 Four measures formed each of three specific factors; all 12 measures contributed to the global factor. The Verbal Memory factor included Wechsler Memory Scale (WMS)20 Logical Memory (immediate recall) and Associate Learning, Wechsler Adult Intelligence Scale (WAIS)21 Information, and the Boston Naming Test.22 The Visuospatial factor included Benton Visual Retention Test: Form D-Copy,23 WAIS Digit Symbol and Block Design, and Trailmaking A.24 The Working Memory factor included Letter Fluency (S, P),25 and WMS Mental Control and Digit Span (forward and backward). The Benton measure was dropped after 2003. Therefore, unweighted mean z scores on the remaining tests for each factor were averaged to form the four composites analyzed here. The reference group for the z scores was 310 participants (initial assessment) from the center's data archives who remained CDR 0 as long as they were followed, including many people from the current sample.
PIB imaging
Median time between PET imaging and concurrent clinical assessment was 3.9 months (range = same day to 1.4 years); median time to concurrent psychometric assessment was 4.1 months (range = same day to 1.5 years). Initial cognitive assessment occurred up to 19 years prior to imaging. Detailed information on the imaging procedures was reported previously.8 Imaging was conducted using a Siemens 961 HR ECAT PET scanner (CTI, Knoxville, KY) or a Siemens 962 HR+ ECAT PET scanner (CTI) in a darkened, quiet room. A thermoplastic mask minimized head motion, and participants kept their eyes closed during the scan. Radiochemical synthesis of [11C]PIB was conducted according to published literature.26 After a transmission scan to measure attenuation, [11C]PIB (5.3 to 20.1 mCi, mean = 12.1 mCi) was administered intravenously simultaneous with initiation of a 60-minute dynamic PET scan in three dimensional mode (septa retracted; 24 × 5 seconds frames; 9 × 20 seconds frames; 10 × 1 minute frames; and 9 × 5 minute frames). The measured attenuation factors and a ramp filter were used to reconstruct the dynamic PET images. A fully three-dimensional single scatter simulation algorithm was used to correct scatter.27 Participants also underwent anatomic magnetic resonance imaging (MRI) using medium resolution (1mm × 1mm × 1.25 mm) MPRAGE T1- weighted volume acquisitions. A high-resolution, low noise anatomic image data set for region-of-interest determination was created for each participant by aligning and averaging two 133 MPRAGE sequences.8,28 Each participant's structural MRI was registered to a standard atlas target29 that minimizes bias due to atrophy. Alignment of PET and MRI within a participant was accomplished with an in-house cross-modal registration algorithm.8 ANALYZE (Mayo Clinic, Rochester, MN) was then used to create three-dimensional regions of interest for each participant based on the individual's MRI. Detailed information on the boundaries of specific regions is available.8 Regions of interest were then applied to unblurred images of the PET dynamic data, yielding high-resolution regional time-activity curves. Each time-activity curve was analyzed for PIB-specific binding using the Logan graphical analysis,30 with cerebellum data as a reference tissue input function.31 The cerebellum served as the reference because there is little specific binding of PIB in postmortem samples of cerebellar cortex even among those with AD at autopsy.26 The “slope” produced by Logan graphical analysis is equal to the tracer distribution volume (DV) in the tissue of interest when compared with the input function. A binding potential (BP)32 for each region of interest was calculated using the equation BP = DV – 1 to express the regional binding values in a manner proportional to the number of binding sites. BP values from the prefrontal cortex, gyrus rectus, lateral temporal, and precuneus regions of interest were averaged to calculate a mean cortical binding potential (MCBP) value based on brain regions known to have high PIB uptake among participants with AD.8 Two measures were used in analyses: the quantitative MCBP and MCBP dichotomized at 0.20 33 so that annual rates of cognitive change could be estimated for those with (positive) and without (negative) substantial brain amyloid plaque burden.
Regional volumetry
The interval between structural imaging ranged from 0 days to 1.6 years (median = 3.4 months) for PET, 0 days to 1.25 years (median = 3.1 months) for clinical assessment, and 0 days to 1.5 years (median = 2.9 months) for psychometrics. One to four T1-weighted images were acquired in one scanning session in 118 participants on either a Sonata 1.5T (n = 4), Vision 1.5T (n = 34), or Trio 3.0T scanner (n = 80). There was no difference in proportion of individuals with MCBP ≤ 0.20 across scanners. Image processing steps are described in detail in previous publications28,34,35and include motion correction, averaging across scans, atlas transformation, and inhomogeneity correction. Processing resulted in registered structural data resampled to 1 mm3 voxels in the atlas space of Talairach and Tournoux.29 Regional volume estimates were obtained using the Freesurfer image analysis suite, which implements an automated probabilistic labeling procedure.35,36 Each voxel in an image is assigned a neuroanatomical label based on probabilistic information from a manually labeled training set that included healthy adults and AD patients. This technique generates volumes with a high correspondence to manually generated volumes.36 Regions of interest (ROI) included the caudate nucleus, prefrontal cortex (combined superior, middle and inferior frontal gyri), orbital frontal, lateral parietal (combined inferior parietal, superior parietal, and supramarginal regions), temporal neocortical (combined superior, middle, and inferior temporal gyri), anterior cingulate, posterior cingulate, precuneus, hippocampal, and parahippocampal regions (including entorhinal cortex) regions. Intracranial volume (ICV) was used to adjust ROIs for head size variation based on a covariance approach: Adjusted volume in cubic millimeters = raw volume − b × (ICV −mean ICV), where b is the slope of the regression of a region-of-interest volume on ICV and mean ICV. Although there are concerns regarding biases in across scanner and field strength aggregation, there is also evidence of reliability of some Freesurfer-derived quantitative estimates.37,38 A comparison across the Vision 1.5T and Trio 3T scanners of Freesurfer-derived volumes for regions examined here yielded an average intraclass correlation of .81 ( = 13).
Statistical analyses
Variables were assessed for normality with one-sample Kolmogrov-Smirnov tests. Pearson correlations were computed for quantitative variables; φ was used for two dichotomous variables; t and chi-square tests were used for cross-sectional group comparisons. Statistical significance was defined by P < .05.
The longitudinally measured cognitive composites while individuals were CDR 0 were examined using PROC MIXED (SAS 9.1; SAS Institute, Inc, Cary, NC). In the analysis examining amyloid burden, the model included the fixed effect quantitative MCBP and the random variable time from date of imaging (negative values before imaging, positive values after). A significant interaction between MCBP and time indicated that rate of longitudinal change varied with level of brain Aβ. Analogous analyses were conducted using regional brain volume instead of MCBP. To reduce capitalization on chance only three regions (hippocampus, posterior cingulate, precuneus) known to be affected early in the course of AD39 or to have high Aβ deposition1,8 were examined. The longitudinal analyses were repeated using MCBP dichotomized at 0.2033 and hippocampal volume dichotomized at the 25th percentile to estimate rates of annual cognitive change (i.e., slopes in z score units) for those with high versus low amyloid burden or volume loss.
Results
The cognitive composites and all measures of regional volume were normally distributed, but MCBP was skewed. As shown in Table 1, 29 people with CDR 0 at time of imaging had values ≥ 0.20. MCBP was uncorrelated with age, education, gender, or MMSE (rs ≤ .14), but 65% of the PIB positive group had one or two APOE ε4 alleles compared with 24% in PIB negative group (ϕ=.29). MCBP was also uncorrelated with any of the cognitive composites (global, −.05; verbal memory, −.09; spatial, .02; working memory, .03) or individual cognitive measures (rs ranged from −.14 to .06) assessed concurrently with PET imaging. As depicted in Figure 1, significant differences in volumes between the PIB positive (n = 26) and negative (n = 92) groups were observed in hippocampus, temporal neocortex, anterior cingulate, and posterior cingulate with trends in precuneus (P = .08) and parahippocampal regions (P = .07). There were no differences in the remaining regions. Controlling for APOE status did not change the results. Similar results were obtained with the data from the scanner with the largest sample (Trio 3T; 63 PIB negative, 17 PIB positive).
Figure 1.

Bar graphs depicting mean regional volumes in the amyloid positive and negative groups. Error bars are SEM.
There was a significant interaction between time and MCBP in the longitudinal analyses for two specific composites: visuospatial and working memory. As shown in Table 2 slopes for the PIB negative group were not significantly different from 0, whereas slopes for the positive group were significantly different from 0 and downward for the visuospatial and working memory composites. Figure 2 illustrates the actual longitudinal course on the visuospatial composite of participants from the PIB positive group who had at least four cognitive assessments; those with fewer assessments were not included in the figure to reduce overlap.
Table 2.
Annual rate of change in [11C] PIB positive and negative groups on four cognitive composites (z scores)
| Composite | Negative group | Positive group | Group × Time P values |
|---|---|---|---|
| Global, slope (SE) | −.01 (.01) | −.02 (.01) | .25 |
| Verbal memory, slope (SE) | .01 (.01) | .00 (.02) | .65 |
| Visuospatial, slope (SE) | −.01 (.01) | −.05 (.01) | .03 |
| Working memory, slope (SE) | .00 (.01) | −.04 (.01) | .02 |
Figure 2.
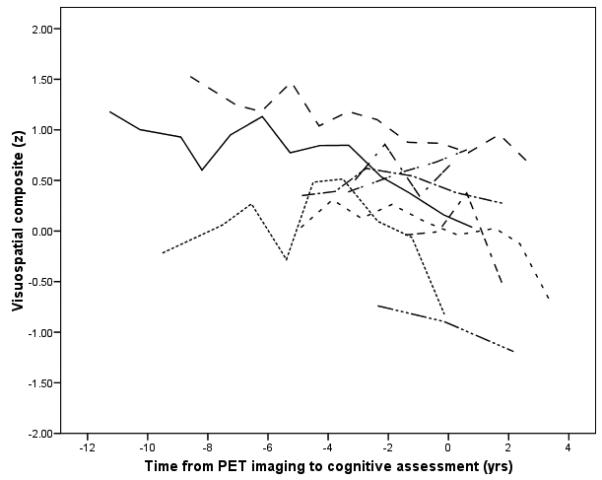
Longitudinal course of participants with high amyloid values (MCBP ≥ .20) and at least four cognitive assessments. Zero on the time axis is time of imaging.
The nonsignificant group by time interaction for verbal memory was surprising given the common expectation that very early AD affects memory. Because the verbal memory factor included both episodic and semantic memory measures, the four individual tests were examined separately. The interaction was significant for Associate Learning, a standard test of episodic memory. The slope for the PIB negative group was upward (0.03), whereas it was downward (−0.05) for the PIB positive group. The interaction was not significant for any of the other verbal memory measures. The lack of significance on Logical Memory may be related to substantial missing data on this measure near the time of PET imaging; the funding agency required substitution of a different version on September 1, 2005.
In terms of the relation between regional volume and cognition measured concurrently, the global composite was moderately correlated with all regions except caudate (rs = .19 to .41). The strongest regional correlations were seen with the spatial composite (rs = .29 to .54). The verbal composite was modestly correlated with volume in all regions (rs = .21 to .28) except caudate and parahippocampus. Working memory was correlated only with volume in lateral temporal (r = .27) and anterior cingulate (r = .19) regions. In longitudinal analyses relating regional volume to cognitive course, there was a significant interaction of hippocampus volume and time for the global, verbal, and spatial composites and a trend for working memory. Dichotomizing hippopcampal volume at the 25th percentile produced the slopes shown in Table 2. Those with less volume had negative slopes. The interaction between time and volume in either the posterior cingulate or the precuneus was not significant for any of the composites.
Discussion
The longitudinal cognitive decline in PIB-positive older adults and volumetric reductions in multiple brain regions suggest that cerebral amyloidosis in nondemented aging is not a benign process. Over a fifth (22%) of individuals with a CDR of 0 had substantial cerebral amyloidosis. The reported prevalence of symptomatic AD at age 75 years in population studies.40,41 is consistent with this frequency of PIB positive, cognitively normal individuals and provides inferential support for the notion of preclinical AD. Estimates of preclinical AD based on neuropathological studies5-7 are somewhat higher (30-40%), but those samples were older than this sample examined in vivo (e.g., 85 vs. 75 years). Because AD is age-associated, a higher prevalence rate is expected in older samples. Elevated [11C]PIB in CDR 0 individuals was accompanied by smaller hippocampal and temporal neocortical volumes, brain regions known to be affected early in the course of the disease.39 As the hippocampus has only mild levels of Aβ binding,8 these volumetric reductions may indicate pathological processes (e.g, neurofibrillary pathology) in addition to amyloid deposition. In either case, the existence of atrophy further substantiates the concept of preclinical AD. Structural imaging work has focused on the medial temporal lobe, but atrophy was also observed in cingulate cortex, which is consistent with the topographical distribution of gray matter loss observed in voxel-wise analyses in AD.42 Smaller hippocampal volume13and thinning of the temporal pole14 has been observed in nondemented individuals with amyloid deposition. Reduced cerebrospinal fluid levels of Aβ42, another marker of cerebral amyloidosis in preclinical AD, also is associated with whole brain atrophy in cognitively normal individuals.43
The longitudinal cognitive course for people with low levels of Aβ in the brain and greater volume in the hippocampus indicates that most older adults maintained an essentially flat cognitive trajectory in contrast with the slightly downward cognitive course for those with either elevated Aβ levels or reduced hippocampal volume. Annual estimated slopes for the PIB-positive group were not large, but they included the entire course while CDR 0. More dramatic decline in performance would be expected if it were possible to identify when a person changes from a flat course to a downward one and if more sensitive measures were available, especially of memory. Because PIB and volume values were available from only one time it is unknown if the cognitive decline began before, concurrently with, or after increased cerebral Aβ burden or hippocampal atrophy. Clearly, however, amyloidosis, atrophy, and deterioration in cognitive test performance occur prior to clinical diagnosis of dementia, even at a center that successfully diagnoses dementia much earlier than is typical.18
The factors examined here are not process-pure measures, but decline occurred in visuospatial ability and working memory as well as a measure of episodic memory. This widespread effect on cognition is consistent with the widespread distribution of cerebral amyloid burden observed here and reported previously.8,9,11 Continued focus solely on episodic memory in diagnosing dementia means that other types of cognitive deficits that may even precede memory difficulties are not evaluated, making it difficult to assess their influence. Additionally, dependence on cognitive test performance at a single point in time is ineffectual for detection of dementia in its earliest stage. Although correlated with regional brain volume, concurrent cognitive measures were unrelated to Aβ; time between cognitive and amyloid assessment was occasionally lengthy, but 85% were within 6 months. It appears that individual differences in cognitive ability, including memory, are too large to allow effective assessment of very early symptomatic AD through comparison with normative values.18 The individual's current performance must be compared with previous levels either by serial testing or by informant-based clinical assessment that compares current functioning with previously attained levels.
Table 3.
Annual rate of change on four cognitive composites (z scores) in individuals above and below the 25th percentile of hippocampal volume
| Composite | Above | Below | Volume × Time P values |
|---|---|---|---|
| Global, slope (SE) | .00 (.01) | −.03 (.01) | .01 |
| Verbal memory, slope (SE) | .03 (.01) | −.01 (.02) | .01 |
| Visuospatial, slope (SE) | .00 (.01) | −.05 (.01) | .01 |
| Working memory, slope (SE) | −.01 (.01) | −.03 (.01) | .06 |
Acknowledgments
Supported by National Institute on Aging grants P50 AG05861, P01 AG03991, P01 AG026276, and P30 NS048056 and by the Charles and Joanne Knight Alzheimer Research Initiative of the Washington University (St. Louis, MO) Alzheimer Disease Research Center (ADRC). The authors thank the ADRC's Clinical Core for the clinical and psychometric assessments, the Imaging Core, particularly Tessa Mazzocco, Marlisa Isom, and Lindsay Casmaer, for the structural MRI data, and the Genetics Core for the apolipoprotein E data.
Reference List
- 1.Klunk WE, Engler H, Nordberg A, Wang Y, Blomqvist G, Holt DP, Bergström M, Savitcheva I, Huang G-F, Estrada S, Ausén B, Debnath ML, Barletta J, Price JC, Sandell J, Lopresti BJ, Wall A, Koivisto P, Antoni G, Mathis CA, Långström B. Imaging brain amyloid in Alzheimer's disease with Pittsburgh Compound-B. Ann Neurol. 2004;55:306–319. doi: 10.1002/ana.20009. [DOI] [PubMed] [Google Scholar]
- 2.Lockhart A, Lamb JR, Osredkar T, Sue LI, Joyce JN, Ye L, Libri V, Leppert D, Beach. TG. PIB is a non-specific imaging marker of amyloid-beta (AB) peptide-related cerebral amyloidosis. Brain. 2007;130:2607–2615. doi: 10.1093/brain/awm191. [DOI] [PubMed] [Google Scholar]
- 3.Leinonen V, Alafuzoff I, Aalto S, Suotunen T, Savolainen S, Någren K, Tapiola T, Pirttilä T, Rinne J, Jääskelänen JE, Soininen H, Rinne JO. Assessment of beta-amyloid in a frontal cortical brain biopsy specimen and by positron emission tomography with carbon 11-labeled Pittsburgh Compound B. Arch Neurol. 2008;65:1304–1309. doi: 10.1001/archneur.65.10.noc80013. [DOI] [PubMed] [Google Scholar]
- 4.Ikonomovic MD, Klunk WE, Abrahamson EE, Mathis CA, Price JC, Tsopelas ND, Lopresti BJ, Ziolko S, Bi W, Paljug WR, Debnath ML, Hope CE, Isanski BA, Hamilton RL, DeKosky ST. Post-mortem correlates of in-vivo PiB-PET amyloid imaging in a typical case of Alzheimer's disease. Brain. 2008;131:1630–1645. doi: 10.1093/brain/awn016. [DOI] [PMC free article] [PubMed] [Google Scholar]
- 5.Price JL, Morris JC. Tangles and plaques in nondemented aging and “preclinical” Alzheimer's disease. Ann Neurol. 1999;45:358–368. doi: 10.1002/1531-8249(199903)45:3<358::aid-ana12>3.0.co;2-x. [DOI] [PubMed] [Google Scholar]
- 6.Bennett DA, Schneider JA, Arvanitakis Z, Kelly JF, Aggarwal NT, Shah RC, Wilson RS. Neuropathology of older persons without cognitive impairment from two community-based studies. Neurology. 2006;66:1837–1844. doi: 10.1212/01.wnl.0000219668.47116.e6. [DOI] [PubMed] [Google Scholar]
- 7.Price JL, McKeel DW, Buckles VD, Roe CM, Xiong C, Grundman M, Hansen LA, Petersen RC, Parisi JE, Dickson DW, Smith CD, Davis DG, Schmitt FA, Markesbery WR, Kaye J, Kurlan R, Hulette C, Kurland BF, Higdon R, Kukull W, Morris JC. Neuropathology of nondemented aging: presumptive evidence for preclinical Alzheimer disease. Neurobiol Aging. 2009 doi: 10.1016/j.neurobiolaging.2009.04.002. In Press. [DOI] [PMC free article] [PubMed] [Google Scholar]
- 8.Mintun MA, LaRossa GN, Sheline YI, Dence CS, Lee SY, Mach RH, Klunk WE, Mathis CA, DeKosky ST, Morris JC. [11C] PIB in a nondemented population: Potential antecedent marker of Alzheimer disease. Neurology. 2006;67:446–452. doi: 10.1212/01.wnl.0000228230.26044.a4. [DOI] [PubMed] [Google Scholar]
- 9.Rowe CC, Ng S, Ackermann U, Gong SJ, Pike K, Savage G, Cowie TF, Dickinson KL, Maruff P, Darby D, Smith C, Woodward M, Merory J, Tochon-Danguy H, O'Keefe G, Klunk WE, Mathis CA, Price JC, Masters CL, Villemagne VL. Imaging B-amyloid burden in aging and dementia. Neurology. 2007;68:1718–1725. doi: 10.1212/01.wnl.0000261919.22630.ea. [DOI] [PubMed] [Google Scholar]
- 10.Pike KE, Savage G, Villemagne VL, Ng S, Moss SA, Maruff P, Mathis CA, Klunk WE, Masters CL, Rowe CC. Beta-amyloid imaging and memory in non-demented individuals: evidence for preclinical Alzheimer's disease. Brain. 2007;130:2837–2844. doi: 10.1093/brain/awm238. [DOI] [PubMed] [Google Scholar]
- 11.Jack CR, Lowe VJ, Senjem ML, Weigand SD, Kemp BJ, Shiung MM, Knopman DS, Boeve BF, Klunk WE, Mathis CA, Petersen RC. 11C PIB and structural MRI provide complementary information in imaging of Alzheimer's disease and amnestic mild cognitive impairment. Brain. 2008;131:665–680. doi: 10.1093/brain/awm336. [DOI] [PMC free article] [PubMed] [Google Scholar]
- 12.Aizenstein HJ, Nebes RD, Saxton JA, Price JC, Mathis CA, Tsopelas ND, Ziolko SK, James JA, Snitz BE, Houck PR, Bi W, Cohen AD, Lopresti BJ, DeKosky ST, Halligan EM, Klunk WE. Frequent amyloid deposition without significant cognitive impairment among the elderly. Arch Neurol. 2008;65:1509–1517. doi: 10.1001/archneur.65.11.1509. [DOI] [PMC free article] [PubMed] [Google Scholar]
- 13.Mormino EC, Kluth JT, Madison CM, Rabinovici GD, Baker SL, Miller BL, Koeppe RA, Mathis CA, Weiner MW, Jagust WJ. Alzheimer's Disease Neuroimaging Initiative. Episodic memory loss is related to hippocampal-mediated beta-amyloid deposition in elderly subjects. Brain. 2009;132:1310–1323. doi: 10.1093/brain/awn320. [DOI] [PMC free article] [PubMed] [Google Scholar]
- 14.Dickerson BC, Bakkour A, Salat DH, Feczko E, Pacheco J, Greve DN, Grodstein F, Wright CI, Blacker D, Rosas HD, Sperling RA, Atri A, Growdon JH, Hyman BT, Morris JC, Fischl B, Buckner RL. The cortical signature of Alzheimer's disease: regionally specific cortical thinning relates to symptom severity in very mild to mild AD dementia and is detectable in asymptomatic amyloid-positive individuals. Cereb Cortex. 2009;19:497–510. doi: 10.1093/cercor/bhn113. [DOI] [PMC free article] [PubMed] [Google Scholar]
- 15.Morris JC. The Clinical Dementia Rating (CDR): Current version and scoring rules. Neurology. 1993;43:2412–2414. doi: 10.1212/wnl.43.11.2412-a. [DOI] [PubMed] [Google Scholar]
- 16.Folstein MF, Folstein SE, McHugh PR. Mini-mental State: A practical method for grading the cognitive state of patients for the clinicians. J Psychiatr Res. 1975;12:189–198. doi: 10.1016/0022-3956(75)90026-6. [DOI] [PubMed] [Google Scholar]
- 17.Berg L, McKeel DW, Jr., Miller JP, Storandt M, Rubin EH, Morris JC, Baty J, Coats M, Norton J, Goate AM, Price JL, Gearing M, Mirra SS, Saunders AM. Clinicopathologic studies in cognitively healthy aging and Alzheimer disease: Relation of histologic markers to dementia severity, age, sex, and apolipoprotein E genotype. Arch Neurol. 1998;55:326–335. doi: 10.1001/archneur.55.3.326. [DOI] [PubMed] [Google Scholar]
- 18.Storandt M, Grant EA, Miller JP, Morris JC. Longitudinal course and neuropathological outcomes in original versus revised MCI and in PreMCI. Neurology. 2006;67:467–473. doi: 10.1212/01.wnl.0000228231.26111.6e. [DOI] [PubMed] [Google Scholar]
- 19.Johnson DK, Storandt M, Morris JC, Langford ZD, Galvin JE. Cognitive profiles in dementia: Alzheimer disease vs. healthy brain aging. Neurology. 2008;71:1783–1789. doi: 10.1212/01.wnl.0000335972.35970.70. [DOI] [PMC free article] [PubMed] [Google Scholar]
- 20.Wechsler D, Stone CP. Manual: Wechsler Memory Scale. Psychological Corporation; New York: 1973. [Google Scholar]
- 21.Wechsler D. Manual: Wechsler Adult Intelligence Scale. Psychological Corporation; New York: 1955. [Google Scholar]
- 22.Goodglass H, Kaplan E. The assessment of aphasia and related disorders. 2 ed. Lea & Febiger; Philadelphia: 1983. [Google Scholar]
- 23.Benton AL. The revised visual retention test: Clinical and experimental applications. Psychological Corporation; New York: 1963. [Google Scholar]
- 24.Armitage SG. An analysis of certain psychological tests used in the evaluation of brain injury. Psych Mono. 1946;60:1–48. [Google Scholar]
- 25.Thurstone LL, Thurstone LG. Examiner Manual for the SRA Primary Mental Abilities Test. Science Research Associates; Chicago: 1949. [Google Scholar]
- 26.Mathis CA, Wang Y, Holt DP, Huang GF, Debnath ML, Klunk WE. Synthesis and evaluation of 11C-labeled 6-substituted 2-arylbenzothiazoles as amyloid imaging agents. J Med Chem. 2003;46:2740–2754. doi: 10.1021/jm030026b. [DOI] [PubMed] [Google Scholar]
- 27.Accorsi R, Adam LE, Werner ME, Karp JS. Optimization of a fully 3D single scatter simulation algorithm for 3D PET. Phys Med Biol. 2004;49:2577–2598. doi: 10.1088/0031-9155/49/12/008. [DOI] [PubMed] [Google Scholar]
- 28.Buckner RL, Head D, Parker J, Fotenos AF, Marcus D, Morris JC, Snyder AZ. A unified approach for morphometric and functional data analysis in young, old, and demented adults using automated atlas-based head size normalization: reliability and validation against manual measurement of total intracranial volume. NeuroImage. 2004;23:724–738. doi: 10.1016/j.neuroimage.2004.06.018. [DOI] [PubMed] [Google Scholar]
- 29.Talairach J, Tournoux P. Co-planar stereotaxic atlas of the human brain. Thieme Medical Publishers; Stuttgart: 1988. [Google Scholar]
- 30.Logan J, Fowler JS, Volkow ND, Wolf AP, Dewey SL, Schlyer DJ, MacGregor RR, Hitzemann R, Bendriem B, Gatley SJ. Graphical analysis of reversible radioligand binding from time-activity measurements applied to [N-11C-methyl]-(−)cocaine PET studies in human subjects. J Cereb Blood Flow Metab. 1990;10:740–747. doi: 10.1038/jcbfm.1990.127. [DOI] [PubMed] [Google Scholar]
- 31.Logan J, Fowler JS, Volkow ND, Wang GJ, Ding YS, Alexoff DL. Distribution volume ratios without blood sampling from graphical analysis of PET data. J Cereb Blood Flow Metab. 1996;16:834–840. doi: 10.1097/00004647-199609000-00008. [DOI] [PubMed] [Google Scholar]
- 32.Mintun MA, Raichle ME, Kilbourn MR, Wooten GF, Welch MJ. A quantitative model for the in vivo assessment of drug binding sites with positron emission tomography. Ann Neurol. 1984;15:217–227. doi: 10.1002/ana.410150302. [DOI] [PubMed] [Google Scholar]
- 33.Fagan AM, Roe CM, Xiong C, Morris JC, Holtzman DM. Cerebrospinal fluid tau/ß-amyloid42 ratio as a prediction of cognitive decline in nondemented older adults. Arch Neurol. 2007;64:343–349. doi: 10.1001/archneur.64.3.noc60123. [DOI] [PubMed] [Google Scholar]
- 34.Head D, Snyder AZ, Girton LE, Morris JC, Buckner RL. Frontal-hippocampal double dissociation between normal aging and Alzheimer's disease. Cerebral Cortex. 2005;15:732–739. doi: 10.1093/cercor/bhh174. [DOI] [PubMed] [Google Scholar]
- 35.Desikan RS, Segonne F, Fischl B, Quinn BT, Dickerson BC, Blacker D, Buckner RL, Dale AM, Maguire RP, Hyman BT, Albert MS, Killiany RJ. An automated labeling system for subdividing the human cerebral cortex on MRI scans into gyral based regions of interest. NeuroImage. 2006;31:968–980. doi: 10.1016/j.neuroimage.2006.01.021. [DOI] [PubMed] [Google Scholar]
- 36.Fischl B, Salat DH, Busa E, Albert M, Dieterich M, Haselgrove C, van der Kouwe A, Killiany R, Kennedy D, Klaveness S, Montillo A, Makris N, Rosen B, Dale AM. Whole brain segmentation: automated labeling of neuroanatomical structures in the human brain. Neuron. 2002;33:341–55. doi: 10.1016/s0896-6273(02)00569-x. [DOI] [PubMed] [Google Scholar]
- 37.Han X, Jovicich J, Salat DH, van der Kouwe A, Quinn B, Czanner S, Busa E, Pacheco J, Albert M, Killiany R, Maguire P, Rosas D, Makris N, Dale A, Dickerson B, Fischl B. Reliability of MRI-derived measurements of human cerebral cortical thickness: the effects of field strength, scanner upgrade and manufacturer. NeuroImage. 2006;32:180–94. doi: 10.1016/j.neuroimage.2006.02.051. [DOI] [PubMed] [Google Scholar]
- 38.Jovicich J, Czanner S, Han X. MRI-derived measurements of human subcortical, ventricular and intracranial brain volumes: Reliability effects of scan sessions, acquisition sequences, data analyses, scanner upgrade, scanner vendors and field strengths. NeuroImage. 2009;46:177–192. doi: 10.1016/j.neuroimage.2009.02.010. [DOI] [PMC free article] [PubMed] [Google Scholar]
- 39.Braak H, Braak E. Neuropathological stageing of Alzheimer-related changes. Acta Neuropathol. 1991;82:239–259. doi: 10.1007/BF00308809. [DOI] [PubMed] [Google Scholar]
- 40.Evans DA, Funkenstein HH, Albert MS, Scherr PA, Cook NR, Chown MJ, Hebert LE, Hennekens CH, Taylor JO. Prevalence of Alzheimer's disease in a community population of older persons: Higher than previously reported. JAMA. 1989;262:2551–2556. [PubMed] [Google Scholar]
- 41.Fitzpatrick AL, Kuller LH, Ives DG, Lopez OL, Jagust W, Breitner JCS, Jones B, Lyketsos C, Dulberg C. Incidence and prevalence of dementia in the cardiovascular health study. Geriatr Soc. 2004;52:195–204. doi: 10.1111/j.1532-5415.2004.52058.x. [DOI] [PubMed] [Google Scholar]
- 42.Frisoni GB, Testa C, Zorzan A, Sabattoli F, Beltramello A, Soininen H, Laakso MP. Detection of grey matter loss in mild Alzheimer's disease with voxel based morphometry. J Neurol Neurosurg Psychiatr. 2002;73:657–664. doi: 10.1136/jnnp.73.6.657. [DOI] [PMC free article] [PubMed] [Google Scholar]
- 43.Fagan AM, Head D, Shah AR, Marcus D, Mintun M, Morris JC, Holtzman DH. Decreased cerebrospinal fluid AB42 correlates with brain atrophy in cognitively normal elderly. Ann Neurol. 2009;65:176–183. doi: 10.1002/ana.21559. [DOI] [PMC free article] [PubMed] [Google Scholar]